. 2025 Apr;122(13):e2423130122.
doi: 10.1073/pnas.2423130122. Epub 2025 Mar 24.

The FBXW7-KMT2 axis in cancer-associated fibroblasts controls tumor growth via an epigenetic-paracrine mechanism

Affiliations

The FBXW7-KMT2 axis in cancer-associated fibroblasts controls tumor growth via an epigenetic-paracrine mechanism

Lu Yin et al. Proc Natl Acad Sci U S A. 2025 Apr.

Abstract

F-box and WD repeat domain-containing 7 (FBXW7) is a tumor suppressor that targets various oncoproteins for degradation, but its role in modulating cancer-associated fibroblasts (CAFs) in the tumor microenvironment remains elusive. Here, we report that FBXW7 expression is gradually downregulated in CAFs during the progression of human pancreatic and lung cancers. Mechanically, FBXW7 inhibits histone lysine methyltransferase 2 (KMT2) methyltransferase activity via retinoblastoma binding protein 5 (RbBP5) binding, whereas FBXW7 depletion abrogates the binding to activate KMT2, leading to increased H3K4 methylations and global upregulation of gene expression. Activation of the interleukin-17 (IL-17) signaling pathway triggers the secretion of cytokines and chemokines to promote migration, invasion, and sphere formation of lung cancer cells. Coinjection of Fbxw7-depleted mouse embryonic fibroblasts with cancer cells enhances in vivo tumor growth, demonstrating a paracrine effect. Hypoxia downregulates CAF FBXW7 via ETS proto-oncogene 1 (ETS1) to increase H3K4 methylation, whereas conditioned media from hypoxia-exposed CAFs promotes migration and invasion of pancreatic cancer cells, highlighting FBXW7's tumor-suppressing role through KMT2 inactivation.

Keywords: FBXW7 E3 ligase; IL-17 signaling pathway; epigenetic regulation; methyltransferase; paracrine effect.


Conflict of interest statement

Competing interests statement:The authors declare no competing interest.

Figures

Fig. 1.
Fig. 1.
FBXW7 expression in CAFs is progressively decreased as the diseases advance in pancreatic and lung cancer tissues. (A) UMAP visualization of the cell populations colored by annotated cell types in pancreatic cancer tissues. (BH) Bubble charts show FBXW7 expression levels in pancreatic cancer tissues across different clinical stages in CAF (B), Epithelial (C) CD4+T (D), CD8+T (E), NK (F), Treg (G), and myeloid (H). (I) UMAP visualization of the cell populations colored by annotated cell types in lung cancer tissues. (JP) Bubble charts show FBXW7 expression levels in lung cancer tissues across different clinical stages in CAF (J), Epithelial (K), CD4+T (L), CD8+T (M), NK (N), Treg (O), and myeloid (P).
Fig. 2.
Fig. 2.
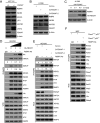
FBXW7 directly interacts with RbBP5 in the KMT2 complex. (A) Six members of the KMT2 complex were identified as potential FBXW7 binding proteins by mass spectrometry. (B) HEK293 cells were transfected with FLAG-FBXW7, followed by IP with FLAG and immunoblotting (IB). WCE: whole cell extracts. (C and D) HCT116 (C) and MEFs (D) were harvested for IP with FBXW7 or RbBP5 Ab, along with normal IgG, followed by IB analysis. (E) Purified proteins were added to the reaction system, followed by pull-down with Ni beads and IB analysis. (F) HCT116 FBXW7−/− cells were cotransfected with green fluorescent protein (GFP)-FBXW7α and FLAG-RbBP5 for 48 h and then stained with FLAG Ab, followed by photography under a fluorescence microscope. (Scale bar: 10 μm.) (G) Truncated mutants of FBXW7 and RbBP5. FBXW7: (DD: dimerization domain; F-box: SKP1 binding region; WD40: substrate recognition and binding region); RbBP5: (WD40 propeller: consisting of seven repeats of the WD40 propeller; AS: activation segment; ABM: ASH2L-binding motif; WBM: WDR5-binding motif; CTD: C-terminal distal domain).
Fig. 3.
Fig. 3.
FBXW7 does not destabilize RbBP5, but competitively inhibits RbBP5 binding to the KMT2 complexes. (A) HCT116 cells with or without FBXW7 deletion were harvested for IB analysis. (B) H1299 cells were transfected with indicated siRNA, followed by IB analysis. (C) H1299 cells were transfected with the indicated amounts of HA-FBXW7, followed by IB analysis. (D) HEK293 cells were transfected with indicated amounts of HA-FBXW7 for 48 h, followed by IP with RbBP5 Ab and IB. (E and F) HEK293 cells were transfected with indicated siRNA for 48 h (E). Paired MEFs (Fbxw7+/+; p53fl/fl and Fbxw7fl/fl; p53fl/fl) were infected with adenovirus expressing Cre recombinase (Ad-Cre) for 72 h (F). Cells were then harvested for IP with RbBP5 Ab, followed by IB analysis.
Fig. 4.
Fig. 4.
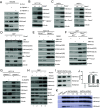
FBXW7 inhibits KMT2 methyltransferase activity. (A) HEK293 cells were transfected with indicated siRNA for 48 h, followed by IB analysis. (B and C) HCT116 cells with or without FBXW7 deletion (B) or two independent Fbxw7fl/fl MEFs infected with Ad-Cre or Ad-GFP for 72 h (C) were harvested for IB analysis. (D) Fbxw7+/+; p53fl/fl and Fbxw7fl/fl; p53fl/fl MEFs were infected with Ad-Cre or Ad-GFP for 72 h and then subjected to IB analysis. (E and F) Paired HCT116 (E) or MEFs (F) with or without FBXW7 deletion were treated with DMSO or MM-102 at 40 μM for 72 h, followed by IB analysis. (G) Paired HCT116 cells were transfected with indicated siRNA for 72 h, followed by IB analysis. (H) Fbxw7+/+; Kmt2d+/+, Fbxw7fl/fl; Kmt2dfl/fl, Fbxw7+/+; Kmt2dfl/fl and Fbxw7fl/fl; Kmt2d+/+ MEFs from the embryos of the same pregnant mouse were infected with Ad-Cre to delete Fbxw7 and/or Kmt2d as indicated, followed by IB analysis. (I and J) The purified KMT2A and FBXW7 proteins were added into histone methyltransferase (HMT) reaction system at the indicated molar ratios, together with NCP as the substrate and SAM as the methyl source, followed by IB for H3K4 methylations (I) or in vitro HMT assay (J). KMT2A is a complex of KMT2AWIN-SET (3,754 to 3,969 aa), RbBP5, ASH2L, WDR5, and DPY30. n = 3; mean ± SD, ns: no significance, ***P < 0.001. (K) The purified KMT2A and two FBXW7 truncated mutants were added into the HMT reaction system at the indicated molar ratios, followed by IB for H3K4 methylations.
Fig. 5.
Fig. 5.
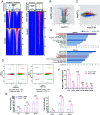
FBXW7 depletion alters global gene expression via enhanced H3K4 methylation. (A) CUT & RUN assays in paired MEFs with or without Fbxw7 deletion. The heatmaps show H3K4me1 (Left) and H3K4me3 (Right) peaks in the whole genome of paired MEFs. (B and C) RNAseq profiling in paired MEFs with or without Fbxw7 deletion. Shown are volcano plot (B) and fold-change plot (C) for DEGs with red dots representing the up-regulated genes with at least twofold increase and the blue dots representing the down-regulated genes with a reduction of at least 50% with a q value < 0.01. FC: Fold change. (D) Quadrant diagrams of the overlap between DEGs from RNAseq analysis and the target genes that showed differential peaks in the promoter or enhancer regions from the CUT & RUN assay. (E) KEGG enrichment pathway analyses on the genes that are enriched in CUT & RUN analyses for H3K4me1 or H3K4me3 pull-down, and at least twofold increase in Fbxw7-null MEFs from RNAseq analysis, respectively. FDR: False discovery rate. (F) Relative expression levels of the indicated up-regulated genes from IL-17 pathway upon Fbxw7 depletion. Paired MEFs were harvested for qRT-PCR analysis. n = 3; mean ± SEM, **P < 0.01, ***P < 0.001. (G) Paired MEFs were serum starved, and the supernatants were then collected as conditional media for ELISA. n = 3; mean ± SEM, *P < 0.05, **P < 0.01, ***P < 0.001.
Fig. 6.
Fig. 6.
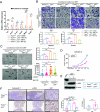
Fbxw7 depletion activates IL-17 signaling pathway to promote in vitro migration/invasion and sphere formation and in vivo tumor growth upon co-implantation of MEFs and lung cancer cells. (A) MEFs with indicated genotypes were serum starved, along with MM-102 (40 μM) or DMSO treatment for 72 h, followed by qRT-PCR analysis. n = 3; mean ± SEM, ns: no significance, *P < 0.05, **P < 0.01, ***P < 0.001. (B) MEFs with indicated genotypes were serum starved, along with MM-102 (40 μM) or DMSO treatment for 72 h, and then the supernatants were collected as conditioned media. 0.8 ~ 1 × 10⁵ A549 cells were seeded into the 8.0-µm, 24-well plate chamber inserts in serum-free medium, and the conditioned media were added to the wells of the plate for transwell migration and invasion assays. Shown are the representative images (Top) and fold changes (Bottom) of migrated/invaded cells. (Scale bar: 50 μm.) n = 3; mean ± SEM, ns: no significance, *P < 0.05, ***P < 0.001. (C) Conditioned media were collected from MEFs and then mixed with DMEM containing 5% serum at a ratio of 3:1 to prepare the conditioned media dilution. A549 cells were cultured in the conditioned media dilution for 13 d under 3D culture conditions. Photographs were taken under a microscope (Left), and the number (expressed as fold change) and size of spheres were counted with ImageJ (Right). (Scale bar: 100 μm.) The difference in the spheroid numbers was expressed as fold change by setting the control group (Fbxw7+/+p53−/−/DMSO) as 1 (Top Right). For quantification of spheroid size, 58 to 145 colonies were counted (Bottom Right). The results were expressed as mean ± SEM from three independent experiments, ns: no significance, *P < 0.05, ***P < 0.001. (DF) 3 × 10⁶ A549 cells were mixed with Fbxw7+/+; p53−/− or Fbxw7−/−; p53−/− MEFs at a ratio of 1:3, and then s.c. injected into the left (L) or right (R) flank of SCID mice, respectively. After 15 d, the tumor volumes were measured every 2 to 3 d and the tumor growth curves were plotted (D). Mean ± SEM, n = 6, **P < 0.01. Cells were harvested for IB analysis (E). The subcutaneous tumors were isolated for IHC staining (F, Left). The ratios of positive staining from three random areas of each tumor (n = 6) were calculated (F, Right). Mean ± SD, n = 6, ***P < 0.001.
Fig. 7.
Fig. 7.
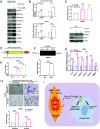
Hypoxia downregulates FBXW7 via ETS1 in CAFs, which promotes migration and invasion of cancer cells in a paracrine fashion. (A) The immortalized CAFs from pancreatic cancer tissues (PDAC-CAFs) were grown under normoxia or hypoxia (1% O2) for 48 h, followed by IB analysis. (B) PDAC-CAFs were cultured in complete (Top) or serum-free (Bottom) medium under normoxia or hypoxia for 48 h before being harvested for qPCR analysis. n = 3; mean ± SEM, **P < 0.01, ***P < 0.001. (C) PDAC-CAFs were transfected with indicated siRNA for 48 h, and then cells were harvested for qRT-PCR (Top) or IB (Bottom) analysis. n = 3; mean ± SEM, **P < 0.01. (D) Schematic of luciferase reporter driven by FBXW7 promoter with ETS1 binding site indicated. E refers to ETS1 binding site. (E) Cells were co-transfected with luciferase reports driven by FBXW7 promoter with (FL) or without ETS1 binding site (del-E) along with Renilla, followed by luciferase reporter assay. n = 3; mean ± SEM, ***P < 0.001. (F) HEK293 cells were harvested for ChIP assay with ETS1 antibody, followed by PCR (Top) or qPCR analysis (Bottom). n = 3; mean ± SEM, ***P < 0.001. (G) PDAC-CAFs were transfected as indicated and harvested for qRT-PCR analysis. n = 3; mean ± SEM, **P < 0.01, ***P < 0.001, ns: no significance. (H) PDAC-CAFs were serum starved under normoxia or hypoxia for 48 h, and then the conditioned media were collected. PANC-1 cells were seeded into the 8.0-µm, 24-well plate chamber inserts in serum-free medium, and the conditioned media were added to the wells of the plate for transwell migration and invasion assays. Shown are the representative images (Top), and fold changes (Bottom) of migrated/invaded cells. (Scale bar: 50 μm.) n = 3; mean ± SEM, **P < 0.01, ***P < 0.001. (I) A working model. See text for details.

References

    1. de Visser K. E., Joyce J. A., The evolving tumor microenvironment: From cancer initiation to metastatic outgrowth. Cancer Cell 41, 374–403 (2023). - PubMed
    1. Dominiak A., Chełstowska B., Olejarz W., Nowicka G., Communication in the cancer microenvironment as a target for therapeutic interventions. Cancers (Basel) 12 (2020). - PMC - PubMed
    1. Biffi G., Tuveson D. A., Diversity and biology of cancer-associated fibroblasts. Physiol. Rev. 101, 147–176 (2021). - PMC - PubMed
    1. Caligiuri G., Tuveson D. A., Activated fibroblasts in cancer: Perspectives and challenges. Cancer Cell 41, 434–449 (2023). - PMC - PubMed
    1. Erez N., Truitt M., Olson P., Arron S. T., Hanahan D., Cancer-associated fibroblasts are activated in incipient neoplasia to orchestrate tumor-promoting inflammation in an NF-kappaB-dependent manner. Cancer Cell 17, 135–147 (2010). - PubMed

MeSH terms

Substances

LinkOut - more resources