. 2025 May:95:102130.
doi: 10.1016/j.molmet.2025.102130. Epub 2025 Mar 22.

Physical training reduces cell senescence and associated insulin resistance in skeletal muscle

Affiliations

Physical training reduces cell senescence and associated insulin resistance in skeletal muscle

Agnieszka Podraza-Farhanieh et al. Mol Metab. 2025 May.

Abstract

Background: Cell senescence (CS) is a key aging process that leads to irreversible cell cycle arrest and an altered secretory phenotype. In skeletal muscle (SkM), the accumulation of senescent cells contributes to sarcopenia. Despite exercise being a known intervention for maintaining SkM function and metabolic health, its effects on CS remain poorly understood.

Objectives: This study aimed to investigate the impact of exercise on CS in human SkM by analyzing muscle biopsies from young, normal-weight individuals and middle-aged individuals with obesity, both before and after exercise intervention.

Methods: Muscle biopsies were collected from both groups before and after an exercise intervention. CS markers, insulin sensitivity (measured with euglycemic clamp), and satellite cell markers were analyzed. Additionally, in vitro experiments were conducted to evaluate the effects of cellular senescence on human satellite cells, focusing on key regulatory genes and insulin signaling.

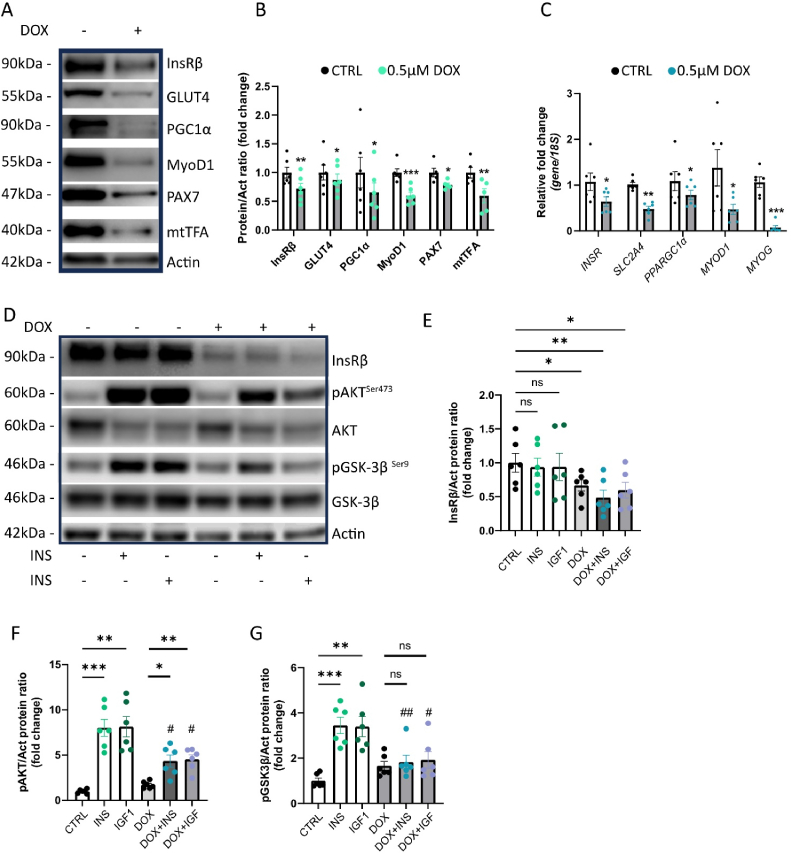
Results: Individuals with obesity showed significantly elevated CS markers, along with reduced expression of GLUT4 and PAX7, indicating impaired insulin action and regenerative potential. Exercise improved insulin sensitivity, reduced CS markers, and activated satellite cell response in both groups. In vitro experiments revealed that senescence downregulated key regulatory genes in satellite cells and impaired insulin signaling by reducing the Insulin Receptor β-subunit.

Conclusions: These findings highlight the role of CS in regulating insulin sensitivity in SkM and underscore the therapeutic potential of exercise in mitigating age- and obesity-related muscle dysfunction. Targeting CS through exercise or senolytic agents could offer a promising strategy for improving metabolic health and combating sarcopenia, particularly in at-risk populations.

Keywords: Aging; Cellular senescence; Exercise intervention; Obesity; Satellite cells; Skeletal muscles.


Conflict of interest statement

Declaration of competing interest The authors declare no competing interests.

Figures

Figure 1
Figure 1
Subjects with obesity exhibited higher expression of senescence markers in SkM. (A–F) Bar graphs showing qRT-PCR analysis of the indicated genes, expressed as fold change and normalized to 18S. Data are presented as boxplots (min–max) with individual values shown. Normality of the data distribution was assessed using the Shapiro–Wilk test. Statistical comparisons were performed using an unpaired Student's t-test or Mann–Whitney test, with significance indicated on the graphs. Sample size varies between genes in the presented groups due to undetected values in qRT-PCR analysis. Undetected values were excluded to ensure reliable statistical evaluation.
Figure 2
Figure 2
Impact of exercise intervention on gene expression in SkM. (A–F) qRT-PCR analysis of the indicated genes in 23 young, lean individuals before and one month after an exercise intervention. (G–L) qRT-PCR analysis of the indicated genes in 32 middle-aged individuals with obesity before and after a six-month exercise intervention. Data are presented as boxplots (min–max) with individual values displayed. Normality of the data distribution was assessed using the Shapiro–Wilk test. Statistical comparisons were performed using paired Student's t-test or Wilcoxon signed-rank test, with significance indicated on the graphs. Sample size varies between genes in the presented groups due to undetected values in qRT-PCR analysis. Undetected values were excluded to ensure reliable statistical evaluation.
Figure 3
Figure 3
Doxorubicin exposure induces senescence in HSkMSC. (A) Representative immunoblots of the indicated proteins in control and DOX-treated cells after 48 h (n = 5). (B) Representative bright-field images of HSkMSC treated with varying concentrations of DOX for 48 h (n = 3). Scale bars = 60 μm. (C) Bar graphs showing relative protein levels in control and DOX-treated cells after 48 h, normalized to actin (n = 5). Data are presented as mean ± SEM, with individual data points shown as dots. (D) Bar graphs displaying qRT-PCR analysis of the indicated genes as fold change, normalized to 18S (n = 6). Data are presented as mean ± SEM, with dots representing individual data points. (E) Representative immunofluorescence images of control and DOX-treated cells stained for p21 (red) and nuclei (DAPI, blue), and γH2AX (red) (n = 3). Scale bars = 10 μm. (F) Bar graphs showing corrected total cell fluorescence of p21/DAPI and γH2AX/DAPI in control and DOX-treated cells (n = 3, with 4–6 randomly chosen fields per experiment). Dots represent individual data points. (G) Representative immunofluorescence images of control and DOX-treated cells stained for Ki67 (red) and nuclei (DAPI, blue) (n = 3). Scale bars = 25 μm. (H) Bar graphs showing the percentage of Ki67-positive cells relative to total nuclei in control and DOX-treated cells (n = 3, with 4–6 randomly chosen fields per experiment). Dots represent individual data points. (I) Representative immunoblots of the indicated proteins in control and SASP-positive media-treated cells (n = 6). (J) Bar graphs showing relative protein levels normalized to actin (n = 5). Normality of data distribution was assessed using the Shapiro–Wilk test. Depending on normality, either a paired Student's t-test (for normally distributed data) or a Wilcoxon matched-pairs test (for non-normally distributed data) was used. Data are presented as mean ± SEM. ∗p < 0.05, ∗∗p < 0.01, ∗∗∗p < 0.001, ∗∗∗∗p < 0.0001.
Figure 4
Figure 4
CS impairs insulin signaling and reduces the expression of key muscle-regulatory genes. (A) Representative immunoblots of the indicated proteins in control and DOX-treated cells after 48 h (n = 6). (B) Bar graphs showing relative protein levels in control and DOX-treated cells after 48 h, normalized to actin (n = 6). Data are presented as mean ± SEM, with individual data points shown as dots. (C) Bar graphs displaying qRT-PCR analysis of the indicated genes as fold change, normalized to 18S (n = 6). Data are presented as mean ± SEM, with dots representing individual data points. (D) Representative immunoblots of the indicated proteins in control and DOX-treated cells after 48 h, followed by exposure to insulin (INS) or IGF-1 for 20 min (n = 6). (E–G) Bar graphs showing relative protein levels in control and DOX-treated cells after 48 h, followed by exposure to INS or IGF-1 for 20 min, normalized to actin (n = 6). Data are presented as mean ± SEM, with dots representing individual data points. Normality of data distribution was assessed using the Shapiro–Wilk test. Depending on normality, either a paired Student's t-test (for normally distributed data) or a Wilcoxon matched-pairs test (for non-normally distributed data) was used. For comparisons involving multiple conditions, Repeated Measures One-Way ANOVA with Dunnett's multiple comparisons test (for normally distributed data) or the Friedman test (for non-normally distributed data) was applied. ∗p < 0.05, ∗∗p < 0.01, ∗∗∗p < 0.001 (control vs. treatment conditions); #p < 0.05, ##p < 0.01 (control + INS/IGF-1 vs. DOX + INS/IGF-1).
Figure 5
Figure 5
Senolytic agents Dasatinib and Quercetin target CS in satellite cells. (A) Representative immunoblots of the indicated proteins in control, DOX-, D + Q-, and DOX + D + Q-treated cells. (B–G) Bar graphs showing relative protein levels in the indicated groups, normalized to actin (n = 6). Data are presented as mean ± SEM, with dots representing individual data points. (H) Bar graphs displaying qRT-PCR analysis of the indicated genes as fold change, normalized to 18S (n = 6). Data are presented as mean ± SEM, with dots representing individual data points. (I) Representative immunofluorescence images of control, DOX-, D + Q-, and DOX + D + Q-treated cells stained for p21 (red) and nuclei (DAPI, blue) (n = 3). Scale bars represent 25 μm. (J) Bar graphs showing corrected total cell fluorescence of p21/DAPI in the indicated groups (n = 3, with 4–6 randomly chosen fields per experiment). (K) Representative immunofluorescence images of control, DOX-, D + Q-, and DOX + D + Q-treated cells stained with MitoTracker (red) and nuclei (DAPI, blue) (n = 3). Scale bars represent 25 μm. (L) Bar graph showing fluorescence intensities of MitoTracker Red, normalized to the number of nuclei (n = 3, with 4–6 randomly chosen fields per experiment). Dots represent individual data points. Normality of data distribution was assessed using the Shapiro–Wilk test. Depending on normality, either Repeated Measures One-Way ANOVA with Dunnett's multiple comparisons test (for normally distributed data) or the Friedman test (for non-normally distributed data) was applied to (B–H). For (J) and (L), One-Way ANOVA with a Kruskal–Wallis test and Dunn's multiple comparisons test was used. ∗p < 0.05, ∗∗p < 0.01, ∗∗∗p < 0.001, ##p < 0.01 (Repeated Measures One-Way ANOVA with Dunnett's multiple comparisons test or the Friedman test, as appropriate); ∗∗∗∗p < 0.001 (One-Way ANOVA with a Kruskal–Wallis test and Dunn's multiple comparisons test).
Figure 6
Figure 6
Salbutamol mitigates the pro-senescence effects of doxorubicin while preserving its proinflammatory role, which may support skeletal muscle regeneration. (A) Representative immunoblots of the indicated proteins in control, salbutamol-, DOX-, and salbutamol + DOX-treated cells after 24 h (n = 5). (B) Bar graphs showing relative protein levels in the indicated conditions after 24 h, normalized to actin (n = 5). Data are presented as mean ± SEM, with dots representing individual data points. (C) Representative immunoblots of the indicated proteins in control, salbutamol-, DOX-, and salbutamol pretreatment + DOX-treated cells after 24 h (n = 5). (D) Bar graphs showing relative protein levels in the indicated conditions after 24 h, normalized to actin (n = 5). (E–H) Bar graphs showing qRT-PCR analysis of the indicated genes, presented as fold change, normalized to 18S (n = 6). Data are presented as mean ± SEM, with dots representing individual data points. Normality of data distribution was assessed using the Shapiro–Wilk test. Depending on normality, either Repeated Measures One-Way ANOVA with Dunnett's multiple comparisons test (for normally distributed data) or the Friedman test (for non-normally distributed data) was applied. ∗p < 0.05, ∗∗p < 0.01, ∗∗∗p < 0.001 for control vs. treatments; #p < 0.05, ##p < 0.01 for DOX vs. SAL + DOX or DOX vs. SAL→DOX (Repeated Measures One-Way ANOVA with Dunnett's multiple comparisons test or the Friedman test, as appropriate).

References

    1. Di Micco R., Krizhanovsky V., Baker D., d'Adda di Fagagna F. Cellular senescence in ageing: from mechanisms to therapeutic opportunities. Nat Rev Mol Cell Biol. 2021;22(2):75–95. doi: 10.1038/s41580-020-00314-w. - DOI - PMC - PubMed
    1. Huang W., Hickson L.J., Eirin A., Kirkland J.L., Lerman L.O. Cellular senescence: the good, the bad and the unknown. Nat Rev Nephrol. 2022;18(10):611–627. doi: 10.1038/s41581-022-00601-z. - DOI - PMC - PubMed
    1. Zhang L., Pitcher L.E., Yousefzadeh M.J., Niedernhofer L.J., Robbins P.D., Zhu Y. Cellular senescence: a key therapeutic target in aging and diseases. J Clin Investig. 2022;132(15) doi: 10.1172/JCI158450. - DOI - PMC - PubMed
    1. Spinelli R., Parrillo L., Longo M., Florese P., Desiderio A., Zatterale F., et al. Molecular basis of ageing in chronic metabolic diseases. J Endocrinol Investig. 2020;43(10):1373–1389. doi: 10.1007/s40618-020-01255-z. - DOI - PMC - PubMed
    1. Palmer A.K., Tchkonia T., Kirkland J.L. Targeting cellular senescence in metabolic disease. Mol Metabol. 2022;66 doi: 10.1016/j.molmet.2022.101601. - DOI - PMC - PubMed

LinkOut - more resources