. 2025 Mar 24;16(1):2858.
doi: 10.1038/s41467-025-57697-7.

Targeting the disrupted Hippo signaling to prevent neoplastic renal epithelial cell immune evasion

Affiliations

Targeting the disrupted Hippo signaling to prevent neoplastic renal epithelial cell immune evasion

Xiangmin Lv et al. Nat Commun. .

Erratum in

Abstract

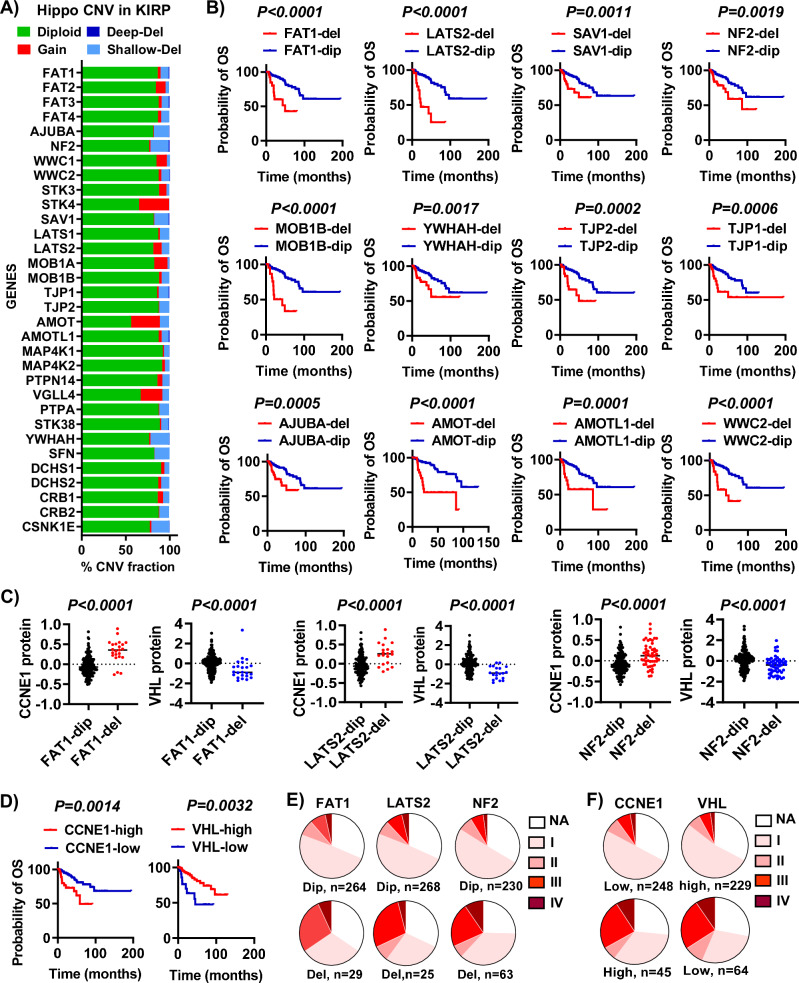
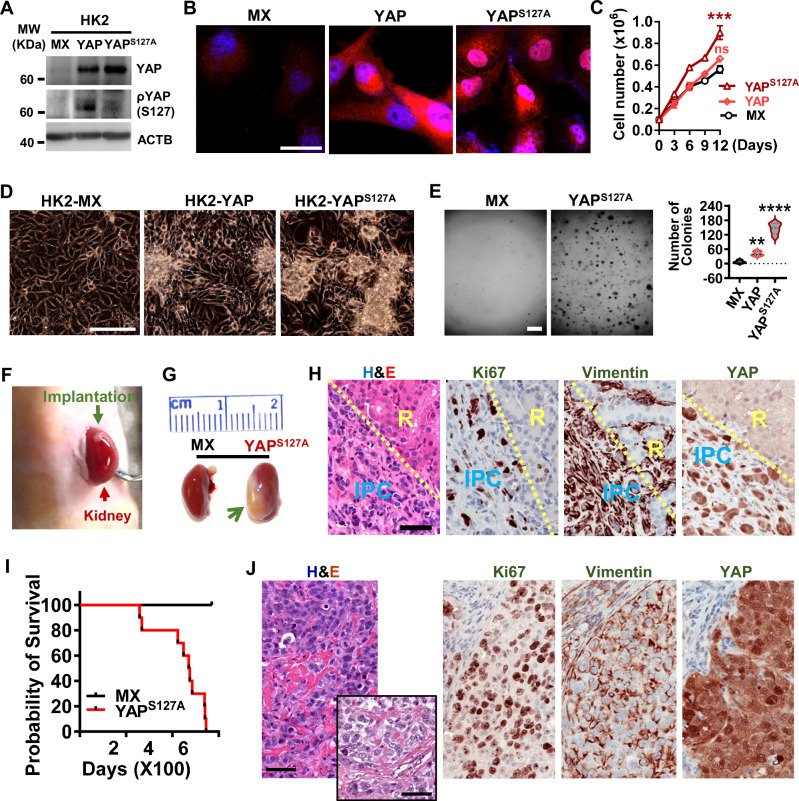
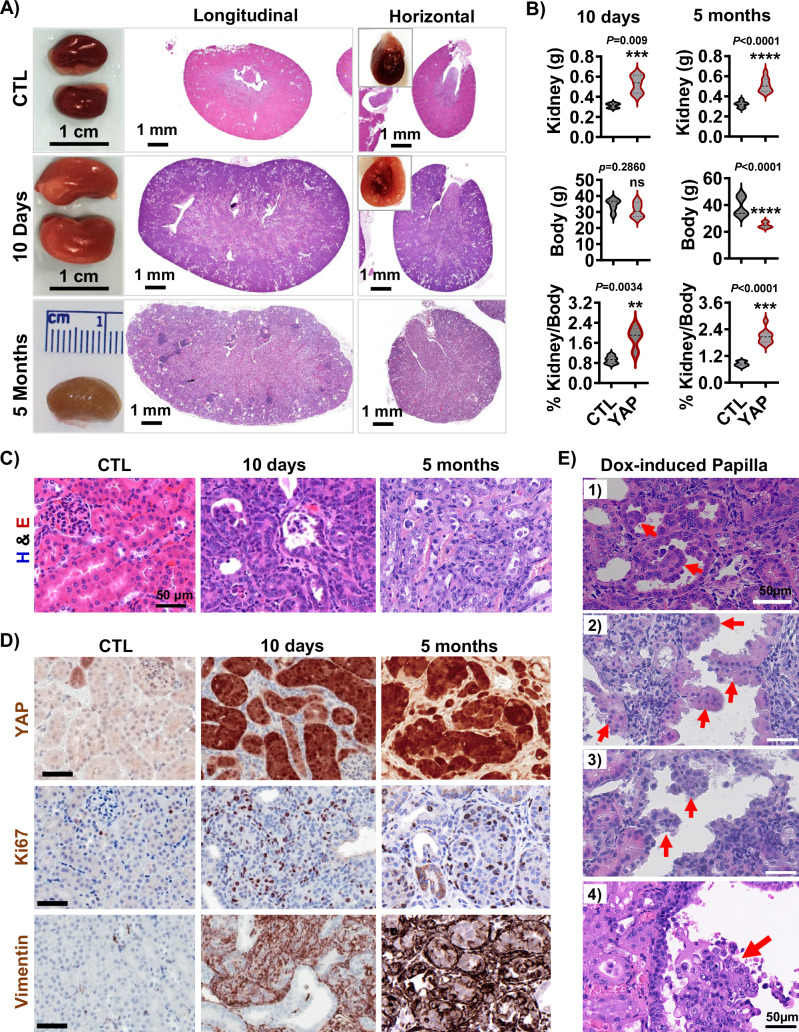
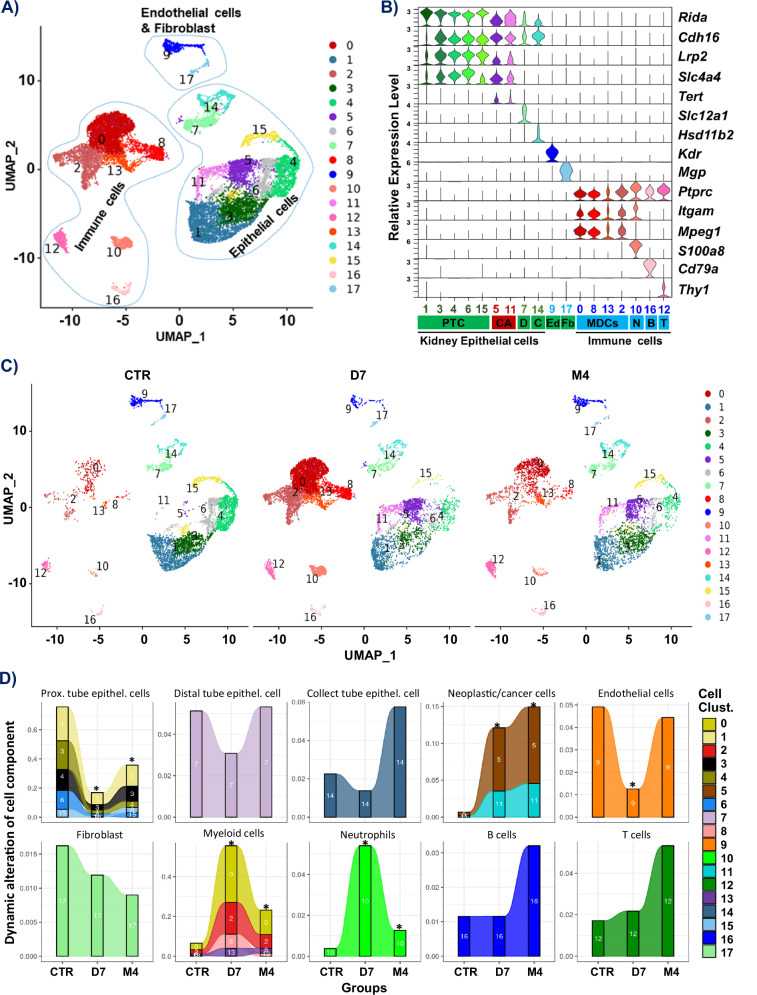
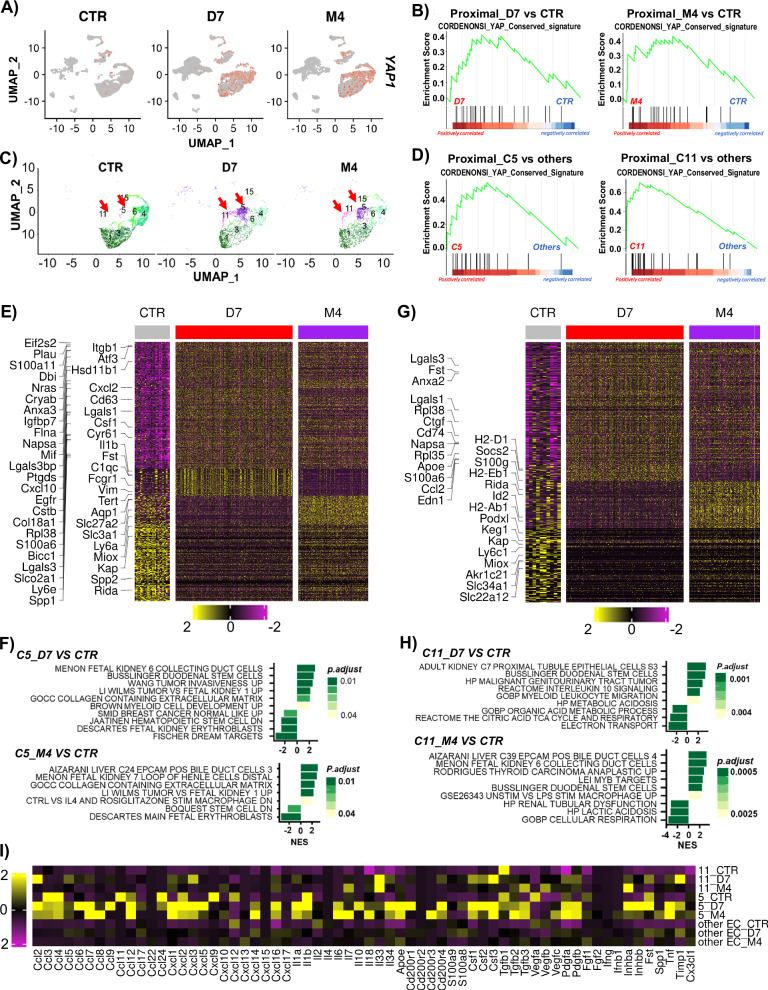
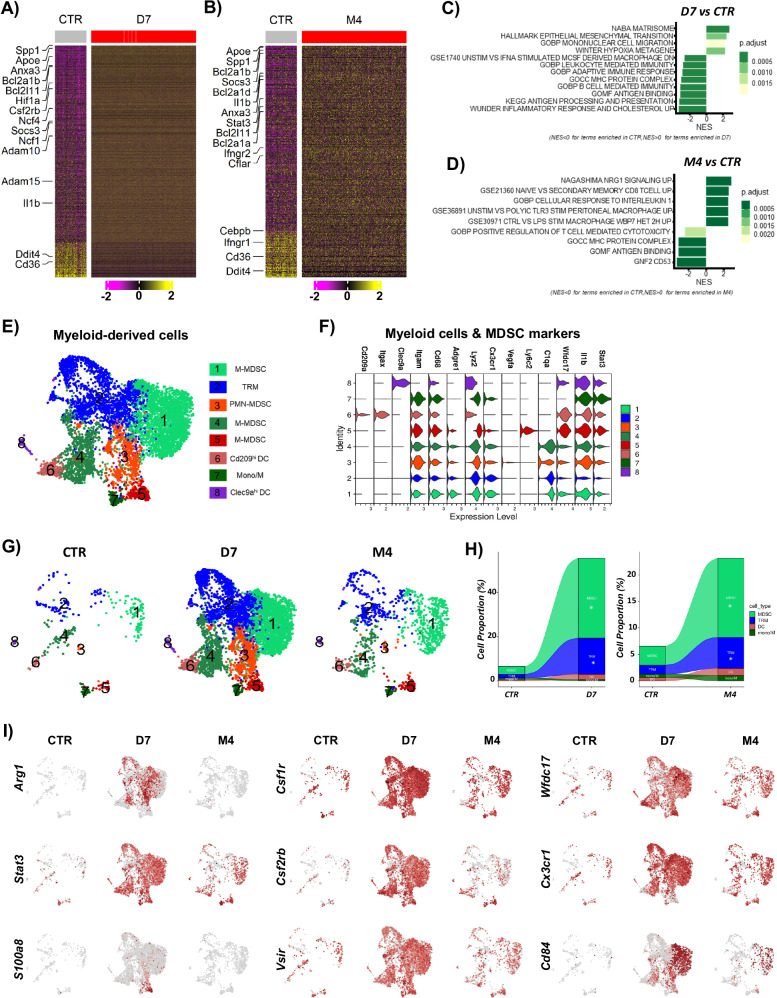
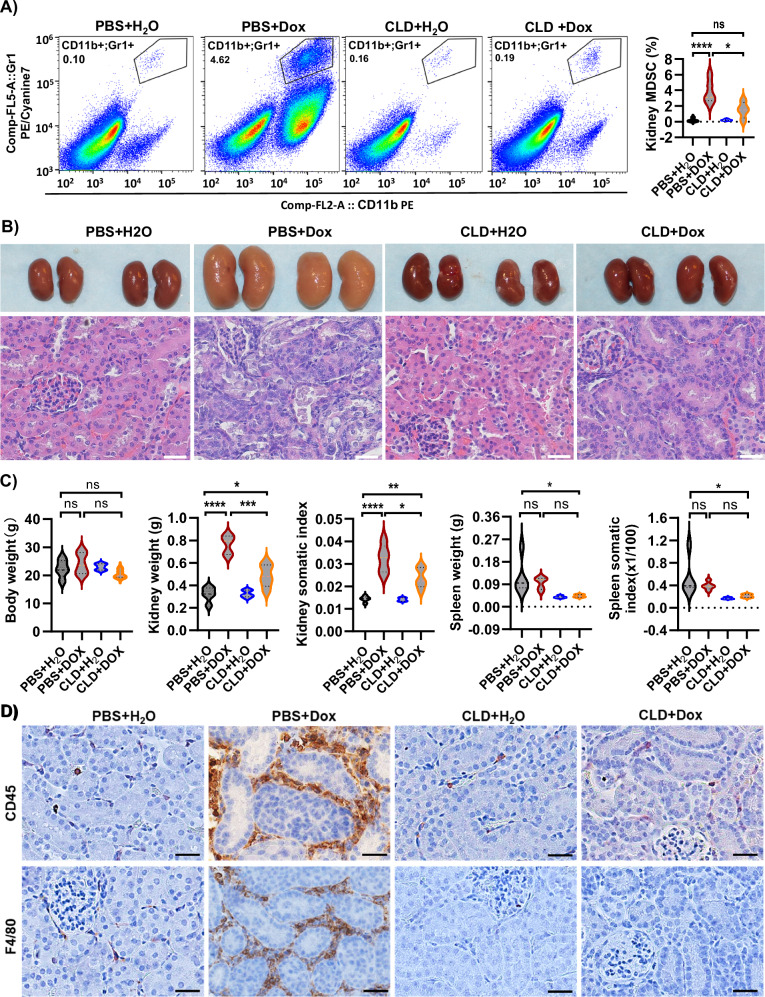
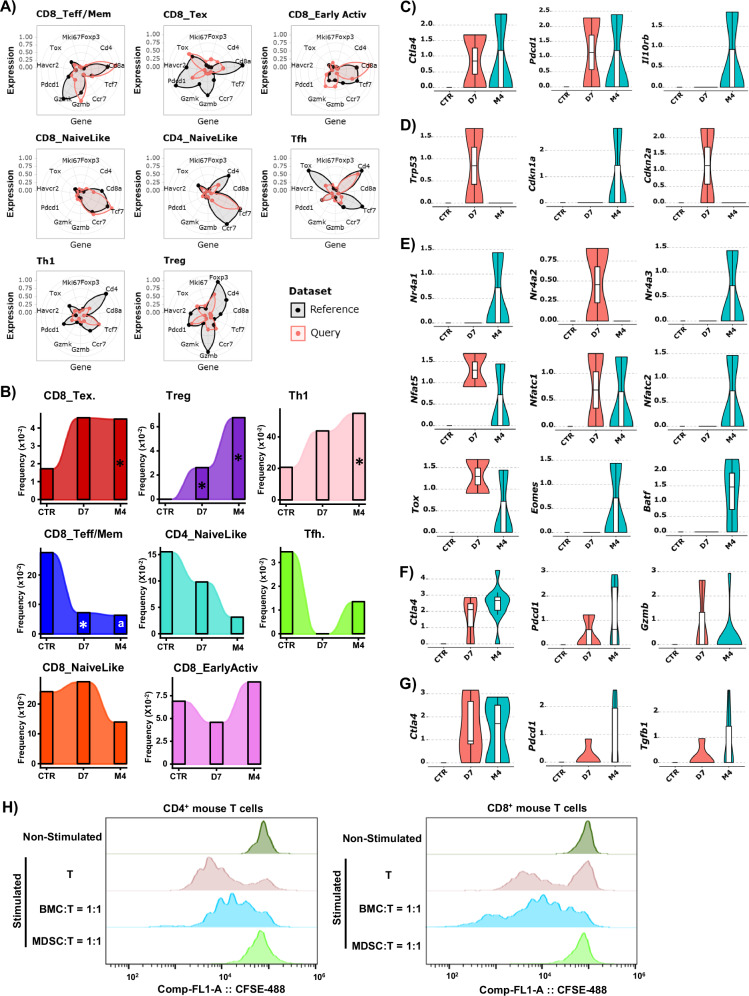
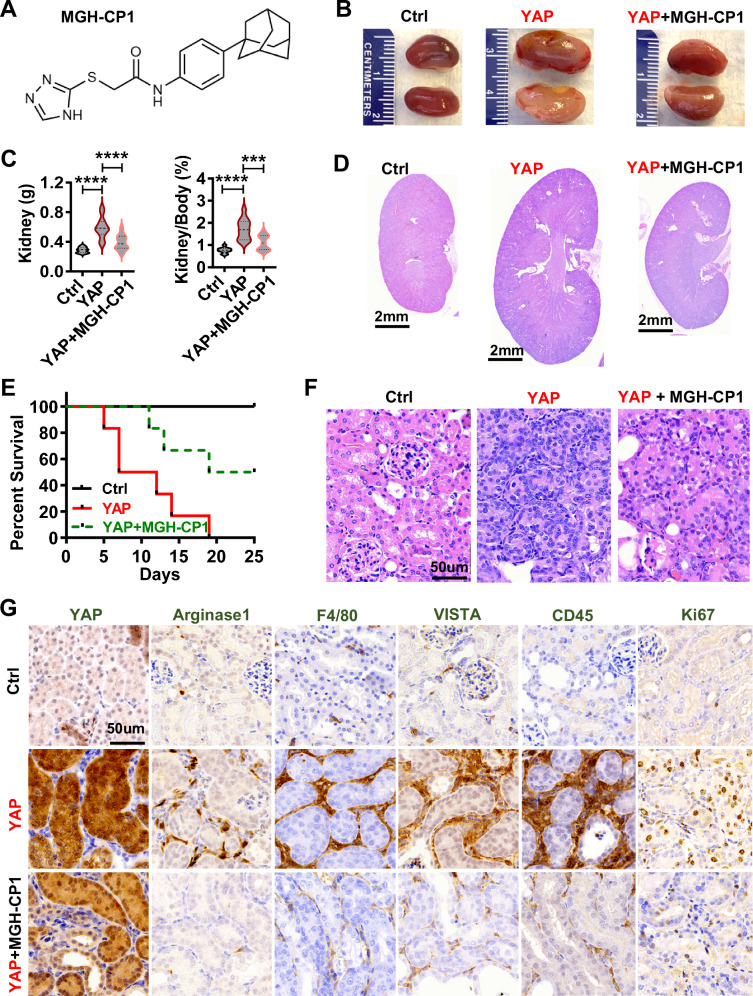
Large-scale cancer genetic/genomic studies demonstrated that papillary renal cell carcinoma (pRCC) is featured with a frequent shallow deletion of the upstream tumor suppressors of the Hippo/YAP signaling pathway, suggesting that this signaling pathway may play a role in pRCC development. Here we develop a transgenic mouse model with a renal epithelial cell-specific hyperactivation of YAP1 and find that hyperactivation of YAP1 can induce dedifferentiation and transformation of renal tubular epithelial cells leading to the development of pRCC. We analyze at the single-cell resolution the cellular landscape alterations during cancer initiation and progression. Our data indicate that the hyperactivated YAP1, via manipulating multiple signaling pathways, induces epithelial cell transformation, MDSC (Myeloid-derived suppressor cells) accumulation, and pRCC development. Interestingly, we find that depletion of MDSC blocks YAP1-induced kidney overgrowth and tumorigenesis. Inhibiting YAP1 activity with MGH-CP1, a recently developed TEAD inhibitor, impedes MDSC accumulation and suppresses tumor development. Our results identify the disrupted Hippo/YAP signaling as a major contributor to pRCC and suggest that targeting the disrupted Hippo pathway represents a plausible strategy to prevent and treat pRCC.


Conflict of interest statement

Competing interests: Dr. Xu Wu has a financial interest in Tasca Therapeutics, which is developing small molecule modulators of TEAD palmitoylation and transcription factors. Dr. Wu’s interests were reviewed and are managed by Mass General Hospital, and Mass General Brigham in accordance with their conflict-of-interest policies. The rest authors have no competing interests to declare.

Figures

Fig. 1
Fig. 1. Shallow deletion of the major components of the Hippo signaling cascade is associated with a poor prognosis in pRCC patients.
pRCC patient clinical data and gene expression profiling data were extracted from the TCGA datasets (TCGA firehose study) and analyzed using the GraphPad Prism 9 software. A Copy number variation (CNV) of genes encoding the key components of the Hippo signaling pathway (n = 293). B Deletion (both deep & shallow deletions) of genes encoding the major components of the Hippo signaling cascade predicts poor overall survival in pRCC patients. del: deletion; dip: diploid. Data were analyzed using the Kaplan-Meier simple survival analysis with the Mantel-Cox test and Gehan-Breslow-Wilcoxon test. The P value of each comparison is presented on the top of the corresponding graph. C Deletion of genes encoding the key components of the Hippo signaling pathway is associated with dysregulation of known regulators of the pRCC development (e.g., CCNE1 and VHL, etc.). Data were analyzed with unpaired t-tests (two-tailed). The P value of each comparison is presented on the top of the corresponding graph (FAT1-dip: n = 174; FAT1-Del: n = 23; LATS2-Dip: n = 170; LATS2-Del: n = 20; NF2-Dip: n = 159; NF2-Del: n = 51). D Dysregulated CCNE1 and VHL is associated with poor patient survival rate. Data were analyzed using the Kaplan-Meier simple survival analysis with the Mantel-Cox test and Gehan-Breslow-Wilcoxon test. The P value of each comparison is presented on the top of the corresponding graph (CCNE1-high: n = 42, CCNE1-low: n = 153; VHL-high: n = 132, VHL-low: n = 28). E, F Deletion of the upstream suppressor of the Hippo signaling pathway and dysregulation of their downstream genes (e.g., CCNE1, VHL, etc.) are associated with pRCC progression. Source data are provided as a Source Data file.
Fig. 2
Fig. 2. YAP1 stimulates the proliferation and transformation of renal epithelial cells.
A Western blots showing successful overexpression of the wild-type YAP1 (YAP) and constitutively active YAP1 (YAPS127A) in HK2 cells. Each experiment was repeated at least three time and a representative image was presented to show the relative level of YAP1 protein. B Fluorescent immunocytochemistry showing the expression and subcellular location of YAP (red) in HK2-MX, HK2-YAP, and HK2-YAPS127A cells; Each experiment was repeated independently at least three time and a representative image was presented to show the location and relative level of YAP1 protein. Nuclei were stained with DAPI (blue); scale bar: 10 μm. C Cell growth curves showing that YAP activity promotes the proliferation of HK2 cells. Each time point represents the mean ± SEM (n = 4~6 biological replicates). The cell numbers on day 12 were analyzed with One-Way ANOVA followed by the Tukey multiple comparisons test. MX v.s YAP: p = 0.2869 (ns); MX vs. YAPS127A: P = 0.0002 (***); YAP vs. YAPS127A: P = 0.0039. D Overexpression of YAP & YAPS127A stimulates multilayer growth of HK2 cells. Scale Bar: 100 μm. E The anchorage-free growth ability of modified HK2 cells. Left panel: Representative images showing colony formation in HK2 control cells (MX) and HK2 cells expressing YAPS127A, scale bar: 500 μm. Right panel: A violin plot (with minima, maxima, median, and percentile etc.) showing colony numbers formed by HK2-MX, HK2-YAP, and HK2-YAPS127A cells (n = 5 biological replicates). Data were analyzed with One-Way ANOVA followed by the Tukey multiple comparisons test. MX vs YAP: P = 0.0085 (**); MX vs. YAPS127A: P < 0.0001 (****); YAP vs. YAPS127A: P < 0.0001. F A representative image showing the orthotopic inoculation of modified HK2 cells under mouse kidney capsules. G A representative image showing the orthotopic tumor formed by HK2-YAPS127A cells implanted under mouse kidney capsules. H Representative images of H-E staining and immunohistochemistry (IHC) from six biological repeats showing the histological morphology of orthotopic tumors and expression of Ki67, Vimentin, and YAP proteins in orthotopic tumors. IPC: implanted cells, R: renal tissue, scale bar: 50 μm. I Survival rate of mice injected with HK2-MX cells (n = 5, no tumor) and HK2-YAPS127A cells (n = 10, all with metastatic tumor). J Representative H-E and IHC images showing the diverse histology of tumor (two HE staining images) and expression of Ki67, Vimentin, and YAP1 proteins in tumors (three IHC staining images) derived from mice injected with HK2-YAPS127A cells. Scale bar: 50 μm. Source data for panels (A, C, E, and I) are provided as a Source Data file.
Fig. 3
Fig. 3. Renal epithelial cell-specific expression of YAPS127A induces pRCC in vivo.
A Development of neoplasia and cancer in Pax8-YAPS127A transgenic mice. Left panel: Kidney size and morphology of mice with a Pax8 promoter-driven expression of YAPS127A (Pax8-YAPS127A) after inducing with doxycycline for ten days and five months. Age-matched wild-type mice and non-induced transgenic mice, which have similar phenotypes, were used as controls (CTL). Middle and right panels: Longitudinal (middle) and horizontal (right) section images (H-E stained) showing the size of kidneys from CTL and Pax8-YAPS127A mice after inducing gene expression with doxycycline for ten days and five months. Scale bar =1 mm. B Violin plots (with minima, maxima, median, and percentile information) showing changes in kidney weight, body weight, and kidney/body ratio in control (CTL) and Dox-induced (for 10 days or 5 months) Pax8-YAPS127A mice (n = 5 biological replicates for the groups of 10-days study; n = 7~9 biological replicates for the groups of 5-months study). Data were analyzed with unpaired t-tests (two-tailed). The P value of each comparison is presented on the top of the corresponding plot. C Representative H-E staining images from showing the histological morphology of kidneys from control (CTL) and Pax8-YAPS127A mice induced with doxycycline for 10 days and 5 months. The experiments with the similar observations have been independently repeated for more than ten times. Scale bar: 50 μm. D Immunohistochemical images showing expression of YAP1, Ki67, and vimentin in kidney tissues from control (CTL) and Pax8-YAPS127A mice induced with doxycycline for 10 days and 5 months. E H–E staining showing papillary structures derived from the acute Dox-induced neoplastic tissue (E1) and chronic intermittent Dox-induced cancerous tissues (E2–E4). Pax8-rtTA;Tet-on-YAPS127A mice were induced with doxycycline for two weeks (acute) or five months (chronic) before histological analyzes. Red arrows point to papillae observed in several Dox-induced transgenic mice. The experiments with the similar results have been independently repeated for more than ten times. Scale bar: 50 μm. Scale bar: 50 µm. Source data for (B) are provided in the Source Data file.
Fig. 4
Fig. 4. Single-cell RNAseq analyzes showing dynamic alteration of cellular landscape in renal tissue before and after pRCC development.
A UMAP plot showing the overview of 18 major cell types identified in renal tissues in control (CTL, non-induced mice) and Pax8-rtTA;Tet-on-YAPS127A mice induced with doxycycline for seven days (D7) and four months (M4). B Violin plots of representative marker genes across the identified cell clusters. C UMAP plots showing the cellular components of renal tissues in Pax8-rtTA;Tet-on-YAPS127A mice induced with doxycycline for seven days (D7) and four months (M4). D Dynamic alteration of major cell components in renal tissues in control and doxycycline-induced Pax8-rtTA;tet-on-YAPS127A mice during hyperactivated YAP1-induced tumorigenesis. *: significantly different when compared to CTR. Statistical difference were performed with scCODA with FDR = 0.05. Please note that mice in the M4 group were generated using a low dose/chronic induction protocol in order to avoid acute neoplasia-associated kidney failure.
Fig. 5
Fig. 5. Molecular features of transformed renal epithelial cells.
A UMAP plots showing the expression of YAP1 in different types of cells in the renal tissues. Please note that YAP1 is primarily expressed in epithelial cells. B GSEA analyzes showing the enrichment of genes associated with YAP1 conserved signature in renal epithelial cells induced with Dox for seven days (D7) or four months (M4). C UMAP plots showing the changes of epithelial cell subpopulations in control (CTR) and YAPS127A-induced (for 7 days and 4 months) renal tissues. Please note that the numbers of cells in cluster 5 (C5) and cluster 11 (C11) are significantly increased after doxycycline induction of transgene expression. D GSEA analyzes showing the enrichment of genes associated with YAP1 conserved signature in C5 and C11 subpopulations after inducing transgene expression with doxycycline for 7 days (D7) or 4 months (M4). E Heatmap demonstrates significantly altered genes in the C5 cluster of proximal tubal epithelial cells after inducing transgene with doxycycline for 7 days (D7) or 4 months (M4). Renal epithelial cells from the non-induced mice were used as control (CTR). The significantly altered genes involved in extracellular matrix reprogramming are listed on the left side of the heatmap. F Gene ontology enrichment analysis showing alteration of signaling pathways involved in the transformation of cluster 5 (C5) cells in D7 early lesions and M4 pRCC tumor tissues. P.adjust is Benjamini-Hochberg adjusted p values. And P values were derived from GSEA permutation based on an adaptive multi-level split Monte-Carlo scheme implemented in fgsea R package. G Heatmap demonstrates significantly altered genes in the C11 cluster of proximal tubal epithelial cells after inducing transgene with doxycycline for 7 days (D7) or 4 months (M4). Renal epithelial cells from the non-induced mice were used as control (CTR). The significantly altered genes involved in extracellular matrix reprogramming are listed on the left side of the heatmap. H Gene ontology enrichment analysis showing alteration of signaling pathways involved in the transformation of cluster 11 (C11) cells in D7 early lesions and M4 pRCC tumor tissues. P.adjust is Benjamini-Hochberg adjusted p values. And P values were derived from GSEA permutation based on an adaptive multi-level split Monte-Carlo scheme implemented in fgsea R package. I Heatmap showing expression of genes encoding for chemokines, cytokines, and growth factors that are associated with MDSC accumulation and immune suppression in C5 and C11 epithelial cells. Please note that mice in the M4 group were generated using a low dose/chronic induction protocol in order to avoid acute neoplasia-associated kidney failure.
Fig. 6
Fig. 6. Molecular features of myeloid-derived cells in hyperactivated YAP1-induced renal carcinogenesis.
A, B Heatmap demonstrates significantly altered genes in myeloid cells in renal tissues of Pax8-rtTA;Tet-on-YAPS127A mice induced with doxycycline for seven days (D7, A) or four months (M4, B). Myeloid cells in renal tissues of non-induced mice were used as control (CTR). Significant genes involved in renal tissue microenvironment reprogramming are listed on the left side of the heatmap. C, D Gene set ontology enrichment analysis showing significantly altered signaling pathways in myeloid cells in renal tissues of Pax8-rtTA;Tet-on-YAPS127A mice induced with doxycycline for seven days (D7, C) or four months (M4, D). Myeloid cells in renal tissues of non-induced mice were used as control (CTR). Representative pathways involved in renal tissue microenvironment reprogramming are listed in the plots. P.adjust is Benjamini-Hochberg adjusted p values. And P values were derived from GSEA permutation based on an adaptive multi-level split Monte-Carlo scheme implemented in fgsea R package. E UMAP projection of eight clusters identified in the myeloid cells (clusters are labeled in UMAP). F Violin plots of representative marker genes across identified myeloid cell clusters. G UMAP plots showing changes in myeloid cell subpopulations in renal tissues of Pax8-rtTA;Tet-on-YAPS127A mice induced with doxycycline for seven days (D7) and four months (M4). Renal tissues from non-induced mice were used as a control (CTR). Please note the drastic accumulation of myeloid-derived suppressor cells (MDSCs) in the renal tissue of Pax8-YAPS127A mice. H Dynamic change of myeloid cell subpopulations in renal tissue of PAX8-rtTA;Tet-on-YAPS127A mice induced with doxycycline for seven days (D7) and four months (M4). Renal tissues from non-induced mice were used as a control (CTR). *: significantly different when compared to CTR. Statistical difference were performed with scCODA with FDR = 0.05. Please note that the vast majority of increased myeloid cells are MDSCs. I) UMAP plots showing high expression of key genes associated with MDSC functionality in renal tissues of Pax8-YAPS127A mice induced with doxycycline for seven days (D7) and four months (M4). Renal tissues from non-induced mice were used as a control (CTR). Please note that mice in the M4 group were generated using a low dose/chronic induction protocol in order to avoid acute neoplasia-associated kidney failure.
Fig. 7
Fig. 7. MDSC depletion blocks the development of pRCC early lesions.
A FACS showing the effect of clodronate (CLD) on the accumulation of MDSCs in the renal tissues of doxycycline-induced Pax8-rtTA;tet-YAPS127A mice. Mice were treated with Dox ± CLD for 2 weeks before FACS analysis. Please note that the administration of CLD significantly reduced MDSCs in the neoplastic renal tissues. The violin plot (with minima, maxima, center, and percentile, etc.) on the right shows changes in MDSC ratios (n = 4-5 biological replicates). Data were analyzed with One-Way ANOVA followed by the Tukey multiple comparisons test. PBS + H2O vs. PBS + DOX: P < 0.0001 (****); PBS + DOX vs. CLD + DOX: P = 0.0081 (**). B Morphology and histology of kidneys in Pax8-rtTA;tet-YAPS127A mice treated with or without doxycycline (Dox) and clodronate (CLD) for 2 weeks. Scale bar: 25 µm. C Violin plots (with minima, maxima, median, and percentile, etc.) showing the effect of CLD on the body, kidney, and spleen weights of the Pax8-rtTA;tet-YAPS127A mice treated with or without Dox for 2 weeks (n = 5 biological replicates). Data were analyzed with One-Way ANOVA followed by the Tukey multiple comparisons test. Statistics for the kidney weight: PBS + H2O vs. PBS + DOX: P < 0.0001 (****); PBS + DOX vs. CLD + DOX: P = 0.0001 (***). Statistics for the kidney somatic index: PBS + H2O vs. PBS + DOX: P < 0.0001 (****); PBS + DOX vs. CLD + DOX: P = 0.0148 (*).D) Representative images (from six biological repeats) showing the effect of CLD on the expression of CD45 (pan-immune cell marker) and F4/80 (macrophage marker) in renal tissues of the Pax8-rtTA;tet-YAPS127A mice treated with or without Dox for 2 weeks. Scale bar: 25 µm. Source data for (A and C) are provided in the Source Data file.
Fig. 8
Fig. 8. Hyperactivation of YAP1 in renal epithelial cells results in T cell dysfunction.
A Radar plots showing the functional clusters of T cells in renal tissue with or without induction with doxycycline. The molecular features of reference cells are labeled in black. Molecular features of T cell clusters in our control and transgenic animal models are labeled in red. CD8_Teff/mem: CD8+ effector/memory T cells; Tex: CD8+ exhaust T cells; Tpex: CD8+ pro-exhaust T cells; CD8_Early Activ: CD8+ Early active T cells; CD8_Naivelike: CD8+ Naïve like T cells; CD4_Naivelike: CD4+ Naïve-like T cells; Tfh: follicular Helper T cells; Th1: type 1 helper T cells; Treg: Regulatory T cells. B Dynamic alternation of T cell subpopulations in control (CTR), early renal epithelial neoplastic lesions (D7), and pRCC (M4). *: significantly different when compared to CTR. Statistical difference were performed with scCODA with FDR = 0.05. a: p = 0.064818. CG Notched Box plots (with minima, maxima, center, and percentile, etc.) were generated at single-cell level to demonstrate the upregulation of cell surface immune suppressive molecules in Tex cells (C), apoptosis-associated molecules in tumor-infiltrating T lymphocytes (D), alterations of the intrinsic transcription factors that drive the expression of cell surface immune suppressive molecules (E), upregulation of cell surface immune suppressive molecules in Tfh cells (F), and upregulation of molecules associated with Treg suppression of T effectors (G). CTR: n = 95; D7: n = 199; M4: n = 260. Please note that mice in the M4 group were generated using a low dose/chronic induction protocol in order to avoid acute neoplasia-associated kidney failure. H FACS analyzes showing the impact of MDSC on T cell expansion. T cells were activated with a combination of IL2 (10 ng/ml), anti-CD3 (α-CD3, 1 ug/ml), and anti-CD28 (α-CD28, 1 ug/ml). T Cell expansion in the co-culture was determined by a carboxyfluorescein diacetate succinimidyl ester (CFSE) dilution assay. Representative FACS graphs showing the expansion of Cd4+ T cells (left panel) and Cd8+ T cells (right panel) (both isolated from mouse spleen) co-cultured with or without 1:1 MDSCs (isolated/purified from Pax8-YAPS127A mice) for 72 h. The same amount of bone marrow cells (BMC) was used as negative control. “Non-stimulated”: T cells without stimulation/activation (negative control). “MDSC (or BMC): T = 1: 1”: MDSCs (or BMCs) and activated T cells were cocultured with a ratio of 1:1. Please note that addition of MDSCs, not BMCs, blocked the expansion of activated Cd4+ and Cd8+ T cells in the co-culture system.
Fig. 9
Fig. 9. TEAD inhibitor MGH-CP1 blocked YAP-induced kidney neoplasia.
A Structure of the MGH-CP1 molecule. B Kidney size and morphology of control mice (Ctrl), Pax8-YAPS127A mice (YAP, Dox-induced Pax8-rtTA;Tet-on-YAPS127A mice), and Pax8-YAPS127A mice treated with MGH-CP1 (YAP + MGH-CP1). Ruler scale: 1 mm. C Changes of body weight in control mice (Ctrl), Pax8-YAPS127A mice (YAP), and MGH-CP1 treated Pax8-YAPS127A mice (YAP + MGH-CP1). Data were represented as the mean ± SEM (Ctrl: n = 10; YAP: n = 12; YAP + MGH-CP1: n = 18 biological replicates). Data were analyzed with One-Way ANOVA followed by the Tukey multiple comparisons test. Statistics for the kidney weight: CTL vs. YAP: P < 0.0001 (****); YAP vs. YAP + MGH-CP1: P < 0.0001 (****). Statistics for the kidney/body ratio (%): CTL vs. YAP: P < 0.0001 (****); YAP vs. YAP + MGH-CP1: P = 0.0001 (***).D Representative H-E staining images showing changes in kidney size and histological morphology in control mice (Ctrl), Pax8-YAPS127A mice (YAP), and MGH-CP1 treated Pax8-YAPS127A mice (YAP + MGH-CP1). E Survival curves of control mice (Ctrl), Dox-induced Pax8-YAPS127A mice (YAP), and Pax8-YAPS127A mice treated with MGH-CP1 (YAP + MGH-CP1). F representative H-E staining images showing renal tissue histology of control mice (Ctrl), Pax8-YAPS127A mice (YAP), and MGH-CP1 treated Pax8-YAPS127A mice (YAP + MGH-CP1). The experiments with the similar results have been independently repeated for more than ten times. Scale bar: 50μm. G IHC images showing the expression of YAP1, CD45, and MDSC biomarkers (Arginase 1, F4/80, and VISTA) in renal tissues from control mice (Ctrl, n = 6), Pax8-YAPS127A mice (YAP, n = 6), and MGH-CP1 treated Pax8-YAPS127A mice (YAP + MGH-CP1, n = 6). Source data for panels C and E are provided in the Source Data file.

Similar articles

References

    1. Yu, F. X. & Guan, K. L. The Hippo pathway: regulators and regulations. Genes Dev.27, 355–371 (2013). - PMC - PubMed
    1. Zhao, B., Li, L., Lei, Q. & Guan, K. L. The Hippo-YAP pathway in organ size control and tumorigenesis: an updated version. Genes Dev.24, 862–874 (2010). - PMC - PubMed
    1. Zheng, Y. & Pan, D. The hippo signaling pathway in development and disease. Dev. Cell50, 264–282 (2019). - PMC - PubMed
    1. Meng, Z., Moroishi, T. & Guan, K. L. Mechanisms of Hippo pathway regulation. Genes Dev.30, 1–17 (2016). - PMC - PubMed
    1. Harvey, K. & Tapon, N. The Salvador-Warts-Hippo pathway - an emerging tumour-suppressor network. Nat. Rev. Cancer7, 182–191 (2007). - PubMed

MeSH terms

LinkOut - more resources