. 2025 Mar 25;15(1):93.
doi: 10.1038/s41398-025-03308-4.

Intravenous psilocybin induces dose-dependent changes in functional network organization in rat cortex

Affiliations

Intravenous psilocybin induces dose-dependent changes in functional network organization in rat cortex

Brian H Silverstein et al. Transl Psychiatry. .

Abstract

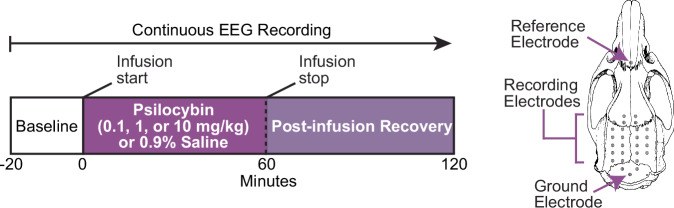
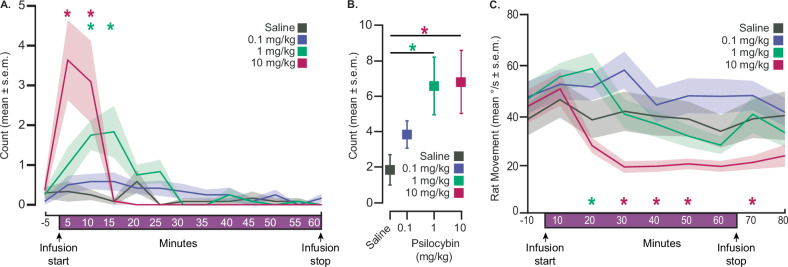
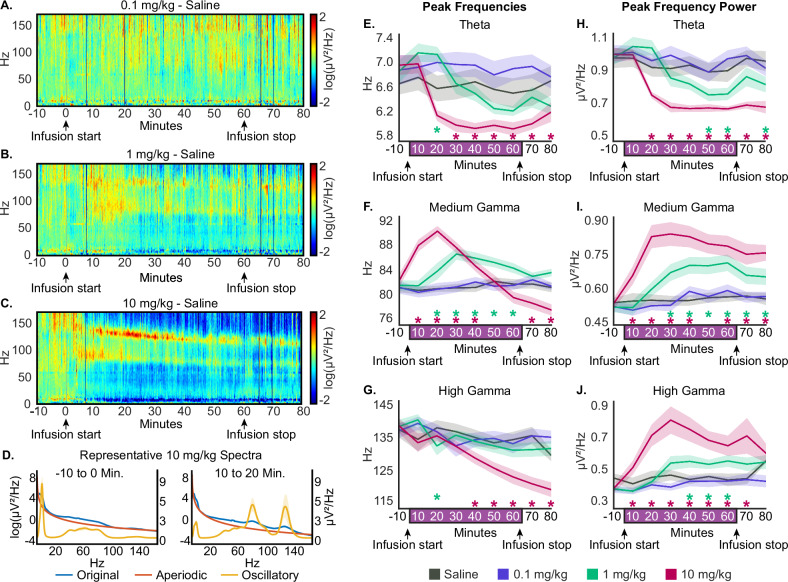
Psilocybin produces an altered state of consciousness in humans and is associated with complex spatiotemporal changes in cortical networks. Given the emphasis on rodent models for mechanistic studies, there is a need for characterization of the effect of psilocybin on cortex-wide network dynamics. Previous electroencephalographic studies of psychedelics in rodents have primarily used sparse electrode arrays with limited spatial resolution, precluding network level analysis, and have been restricted to lower gamma frequencies. Therefore, in this study, we used electroencephalographic recordings from 27 sites/electrodes across rat cortex (n = 6 male, 6 female) to characterize the effect of psilocybin (0.1, 1, and 10 mg/kg delivered over an hour) on brain network organization as inferred through changes in node degree (an index of network density) and connection strength (via weighted phase-lag index). The removal of aperiodic component from the electroencephalogram localized the primary oscillatory changes to theta (4-10 Hz), medium gamma (70-110 Hz), and high gamma (110-150 Hz) bands, which were used for the network analysis. Additionally, we determined the concurrent changes in theta-gamma phase-amplitude coupling. We report that psilocybin, in a dose-dependent manner, 1) disrupted theta-gamma coupling [p < 0.05], 2) increased frontal high gamma connectivity [p < 0.05] and posterior theta connectivity [p ≤ 0.049], and 3) increased frontal high gamma [p < 0.05] and posterior theta [p ≤ 0.046] network density. The behavioral activity and the medium gamma frontoparietal connectivity showed an inverted-U relationship with psilocybin dose. Our results suggest that high-frequency network organization, decoupled from local theta-phase, may be an important signature of psilocybin-induced non-ordinary state of consciousness.


Conflict of interest statement

Competing interests: Jim Gilligan, Ph.D. is President & Chief Scientific Officer at Tryp Therapeutics. Peter Guzzo, PhD is Consulting VP, Drug Development at Tryp Therapeutics. Ethics approval and consent to participate: All experiments were approved by the Institutional Animal Care and Use Committee at the University of Michigan, Ann Arbor, and were conducted in compliance with the Guide for the Care and Use of Laboratory Animals (Ed 8, National Academies Press) and ARRIVE Guidelines.

Figures

Fig. 1
Fig. 1. Schematics showing the experimental design and timeline.
Each rat (n = 12, 6 male, 6 female) received 0.9% saline and three doses of psilocybin (0.1, 1, and 10 mg/kg) as a continuous infusion over the course of an hour. Each infusion session was separated by 5–7 days and was conducted in a random order. On the right-side of the experimental timeline, an image of the rat cranium indicating the EEG, ground, and reference electrode locations is shown.
Fig. 2
Fig. 2. Effect of intravenous psilocybin on head-twitch response and rat movement.
A The head-twitch response (HTR) was quantified for the 5-min period prior to the start of intravenous infusion of psilocybin/saline, and for the entirety of the 60-min infusion period (n = 12, 6 male and 6 female rats for all treatment groups except for 10 mg/kg group which had 5 male rats). HTR count data are presented as group means ± standard error of the means in 5-min bins. The 10 mg/kg psilocybin infusion produced significantly more head-twitches in comparison to that observed after saline in the first 5 min of the infusion (p ≤ 0.0001). The 10 mg/kg (p ≤ 0.0001) and 1 mg/kg (p = 0.0004) psilocybin infusions produced significantly more head-twitches 5–10 min into the 60-min infusion in comparison to that observed after saline infusion. The 1 mg/kg psilocybin infusion displayed significantly more head-twitches in comparison to the saline infusion (p ≤ 0.0001) 10–15 min into the 60-min infusion. *p < 0.05, Tukey post-hoc comparisons between saline and psilocybin doses. B Total HTR count for the entirety of each 60-min infusion was quantified and data are presented as group means ± standard error of the means. Both the 10 mg/kg (p = 0.0308) and 1 mg/kg (p = 0.0362) infusions displayed significant increases in total HTR count for the entirety of the 60-min intravenous psilocybin infusions in comparison to saline. *p < 0.05, Tukey post-hoc comparisons between saline and psilocybin doses. C 3axis gyroscope activity was averaged in 10-min bins and plotted as mean ± standard error of the mean. The 1 mg/kg dose briefly increased rat movements, whereas the 10 mg/kg dose resulted in a quiescent state with minimal movement, thereby dissociating the increased gamma power from movement. *p < 0.05, FDR-corrected post-hoc comparisons between saline and psilocybin doses. The exact p values are provided in the results section.
Fig. 3
Fig. 3. Intravenous psilocybin altered global peak oscillatory frequencies and amplitudes in a dose-dependent manner.
AC Global spectrograms averaged across rats (n = 12, 6 male, 6 female) depicting the difference between each dose (0.1, 1, and 10 mg/kg) and saline. Psilocybin/saline infusion started at time = 0 min and stopped at time = 60 min. Warm colors indicate higher spectral power while cool colors indicate lower spectral power relative to saline. D Representative global power spectrum averaged over minutes −10 to 0 (left) and 10–20 (right) of 10 mg/kg psilocybin dose. The FOOOF algorithm was used to model and remove the 1/f component from the original power spectrum to quantify band-specific peak frequencies and amplitudes. Displayed here are the original power spectrum (blue), the aperiodic component (red), and the oscillatory component (gold). For visualization purposes, the original and aperiodic spectra are log-transformed (left y-axis) and the oscillatory spectra are on a linear scale (right y-axis). EJ Changes in peak frequency and amplitude in the theta, medium gamma, and high gamma bands. The 1 mg/kg of psilocybin slowed theta peak frequency and increased medium gamma peak frequency. The 10 mg/kg psilocybin dose caused a significant decrease in theta peak frequency. The 10 mg/kg dose initially increased medium gamma peak frequency, but towards the end of infusion the peak frequency slowed relative to saline. The 1 and 10 mg/kg doses of psilocybin decreased theta amplitude and increased medium and high gamma amplitudes relative to saline. The data are provided as mean ± standard error of the mean. *p < 0.05, FDR-corrected post-hoc comparisons. The exact p values are provided in the results section.
Fig. 4
Fig. 4. Intravenous administration of psilocybin dose-dependently disrupted theta-gamma coupling.
Following psilocybin infusion, both the 1 and 10 mg/kg doses resulted in decoupling of theta phase from medium A and high B gamma amplitudes in a dose-dependent fashion. The phase amplitude coupling (PAC) was not altered by the 0.1 mg/kg dose. Each grid represents a 10-min average of PAC values across all rats (n = 12, 6 male, 6 female). Each square indicates an electrode in the layout described in Fig. 1. White and black asterisks: *p < 0.05, FDR-corrected post-hoc comparisons. The exact p values are provided in the results section.
Fig. 5
Fig. 5. Intravenous administration of psilocybin induced broad reorganization of theta and gamma cortical connectivity patterns.
wPLI connectivity differences between psilocybin and saline averaged across rats (n = 12, 6 male, 6 female) and over 10-min bins. Red lines indicate increased wPLI relative to saline, blue lines indicate decreased wPLI relative to saline. Black dots indicate electrode location corresponding to the electrode map shown in Fig. 1. Dot size indicates the magnitude of node degree. Yellow dots show significantly increased node degree relative to saline. Only connections that were significantly different (p < 0.05) from saline following FDR-correction are displayed. Beginning halfway through infusion, the 1 mg/kg psilocybin dose caused sparse increases in frontoparietal theta connectivity A, increased medium gamma frontal connectivity, but decreased posterior connectivity B, and caused broad frontoparietal increases in high gamma connectivity C. The 10 mg/kg psilocybin dose had a similar effect on cortical connectivity, but was amplified in a dose-dependent fashion, in particular causing large increases in theta posterior connectivity A, increasing, then decreasing medium gamma frontoparietal connectivity B, and increasing frontoparietal high gamma connectivity C. The exact p values are provided in the results section.

Update of

References

    1. Gukasyan N, Davis AK, Barrett FS, Cosimano MP, Sepeda ND, Johnson MW, et al. Efficacy and safety of psilocybin-assisted treatment for major depressive disorder: prospective 12-month follow-up. J Psychopharmacol. 2022;36:151–8. - PMC - PubMed
    1. Griffiths RR, Johnson MW, Carducci MA, Umbricht A, Richards WA, Richards BD, et al. Psilocybin produces substantial and sustained decreases in depression and anxiety in patients with life-threatening cancer: a randomized double-blind trial. J Psychopharmacol. 2016;30:1181–97. - PMC - PubMed
    1. Davis AK, Barrett FS, May DG, Cosimano MP, Sepeda ND, Johnson MW, et al. Effects of psilocybin-assisted therapy on major depressive disorder: a randomized clinical trial. JAMA Psychiatry. 2021;78:1. - PMC - PubMed
    1. Raison CL, Sanacora G, Woolley J, Heinzerling K, Dunlop BW, Brown RT, et al. Single-dose psilocybin treatment for major depressive disorder: a randomized clinical trial. JAMA. 2023;330:843–53. - PMC - PubMed
    1. Bogenschutz MP, Ross S, Bhatt S, Baron T, Forcehimes AA, Laska E, et al. Percentage of heavy drinking days following psilocybin-assisted psychotherapy vs placebo in the treatment of adult patients with alcohol use disorder: a randomized clinical trial. JAMA Psychiatry. 2022;79:953. - PMC - PubMed

LinkOut - more resources