. 2025 Mar 24;16(1):2871.
doi: 10.1038/s41467-025-58115-8.

A combined adjuvant and ferritin nanocage based mucosal vaccine against Streptococcus pneumoniae induces protective immune responses in a murine model

Affiliations

A combined adjuvant and ferritin nanocage based mucosal vaccine against Streptococcus pneumoniae induces protective immune responses in a murine model

Tien Duc Nguyen et al. Nat Commun. .

Erratum in

Abstract

Protein nanocages are multimeric structures that can be engineered to mimic the molecular conformation of microorganisms. Based on previous findings showing that a mucosal FlaB-tPspA fusion (flagellin fused with truncated PspA antigen of Streptococcus pneumoniae) vaccine-induced protective immune response against S. pneumoniae, we develop a ferritin nanocage vaccine displaying multivalent presentation of both antigen and adjuvant on a nanocarrier using the SpyTag/SpyCatcher strategy. The 1:1 antigen/adjuvant nanocage is further used as a mucosal vaccine, which can translocate to draining lymph nodes with higher efficiency than fusion vaccine. Moreover, intranasal immunization with the nanocage vaccine significantly enhances mucosal immune responses with more efficient B-cell memory generation and antibody maturation, as well as more balanced (Th1/Th2) immune responses with increased IFN-γ and IL-17 production, comparing with fusion vaccine. Mice immunized with the nanocage vaccine exhibited enhanced protection against lethal infection compare to the FlaB-tPspA fusion group. Our study thus demonstrates the effectiveness of an all-in-one nanocage mucosal vaccine platform, which guarantees enhanced protection with balanced immune responses.


Conflict of interest statement

Competing interests: The authors declare no competing interests.

Figures

Fig. 1
Fig. 1. Development of a ferritin-based nanocage vaccine consisting of the tPspA antigen and FlaB adjuvant (Ftn-tPspA-FlaB nanocage: FPB NC) using the SpyTag-SpyCatcher system.
A Schematic representation of the strategy for developing the FPB nanocage vaccine. This diagram provides a visual representation of the plasmid constructs. It simulates the protein structure of the critical components of the ferritin-tPspA-FlaB nanocage (FPB NC): SpyTag-ferritin, SpyCatcher-tPspA, and SpyCatcher-FlaB. The depicted DNA fragments correspond to essential elements of the constructs representing ΔN1-SpyCatcher (SC, cyan), SpyTag (ST, violet), truncated PspA (tPspA; amino acid 3-236, red), FlaB (green), and ferritin (yellow). SC-tPspA, ST-Ftn, and SC-FlaB each contain a (G4S)3 linker (dark blue). The resulting FPB nanocage structure was simulated in three dimensions. B Sodium dodecyl sulfate-polyacrylamide gel electrophoresis (SDS-PAGE) analysis. Recombinant proteins, including ST-Ftn, SC-tPspA, SC-FlaB, the FPB mixture (24:10:10), and purified FPB NC by ion-exchange chromatography (Left panel) were resolved using SDS-PAGE. The right panel presents a representative ion exchange chromatogram alongside the corresponding SDS-PAGE pattern. Data are a representative of three independent experiments.
Fig. 2
Fig. 2. Characteristics of the FPB NC vaccine.
A Native-PAGE analysis of FPB NC. The Ftn-tPspA-FlaB nanocage mixture was incubated for 16 h at 4 °C, or the FPB NC purified by ion-exchange chromatography was mixed with native loading buffer and loaded onto a 10% native-PAGE gel. A purified ST-Ftn nanocage (ST-Ftn NC) was used as a control. B Western blot of FPB NC. The recombinant proteins were resolved using SDS-PAGE, and subsequently, the protein bands were detected and visualized using the anti-tPspA, anti-FlaB, or anti-Ftn antibody. C TEM image of the FPB NC. The purified FPB NCs were negatively stained with phosphotungstic acid (scale bar = 50 nm). D Dynamic light scattering (DLS)-mediated size measurement of FPB NC. The data revealed that FPB NC has an average diameter of 24.8 ± 6.3 nm. E Determination of TLR5-dependent NFκB stimulation activity of FPB NC. The relative luciferase activity levels in the cell extracts were analyzed by a dual-luciferase reporter assay system and normalized using the pCMV-β-galactosidase plasmid as a control. The same molar ratios of proteins (FlaB equivalent) were used, and PBS was used as a negative control (n = 3 biological replicates). Data are presented as mean values ± SEM. Statistical differences were analyzed using Student’s t test. ** P < 0.01; *** P < 0.001; ****P < 0.0001. Source data are provided as a Source Data file. Detail P values are provided in the Source Data file.
Fig. 3
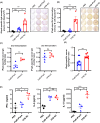
Fig. 3. Antigen-specific systemic and mucosal antibody responses induced by intranasal (I.N.) immunization of the FPB NC vaccine.
A Experimental schedule for immunization. BALB/c mice were intranasally (I.N.) immunized with either phosphate-buffered saline (PBS), 6.5 μg of FlaB-tPspA, or 14.5 μg of FPB NC three times at two-week intervals for a total volume of 20 µl per mouse. B Determination of tPspA-specific systemic IgG or IgA titers. Two weeks after the final immunization, the levels of tPspA-specific serum IgG were evaluated using the enzyme-linked immunosorbent assay (ELISA). C Determination of the tPspA-specific mucosal IgA titer. Two weeks after the final immunization, tPspA-specific serum IgA levels in BAL-F, nasal wash, or saliva were evaluated using ELISA (n = 10 biological replicates). Data are presented as mean values ± SEM. Statistical differences were analyzed using one-way ANOVA. Statistical significance: *P < 0.05; **P < 0.01; ***P < 0.001; ****P < 0.0001; ns = not significant. Source data are provided as a Source Data file. Detail P values are provided in the Source Data file.
Fig. 4
Fig. 4. High-quality antigen-specific immune responses induced by intranasal (I.N.) immunization of the FPB NC vaccine.
Determination of tPspA-specific plasma cells (A) and memory B cells (B). Two weeks after the final vaccination, tPspA-specific IgA-secreting plasma cells from the bone marrow and memory B cells from the spleen were evaluated via the ELISPOT assay (n = 4 biological replicates). Data are presented as mean values ± SEM. Statistical differences were analyzed using one-way ANOVA. Statistical significance: *P < 0.05; **P < 0.01; ****P < 0.0001; ns = not significant. Source data are provided as a Source Data file. Detail P values are provided in the Source Data file. C Determination of the tPspA-specific IgG avidity index. One week after the 2nd and 3rd immunizations, the tPspA-specific serum IgG serum avidity was evaluated using ELISA (n = 4 biological replicates). D Determination of tPspA-specific serum IgG2a/IgG1. Two weeks after the final immunization, the tPspA-specific serum IgG2a/IgG1 ratio was evaluated using an enzyme-linked immunosorbent assay (ELISA) (n = 9 biological replicates). Data are presented as mean values ± SEM. Statistical differences between two groups were analyzed using Student’s t-test. Statistical significance: *P < 0.05; **P < 0.01; ****P < 0.0001; ns = not significant. Source data are provided as a Source Data file. Detail P values are provided in the Source Data file. E Determination of tPspA-specific IFN-γ, IL-4, and IL-17 production. Two weeks after the final immunization, splenocytes were isolated and stimulated with 1 μg/ml of tPspA for three days. Cytokine levels were then measured using ELISA (n = 3 biological replicates). Data are presented as mean values ± SEM. Statistical differences were analyzed using one-way ANOVA. Statistical significance: *P < 0.05; **P < 0.01; ****P < 0.0001; ns = not significant. Source data are provided as a Source Data file. Detail P values are provided in the Source Data file.
Fig. 5
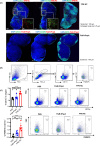
Fig. 5. Delivery of the FPB NC to the draining lymph nodes.
A Observation of the FPB NC delivery to the draining lymph nodes by confocal microscope. Seven-week-old BALB/c mice were subcutaneously (S.C.) immunized in the groin with PBS, 30 μg of FNR675-conjugated FlaB-tPspA, or 30 μg of FNR675-conjugated FPB NC. Three hours after administration, inguinal lymph node (iLN) sections were prepared, and confocal microscopic observation was performed using anti-CD11c, anti-B220, and anti-CD169 antibodies. The most left enlarged image showed the interaction between FPB NC (red) and CD11c+ cells (green). Middle enlarged image showed the interaction between FPB NC (red) and CD169+ (green). Data representative from at least 2 times independent experiments. B Gating strategy to determine the percentage of FNR675+ cells within CD11c+ population in mice immunized with FPB NC, FlaB-tPspA and PBS. C Determination of the FPB NC delivery in the draining lymph nodes by flow cytometry. Three hours after the administration, iLNs cells were prepared, and flow cytometric analysis was performed (n = 5 biological replicates). Data are presented as mean values ± SEM. Statistical differences were analyzed using one-way ANOVA. Statistical significance: *P < 0.05; **P < 0.01; ****P < 0.0001; ns = not significant. Source data are provided as a Source Data file. Detail P values are provided in the Source Data file.
Fig. 6
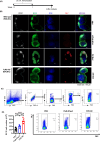
Fig. 6. Germinal center formation by intranasal (I.N.) immunization of the FPB NC vaccine.
A Experimental schedule for immunization. BALB/c mice were intranasally (I.N.) immunized with PBS, 50 μg of FlaB-tPspA, or 50 μg of FPB NC two times at one-week intervals for a total volume of 20 µl per mouse. B Immunofluorescence staining of cervical lymph nodes (cLNs). One week after the last administration, cLN sections were prepared, and confocal microscopic observation was performed using anti-CD21, anti-B220, anti-CD3, and anti-GL7 antibodies. Data representative from at least 2 times independent experiments. C Gating strategy to determine the percentage of GL7+ cells within B220+ population in mice immunized with FPB NC, FlaB-tPspA and PBS. D Detection of germinal center B cell by flow cytometry. One week after the last administration, cLNs cells were prepared, and absolute numbers of B220+ GL7+ in cLNs were analyzed by flow cytometry (n = 5 biological repllicates). Data are presented as mean values ± SEM. Statistical differences were analyzed using one-way ANOVA. Statistical significance: *P < 0.05; **P < 0.01; ****P < 0.0001; ns = not significant. Source data are provided as a Source Data file. Detail P values are provided in the Source Data file.
Fig. 7
Fig. 7. The follicular helper T cell (Tfh) expansion in the draining lymph nodes by intranasal (I.N.) immunization of the FPB NC vaccine.
A Experimental schedule for immunization. BALB/c mice were intranasally (I.N.) immunized with PBS, 6.5 μg of FlaB-tPspA, or 14.5 μg of FPB NC two times at two-week intervals for a total volume of 20 µl per mouse. B Gating strategy to determine the percentage of PD-1+CXCR5+ cells within CD3+CD4+ population in mice immunized with FPB NC, FlaB-tPspA and PBS. C Detection of Tfhs by flow cytometry. Two weeks after the last administration, cLNs cells were prepared, and flow cytometric analysis was performed (n = 6 biological replicates). Data are presented as mean values ± SEM. Statistical differences were analyzed using one-way ANOVA. Statistical significance: *P < 0.05; **P < 0.01; ****P < 0.0001; ns = not significant. Source data are provided as a Source Data file. Detail P values are provided in the Source Data file.
Fig. 8
Fig. 8. Protection against live Streptococcus pneumoniae infection by intranasal vaccination.
A Experimental schedule of lethal challenge with live S. pneumoniae. Determination of the protective immune response against lethal challenge with S. pneumonia WU2 (B) or D39 (C) strain. Groups of mice were intranasally (I.N.) vaccinated with PBS, 6.5 μg of FlaB-tPspA, or 14.5 μg of FPB NC three times at two-week intervals. Two weeks after the last immunization, the immunized mice were I.N. challenged with a 1.9 x LD50 of live S. pneumoniae WU2 (n = 9 biological replicates) or a 1.7 x LD50 of live S. pneumoniae D39 (n = 10 biological replicates) separately. After the challenge, the survival rate was monitored. Statistical differences were analyzed by the log-rank (Mantel-Cox) test. D Determination of pneumococcal colony-forming units (CFU) in lung tissue, bronchoalveolar lavage fluid (BAL-F), and blood samples. Two weeks after the final immunization, mice were intranasally challenged with live S. pneumoniae WU2 (0.6 × 108 CFU/mouse; 0.6×LD50). Seventy-two hours post-challenge, pneumococcal CFU was quantified in lung tissue, BAL-F, and blood samples (n = 4 biological replicates). Data are presented as mean values ± SEM. Statistical differences were analyzed using one-way ANOVA. Statistical significance: *P < 0.05; **P < 0.01; ****P < 0.0001; ns = not significant. Source data are provided as a Source Data file. Detail P values are provided in the Source Data file.

References

    1. Lavelle, E. C. & Ward, R. W. Mucosal vaccines - fortifying the frontiers. Nat Rev Immunol22, 236–250 (2022). - PMC - PubMed
    1. Li, M. et al. Mucosal vaccines: Strategies and challenges. Immunol Lett217, 116–125 (2020). - PubMed
    1. Kim, S. A. et al. Protein-based nanocages for vaccine development. J Control Release353, 767–791 (2023). - PubMed
    1. Bhaskar, S. & Lim, S. Engineering protein nanocages as carriers for biomedical applications. Npg Asia Mater. 9, e371 (2017). - PMC - PubMed
    1. Lee, E. J., Lee, N. K. & Kim, I. S. Bioengineered protein-based nanocage for drug delivery. Adv Drug Deliver Rev106, 157–171 (2016). - PubMed

MeSH terms

LinkOut - more resources