. 2025 May;31(5):1644-1652.
doi: 10.1038/s41591-025-03570-5. Epub 2025 Mar 24.

Optimal dietary patterns for healthy aging

Affiliations

Optimal dietary patterns for healthy aging

Anne-Julie Tessier et al. Nat Med. 2025 May.

Abstract

As the global population ages, it is critical to identify diets that, beyond preventing noncommunicable diseases, optimally promote healthy aging. Here, using longitudinal questionnaire data from the Nurses' Health Study (1986-2016) and the Health Professionals Follow-Up Study (1986-2016), we examined the association of long-term adherence to eight dietary patterns and ultraprocessed food consumption with healthy aging, as assessed according to measures of cognitive, physical and mental health, as well as living to 70 years of age free of chronic diseases. After up to 30 years of follow-up, 9,771 (9.3%) of 105,015 participants (66% women, mean age = 53 years (s.d. = 8)) achieved healthy aging. For each dietary pattern, higher adherence was associated with greater odds of healthy aging and its domains. The odds ratios for the highest quintile versus the lowest ranged from 1.45 (95% confidence interval (CI) = 1.35-1.57; healthful plant-based diet) to 1.86 (95% CI = 1.71-2.01; Alternative Healthy Eating Index). When the age threshold for healthy aging was shifted to 75 years, the Alternative Healthy Eating Index diet showed the strongest association with healthy aging, with an odds ratio of 2.24 (95% CI = 2.01-2.50). Higher intakes of fruits, vegetables, whole grains, unsaturated fats, nuts, legumes and low-fat dairy products were linked to greater odds of healthy aging, whereas higher intakes of trans fats, sodium, sugary beverages and red or processed meats (or both) were inversely associated. Our findings suggest that dietary patterns rich in plant-based foods, with moderate inclusion of healthy animal-based foods, may enhance overall healthy aging, guiding future dietary guidelines.


Conflict of interest statement

Competing interests: M.G.-F. is the principal investigator of a grant funded by the International Nut Council. The other authors declare no competing interests.

Figures

Fig. 1
Fig. 1. Flow diagram of the study participants.
This flow diagram shows the initial sample sizes in the NHS and HPFS followed by the sequential application of exclusion criteria for each cohort. The final study population includes a total of 105,015 participants.
Fig. 2
Fig. 2. Associations of average dietary patterns with healthy aging and its domains.
In the main pooled dataset (n = 105,015), the average dietary pattern scores were calculated from 1986 to 2010. The forest plots show the ORs comparing Q5 to Q1 for each of the dietary patterns (visually represented by the centers of the error bars), the 95% CIs (visually represented by the error bars) and E values and their lower bound. Logistic regressions were used to estimate ORs and were adjusted for age at baseline (1986), cohort (sex), BMI (kg m2), ancestry (European, Asian, African-American, Other), smoking status (never, former, current smoker: 1–14 cigarettes per day, 15–24 cigarettes per day and ≥25 cigarettes per day), alcohol intake (g per day) (for DASH, hPDI, PHDI), physical activity (MET-h week−1), multivitamin use ever (yes/no), family history of myocardial infarction (yes/no), family history of type 2 diabetes, family history of cancer, family history of dementia (yes/no), postmenopausal status (yes/no) and menopausal hormone use (no, past or current hormone use; only women), SES at baseline, marital status (yes/no), living alone ever (yes/no) and history of depression (yes/no) in the pooled cohorts. rEDIH and rEDIP are reversed scores to allow comparison with other scores. All two-sided P < 0.0001. The heatmaps show the OR difference between all pairs of scores. Positive differences are denoted in green and negative differences in pink; a darker color indicates a greater difference. *Two-sided P < 0.05 based on a paired t-test comparing ORs (not adjusted for multiple comparisons).
Fig. 3
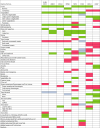
Fig. 3. Dietary factors of dietary patterns.
Pink: lower points or negative weights were assigned to higher intakes for this dietary factor; green: higher points or positive weights were assigned to higher intakes for this dietary factor; gray: higher points or positive weights were assigned to moderate intake. The EDIH and EDIP are presented as reversed scores to allow for comparison with other dietary scores.
Fig. 4
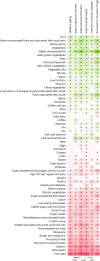
Fig. 4. Multivariable-adjusted associations between dietary factors and healthy aging and its domains in the main pooled dataset (n = 105,015).
Each heatmap square represent the OR comparing the 90th to the 10th percentile for each of the dietary factors. Logistic regressions were used to estimate ORs and were adjusted for age at baseline (1986), cohort (sex), BMI (kg m2), ancestry (European, Asian, African-American, Other), smoking status (never, former, current smoker: 1–14 cigarettes per day, 15–24 cigarettes per day and ≥25 cigarettes per day), alcohol intake (g per day), physical activity (MET-h week−1), multivitamin use ever (yes/no), family history of myocardial infarction (yes/no), family history of type 2 diabetes, family history of cancer, family history of dementia (yes/no), postmenopausal status (yes/no) and menopausal hormone use (no, past, or current hormone use; women only), SES at baseline, marital status (yes/no), living alone ever (yes/no) and history of depression (yes/no) in the pooled cohorts. ORs greater than 1.0 are denoted in green; ORs below 1.0 are denoted in pink; a darker color indicates a stronger association. *Two-sided P values corrected for multiple comparisons using a false discovery rate (FDR) < 0.05.
Fig. 5
Fig. 5. Subgroup analysis of the associations between average dietary pattern scores and healthy aging in the main pooled dataset (n = 105,015).
The forest plots show the ORs comparing the 90th to the 10th percentile for each of the dietary patterns (visually represented by the centers of the error bars) and 95% CIs (visually represented by error bars). Logistic regressions were used to estimate the ORs and were adjusted for age at baseline (1986), cohort (sex), BMI (kg m2), ancestry (European, Asian, African-American, Other), smoking status (never, former, current smoker: 1–14 cigarettes per day, 15–24 cigarettes per day and ≥25 cigarettes per day), alcohol intake (g per day), physical activity (MET-h week−1), multivitamin use ever (yes/no), family history of myocardial infarction (yes/no), family history of type 2 diabetes, family history of cancer, family history of dementia (yes/no), postmenopausal status (yes/no) and menopausal hormone use (no, past, or current hormone use; women only), SES at baseline, marital status (yes/no), living alone ever (yes/no) and history of depression (yes/no), excluding the stratified variable where applicable, in the pooled cohorts. ** two-sided P interaction <0.0001 (not adjusted for multiple comparisons). *Two-sided P interaction < 0.05 (not adjusted for multiple comparisons); sex, AHEI P = 0.022; MIND P = 0.001; hPDI P = 0.002; PHDI P = 0.0008; BMI, AHEI P = 0.001; MIND P = 0.024; and hPDI P = 0.015. For physical activity, DASH P = 0.0003; hPDI P = 0.0005; rEDIP P =0.023. For smoking, AHEI P = 0.005; aMED P = 0.010; MIND P = 0.0007; hPDI P = 0.002. For SES, rEDIH P = 0.019; rEDIP P = 0.023.
Extended Data Fig. 1
Extended Data Fig. 1. Pairwise Spearman correlations between energy-adjusted average (1986-2010) dietary pattern scores.
A. Pairwise Spearman correlations were applied in the pooled main dataset (n = 105,015). P values for all correlations are two-sided and <0.0001 (not adjusted for multiple comparisons); B. Pairwise Spearman correlations were applied in the pooled dataset excluded participants with missing UPF data (n = 104,635). P values for all correlations are two-sided and <0.0001 (not adjusted for multiple comparisons). AHEI, alternative healthy eating index; AMED, alternative Mediterranean diet index; DASH, Dietary approaches to stop hypertension; MIND, Mediterranean-DASH intervention for neurodegenerative delay diet; hPDI, healthful plant-based diet index; PHDI, planetary health diet index; EDIH, empirical dietary index for hyperinsulinemia; EDIP, empirical dietary inflammatory pattern. The rEDIH and rEDIP are reversed scores to allow for comparison with other dietary scores.

References

    1. Centers for Disease Control and Prevention. Healthy Aging at a Glance, 2015: Helping People to Live Long and Productive Lives and Enjoy a Good Quality of Lifehttps://stacks.cdc.gov/view/cdc/43961 (National Center for Chronic Disease Prevention and Health Promotion (U.S.) & Division of Adult and Community Health, 2015).
    1. Office of Disease Prevention and Health Promotion. Healthy Aginghttps://health.gov/our-work/national-health-initiatives/healthy-aging#:~... (OASH, 2023).
    1. Afshin, A. et al. Health effects of dietary risks in 195 countries, 1990–2017: a systematic analysis for the Global Burden of Disease Study 2017. Lancet393, 1958–1972 (2019). - PMC - PubMed
    1. Mokdad, A. H. et al. The state of US health, 1990–2016: burden of diseases, injuries, and risk factors among US states. JAMA319, 1444–1472 (2018). - PMC - PubMed
    1. Bautmans, I. et al. WHO working definition of vitality capacity for healthy longevity monitoring. Lancet Healthy Longev.3, e789–e796 (2022). - PMC - PubMed