. 2025 May;44(9):2596-2619.
doi: 10.1038/s44318-025-00410-7. Epub 2025 Mar 24.

S-palmitoylation modulates ATG2-dependent non-vesicular lipid transport during starvation-induced autophagy

Affiliations

S-palmitoylation modulates ATG2-dependent non-vesicular lipid transport during starvation-induced autophagy

Wenhui Zheng et al. EMBO J. 2025 May.

Abstract

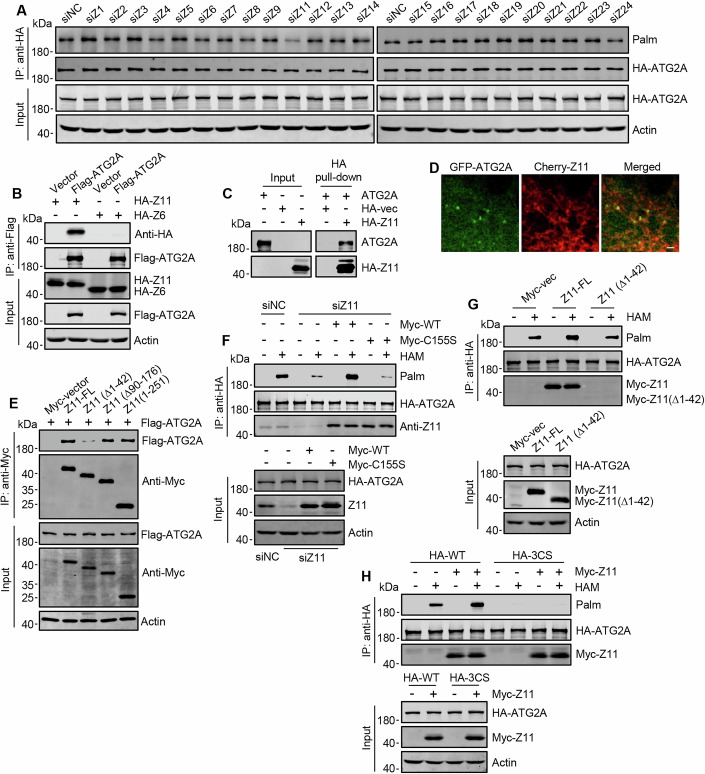
Lipid transfer proteins mediate the non-vesicular transport of lipids at membrane contact sites to regulate the lipid composition of organelle membranes. Despite significant recent advances in our understanding of the structural basis for lipid transfer, its functional regulation remains unclear. In this study, we report that S-palmitoylation modulates the cellular function of ATG2, a rod-like lipid transfer protein responsible for transporting phospholipids from the endoplasmic reticulum (ER) to phagophores during autophagosome formation. During starvation-induced autophagy, ATG2A undergoes depalmitoylation as the balance between ZDHHC11-mediated palmitoylation and APT1-mediated depalmitoylation. Inhibition of ATG2A depalmitoylation leads to impaired autophagosome formation and disrupted autophagic flux. Further, in cell and in vitro analyses demonstrate that S-palmitoylation at the C-terminus of ATG2A anchors the C-terminus to the ER. Depalmitoylation detaches the C-terminus from the ER membrane, enabling it to interact with phagophores and promoting their growth. These findings elucidate a S-palmitoylation-dependent regulatory mechanism of cellular ATG2, which may represent a broad regulatory strategy for lipid transport mediated by bridge-like transporters within cells.

Keywords: ATG2; Autophagy; Lipid Transfer Protein; S-palmitoylation.


Conflict of interest statement

Disclosure and competing interests statement. The authors declare no competing interests.

Figures

Figure 1
Figure 1. ATG2 undergoes depalmitoylation at its C-terminal during cell starvation.
(AC) ATG2 S-palmitoylation in HEK293T cells. Cells were transfected with either Flag-ATG2A or Flag-ATG2B, or left untransfected, and treated with 2-BP or EBSS 48 h post-transfection. ABE assays analyzed the S-palmitoylation levels of Flag-ATG2A (A), endogenous ATG2A (B), and Flag-ATG2B (C). Hydroxylamine (HAM) cleaves and unmasks the thiol group of palmitoylated cysteine in ABE assays. ‘Palm’ indicates biotin levels on target protein detected via Streptavidin-HRP. (D) 17-ODYA metabolic labeling and click chemistry analysis of HEK293T cells expressing Flag-vector or Flag-ATG2A. Fluorescence and DIC microscopy imaged Flag-vector and Flag-ATG2A beads linked to TAMRA-azide using Cu(I). PA, palmitic acid. Scale bars, 50 µm. The data of statistical analysis is shown as mean ± SEM; n = 30 beads. Student’s t‐test was used to calculate P value, ***P < 0.001. Exact P value: P = 6.30E−28. (E) Detection of S-palmitoylation of Flag-ATG2A in HEK293T cells by ABE assay. Cells were cultured in EBSS, glucose starvation medium, serum starvation medium, or were treated with Torin1. (F) S-palmitoylation of the C-terminal or N-terminal truncated HA-ATG2A mutants in transfected HEK293T cells detected by ABE assay. (G) S-palmitoylation of Flag-ATG2A mutants assessed by ABE assay in HEK293T cells. 3CS: Cys 1704, Cys 1713, and Cys 1714 were substituted with serine. Source data are available online for this figure.
Figure 2
Figure 2. ZDHHC11 mediates the S-palmitoylation of ATG2A.
(A) Screening of ZDHHCs for ATG2A S-palmitoylation. HEK293T cells expressing HA-ATG2A were transfected with specific siRNA targeting each of the ZDHHCs. ABE assays were performed 72 h after transfection. The siRNA for ZDHHC11 is designed to target ZDHHC11 and ZDHHC11B. (B) Co-immunoprecipitation of ZDHHC11 and ZDHHC6 with ATG2A. Flag-ATG2A was immunoprecipitated from HEK293T cells co-transfected with HA-ZDHHC11 or HA-ZDHHC6, and the precipitates were analyzed by Western blot using anti-HA. (C) In vitro pull-down assays detecting the direct binding of ZDHHC11 and ATG2A. Purified Flag-ATG2A was incubated with purified HA-ZDHHC11, and the precipitates were analyzed by Western blot using anti-ATG2A. (D) Co-localization of transiently expressed Cherry-ZDHHC11 and GFP-ATG2A in HeLa cells cultured in complete media. Scale bar, 1 µm. (E) Co-immunoprecipitation analysis of ATG2A and truncated ZDHHC11 mutants. Myc-ZDHHC11 and its truncated mutants were immunoprecipitated from HEK293T cells co-transfected with Flag-ATG2A. The precipitates were analyzed by Western blot using anti-Flag. (F) HA-ATG2A S-palmitoylation in HEK293T cells. Cells expressing HA-ATG2A were incubated with ZDHHC11 siRNA for 72 h. At the 24 h of incubation, Myc-ZDHHC11 or Myc-ZDHHC11-C155S was transfected. The cells were subjected to ABE assay 48 h after transfection. The cDNA of Myc-ZDHHC11 and Myc-ZDHHC11-C155S are siRNA-resistant. (G) ABE assay of HA-ATG2A S-palmitoylation in HEK293T cells with Myc-ZDHHC11 or Myc-ZDHHC11 (∆1-42) expression. (H) S-palmitoylation of HA-ATG2A and HA-ATG2A-3CS in HEK293T cells with or without Myc-ZDHHC11 transfection. Source data are available online for this figure.
Figure 3
Figure 3. APT1 is a depalmitoylase for ATG2A.
(A) Interaction of APT1 and APT2 with ATG2A. Flag-ATG2A was immunoprecipitated from HEK293T cells cultured in complete media and transfected with HA-APT1 or HA-APT2, and then the precipitates were analyzed by Western blot using anti-HA. (B) Pull-down assay of APT1/2-ATG2A binding. Purified Flag-ATG2A was incubated with recombinant GST-APT1 or GST-APT2, and the bound ATG2A was detected by Western blot using anti-ATG2A. (C) Flag-ATG2A S-palmitoylation in HEK293T cells transfected with HA-APT1 or HA-APT2. ABE assay was performed 48 h after transfection. (D) S-palmitoylation of HA-ATG2A in HEK293T cells expressing HA-ATG2A. The cells were incubated with APT siRNAs for 72 h and ABE assay was conducted. (E) HA-ATG2A S-palmitoylation in APT1-KO HEK293T cells expressing HA-ATG2A. The cells were transfected with Myc-APT1 or Myc-APT1-S119A. ABE assay was carried out 48 h after transfection. (F) S-palmitoylation of HA-ATG2A in WT and APT1-KO HEK293T cells expressing HA-ATG2A. The cells were treated with or without EBSS. (G) Co-immunoprecipitation of ZDHHC11 with ATG2A. HA-ATG2A was immunoprecipitated from HA-ATG2A-expressing WT or APT1-KO HEK293T cells transfected with Myc-ZDHHC11 and treated with or without EBSS. The precipitates were analyzed by Western blot using anti-Myc. (H) Statistical analysis of (G). The data are presented as mean ± SEM of three independent experiments. Student’s t‐test was used to calculate P values, **P < 0.01. Exact P values from left to right: P = 0.00137; P = 0.00371. Source data are available online for this figure.
Figure 4
Figure 4. Depalmitoylation of ATG2A is essential for starvation-induced autophagy.
(A) p62 protein levels in HEK293T cells transfected with ZDHHC11 siRNA and treated with or without chloroquine (CQ). (B) Statistical analysis of p62 mRNA levels in HEK293T cells transfected with ZDHHC11 siRNA. (C) p62 proteins levels in HEK293T cells stably expressing HA-ATG2A or HA-ATG2A-3CS. The cells were transfected with Myc-ZDHHC11 or Myc-ZDHHC11-C155S and cultured in EBSS. (D) Representative images of GFP-LC3B in WT or ATG2A/B-DKO NRK cells stably expressing HA-ATG2A or HA-ATG2A-3CS. The cells were transfected with GFP-LC3B and with or without Myc-ZDHHC11. Cells were then cultured in complete media or in EBSS for 4 h. Scale bars, 5 µm. (E) Statistical analysis of the proportion of cells containing large LC3B puncta (diameter > 1.5 μm) in (D). Student’s t‐test was used to calculate P values. Exact P values from left to right: P = 2.71E−06; P = 6.92E−05; P = 0.13493. (F) Representative images of Cherry-GFP-LC3B in WT or ATG2A/B-DKO NRK cells stably expressing HA-ATG2A or HA-ATG2A-3CS. The cells were transfected with Cherry-GFP-LC3B and with or without Myc-ZDHHC11. Cells were then cultured in complete media or in EBSS for 4 h. Scale bars, 5 µm. (G) Statistical analysis of (F). n = 30 cells. Student’s t‐test was used to calculate P values. Exact P values from left to right: P = 1.41E−48; P = 1.26E−31; P = 0.20291. (H) HaloTag Processing assays for evaluating autophagy flux in WT or ATG2A/B-DKO NRK cells stably expressing HA-ATG2A or HA-ATG2A-3CS. The cells were transfected with Halo-LC3B and with or without Myc-ZDHHC11. 48 h post-transfection, cells were pulsed with tetramethylrhodamine (TMR)-conjugated ligands for 20 min in complete media and then cultured in complete media or EBSS for 4 h. (I) p62 protein levels in WT, APT1-KO and APT1-overexpression (APT1-OE) HEK293T cells transfected with or without HA-ZDHHC11 and then treated with or without EBSS. (J) Representative images of GFP-LC3B in WT, APT1-knockdown (APT1-KD) and APT1-overexpression (APT1-OE) NRK cells transfected with or without HA-ZDHHC11 and then treated with or without EBSS. Scale bars, 5 μm. Data information: All statistical data are presented as mean ± SEM of three independent experiments unless otherwise specified. ns, not significant; ***P < 0.001 (Student’s t-test). Source data are available online for this figure.
Figure 5
Figure 5. S-palmitoylation anchors the C-terminal of ATG2A to the ER membrane.
(A) Coomassie blue staining of purified Flag-ATG2A and Flag-ATG2A-3CS. Arrow indicates the band of ATG2A proteins. Asterisk indicates non-specific bands. (B) In vitro lipid transfer assay of Flag-ATG2A and Flag-ATG2A-3CS using liposomes. The data are representative from one of three independent experiments. (C) Western blot analysis of the distribution of the C-terminal of ATG2A in subcellular fractions. ATG2A/2B-DKO NRK cells were transfected with Flag-ATG2A-CT-ΔAH and Flag-ATG2A-CT-3CS-ΔAH. The cells were fractionated and analyzed 48 h after transfection. WCL: whole cell lysate. (D) Statistical analysis of (C). Student’s t‐test was used to calculate P value. Exact P value: P = 0.00072. (E) Representative images showing co-localization of Cherry-ATG2A-CT or Cherry-ATG2A-CT-3CS with GFP-Sec61β. Cherry-ATG2A-CT or Cherry-ATG2A-CT-3CS was co-transfected with GFP-Sec61β in HeLa cells and the cells were imaged 48 h post-transfection. Scale bars, 2 µm. (F) split-spGFP assay in HeLa cells. Cells were transfected with indicated fusion proteins and GFP signal were detected by confocal microscopy. Scale bars, 5 µm. (G) Statistical analysis of (F). n = 30 cells. Student’s t‐test was used to calculate P value. Exact P value: P = 6.31E−27. (H) p62 proteins levels in ATG2A/2B-DKO NRK cells expressing indicated fusion proteins and treated with EBSS for 4 h. (I) Statistical analysis of p62 protein levels in (H). Student’s t‐test was used to calculate P values. Exact P values from left to right: P = 0.00122; P = 0.00047; P = 0.00443. (J) Representative images of transfected Cherry-LC3B in ATG2A/B-DKO NRK cells expressing GFP-ATG2A or GFP-ATG2A-ER. The cells were cultured with EBSS for 4 h. Scale bars, 5 µm. (K) Statistical analysis of the proportion of cells containing large LC3B puncta (diameter > 1.5 μm) in (J). Student’s t‐test was used to calculate P value. Exact P value: P = 6.72E−06. Data information: All statistical data are presented as mean ± SEM of three independent experiments unless otherwise specified. **P < 0.01; ***P < 0.001 (Student’s t-test). Source data are available online for this figure.
Figure 6
Figure 6. Depalmitoylation is necessary for ATG2A’s interaction with phagophores.
(A) Western blot analysis of HA-ATG2A bound to GFP-LC3B membranes from ATG2A/2B-DKO NRK cells stably expressing HA-ATG2A or HA-ATG2A-3CS. The cells were transfected with GFP-LC3B and Myc-ZDHHC11 and treated with EBSS for 4 h. GFP-LC3B membranes were isolated by affinity purification using GFP-TRAP magnetic beads. (B) Statistical analysis of (A). Student’s t‐test was used to calculate P value. Exact P value: P = 0.00121. (C) Representative images showing colocalizations of HA-ATG2A and HA-ATG2A-3CS with GFP-LC3B. ATG2A/2B-DKO NRK cells stably expressing HA-ATG2A or HA-ATG2A-3CS were co-transfected with GFP-LC3B and Myc-ZDHHC11 and cultured in EBSS for 4 h. Scale bars, 5 µm. (D) Statistical analysis of (C). n = 30 cells. Student’s t‐test was used to calculate P value. Exact P value: P = 1.15E−17. (E) Representative images displaying the colocalization of Cherry-ATG2A and Cherry-ATG2A-3CS with GFP-FIP200 in HeLa cells that stably express Myc-ZDHHC11. The cells were treated with EBSS. Scale bars, 5 µm. (F) Statistical analysis of (E). n = 30 cells. Student’s t‐test was used to calculate P value. Exact P value: P = 8.97E−23. (G) Co-immunoprecipitation of ATG9A with ATG2A or ATG2A-3CS. HA-ATG2A and HA-ATG2A-3CS were immunoprecipitated from HEK293T cells co-transfected with Flag-ATG9A. The cells were treated with or without EBSS, and the precipitates were analyzed by Western blot using anti-Flag. (H) Co-immunoprecipitation of WIPI4 with ATG2A. HA-ATG2A, HA-ATG2A-3CS, or HA-ATG2A-mYFS was immunoprecipitated from HEK293T cells cultured in complete media and co-transfected with GFP-WIPI4. The precipitates were analyzed by Western blot using anti-GFP. (I) S-palmitoylation of HA-ATG2A detected by ABE assay in HEK293T cells treated with 1 mM LLOMe for indicated times. (J) Statistical analysis of S-palmitoylation levels for HA-ATG2A in (I). Student’s t‐test was used to calculate P values. Exact P values from left to right: P = 0.46999; P = 0.00088; P = 0.00061; P = 0.00079. (K) Representative images showing GFP-galectin-3 puncta in ATG2A/2B-DKO NRK cells stably expressing HA-ATG2A or HA-ATG2A-3CS. The cells were co-transfected with GFP-galectin-3 and Myc-ZDHHC11, and were treated with 1 mM LLOMe for 2 h. Scale bars, 5 µm. (L) Statistical analysis of (K). n = 30 cells. Student’s t‐test was used to calculate P values. Exact P values from left to right: P = 2.85E−15; P = 0.40442. (M) Schematic Model of ATG2A functioning by its C-terminal depalmitoylation. Under basal conditions, S-palmitoylation of the C-terminal of ATG2A by ZDHHC11 anchors it onto the ER. Upon cell starvation, depalmitoylation allows the C-terminus to be separated from ER membrane and to interact with phagophores. Data information: All statistical data are presented as mean ± SEM of three independent experiments unless otherwise specified. ns, not significant; **P < 0.01; ***P < 0.001 (Student’s t-test). Source data are available online for this figure.
Figure EV1
Figure EV1. Depalmitoylation of ATG2A in starved cells.
(AC) Statistical analysis of S-palmitoylation levels for Flag-ATG2A (A), endogenous ATG2A (B) and HA-ATG2B (C) in Fig. 1A–C. Student’s t‐test was used to calculate P values. Exact P values for (A) from left to right: P = 0.00096; P = 0.00097. Exact P values for (B) from left to right: P = 0.00084; P = 0.00058. Exact P values for (C) from left to right: P = 0.00034; P = 0.00019. (D) Statistical analysis of S-palmitoylation levels for Flag-ATG2A in Fig. 1E. Student’s t‐test was used to calculate P values. Exact P values from left to right: P = 0.00149; P = 0.00164; P = 0.00449; P = 0.00499. (E) Conservation analysis of S-palmitoylation sites in ATG2A across species. (F) S-palmitoylation levels of Flag-ATG2A mutants measured by ABE assay in HEK293T cells. (G) Statistical analysis of (F). Student’s t‐test was used to calculate P values. Exact P values from left to right: P = 0.38347; P = 0.44816; P = 0.40234; P = 0.30211; P = 0.00017; P = 7.48E−05. (H) Statistical analysis of the S-palmitoylation level for Flag-ATG2A mutants in Fig. 1G. Student’s t‐test was used to calculate P values. Exact P values from left to right: P = 3.80E−05; P = 2.24E−05; P = 1.41E−06. Data information: All statistical data are presented as mean ± SEM of three independent experiments. ns, not significant; **P < 0.01; ***P < 0.001 (Student’s t-test). Source data are available online for this figure.
Figure EV2
Figure EV2. ATG2A is S-palmitoylated by ZDHHC11.
(A) qPCR analysis of ZDHHC gene RNAi efficiency in HEK293T cells. qPCR primers for ZDHHC11 are designed to target ZDHHC11 and ZDHHC11B. Student’s t‐test was used to calculate P values. Exact P values from left to right: P = 0.00018; P = 0.00040; P = 4.62E−06; P = 0.00026; P = 0.00096; P = 0.00017; P = 0.00012; P = 0.00012; P = 6.00E−05; P = 3.25E−06; P = 0.00027; P = 0.00064; P = 0.00069; P = 0.00025; P = 2.83E−05; P = 0.00011; P = 8.83E−05; P = 8.22E−05; P = 9.73E−06; P = 0.00122; P = 0.00015; P = 0.00031; P = 0.00011. (B) Co-immunoprecipitation of endogenous ZDHHC11 and ATG2A in HEK293T cells. (C) Representative images showing the localization of GFP-ATG2A, HA-ZDHHC11 and Cherry-Sec61β. GFP-ATG2A, HA-ZDHHC11 and Cherry-Sec61β were transfected in HeLa cells cultured in complete media and the cells were imaged 48 h post-transfection. Scale bars, 2 µm. (D) Representative images showing the localization of GFP-ATG2A, HA-ZDHHC11 and lipid droplets. GFP-ATG2A and Cherry-ZDHHC11 were transfected in HeLa cells cultured in complete media and the cells were stained with Lipi-Blue and imaged 48 h post-transfection. Arrows point to the colocalization sites of ATG2A with LDs. Arrowheads indicate the sites of colocalization between ATG2A and ZDHHC11. Scale bar, 2 µm. (E) Statistical analysis of ratio of Flag-ATG2A to Myc-ZDHHC11 in IP blots for Fig. 2E. Student’s t‐test was used to calculate P values. Exact P values from left to right: P = 0.00021; P = 0.82154; P = 0.77098. (FH) Statistical analysis of the S-palmitoylation level for HA-ATG2A in Fig. 2F–H. Student’s t‐test was used to calculate P values. Exact P values for (F) from left to right: P = 0.00084; P = 1.47E−05; P = 5.63E−06. Exact P values for (G) from left to right: P = 0.00069; P = 0.00014. Exact P values for (H) from left to right: P = 0.00332; P = 0.50351. Data information: All statistical data are presented as mean ± SEM of three independent experiments. ns, not significant; **P < 0.01; ***P < 0.001 (Student’s t-test). Source data are available online for this figure.
Figure EV3
Figure EV3. APT1 is a depalmitoylase of ATG2A.
(A, B) Statistical analysis of the S-palmitoylation level for Flag-ATG2A or HA-ATG2A in Fig. 3C, D. Student’s t‐test was used to calculate P values. Exact P values for (A) from left to right: P = 0.00032; P = 0.00034. Exact P values for (B) from left to right: P = 0.00037; P = 0.00069; P = 0.22506; P = 0.37955. (C) S-palmitoylation of HA-ATG2A in HEK293T cells expressing HA-ATG2A. The cells were treated with specific APT inhibitor. (D) Statistical analysis of (C). Student’s t‐test was used to calculate P values. Exact P values from left to right: P = 0.00107; P = 0.18353; P = 0.00233. (E, F) Statistical analysis of the S-palmitoylation level for HA-ATG2A in Fig. 3E, F. Student’s t‐test was used to calculate P values. Exact P values for (E) from left to right: P = 0.00039; P = 7.69E−05; P = 1.80E−05. Exact P values for (F) from left to right: P = 0.00046; P = 0.00665; P = 0.00576; P = 0.00067. (G) ABE assay of HA-ZDHHC11 S-palmitoylation in HA-ZDHHC11-transfected HEK 293T cells cultured with or without EBSS medium. (H) Statistical analysis of (G). (I) S-palmitoylation of Flag-tagged ZIKV envelope protein and HA-ATG2A in HEK293T cells cultured with or without EBSS medium. (J) Statistical analysis of (I). Student’s t‐test was used to calculate P values. Exact P values from left to right: P = 0.66553; P = 0.00287. (K) Representative images showing the localization of Myc-APT1 in Hela cells with or without EBSS treatment. (L) Co-immunoprecipitation of APT1 with ATG2A. HA-ATG2A was immunoprecipitated from HA-ATG2A-expressing HEK293T cells transfected with Myc-APT1 with or without EBSS treatment. The precipitates were analyzed by Western blot using anti-Myc. Data information: All statistical data are presented as mean ± SEM of three independent experiments. ns, not significant; **P < 0.01; ***P < 0.001 (Student’s t-test). Source data are available online for this figure.
Figure EV4
Figure EV4. Depalmitoylation of ATG2A in starvation-induced autophagy.
(A, B) Statistical analysis of p62 protein levels in Fig. 4A, C. Student’s t‐test was used to calculate P values. Exact P values for (A) from left to right: P = 0.00203; P = 0.00196; P = 0.00150; P = 0.00065; P = 0.00026. Exact P values for (B) from left to right P = 2.23E−05; P = 0.00014; P = 0.00018; P = 0.00050. (C) S-palmitoylation of HA-ATG2A or HA-ATG2A-3CS in ATG2A/2B-DKO NRK cells stably expressing HA-ATG2A or HA-ATG2A-3CS. The cells were transfected with or without Myc-ZDHHC11 and treated with EBSS. (D) Statistical analysis of Fig. 4H. Student’s t‐test was used to calculate P values. Exact P values from left to right: P = 0.00050; P = 0.76680. (E) Statistical analysis of p62 protein levels in Fig. 4I. Student’s t‐test was used to calculate P values. Exact P values from left to right: P = 0.00514; P = 0.06602; P = 0.00209; P = 0.00064. (F) Statistical analysis of the proportion of cells containing large LC3B puncta (diameter > 1.5 μm) in Fig. 4J. Student’s t‐test was used to calculate P values. Exact P values from left to right: P = 0.01556; P = 0.00016; P = 0.00051. Data information: All statistical data are presented as mean ± SEM of three independent experiments. ns, not significant; **P < 0.01; ***P < 0.001 (Student’s t-test). Source data are available online for this figure.
Figure EV5
Figure EV5. S-palmitoylation anchors ATG2A C-terminal to the ER.
(A) Western blot analysis of the distribution of ATG2A and its mutants in subcellular fractions of ATG2A/2B-DKO NRK cells. Cells were transfected with HA-ATG2A, HA-ATG2A-3CS, HA-ATG2A-ΔAH, or HA-ATG2A-3CS-ΔAH. WCL: whole cell lysis. (B) Statistical analysis of (A). (C) Representative images showing the colocalization of Cherry-ATG2A or Cherry-ATG2A-3CS with GFP-Sec61β in HeLa cells. Scale bars, 1 µm. (D) Statistical analysis of (C). n = 30 cells. (E) Co-immunoprecipitation of VMP1 with ATG2A or ATG2A-3CS. HA-ATG2A or HA-ATG2A-3CS was immunoprecipitated from HEK293T cells co-transfected with Myc-VMP1. The cells were treated with or without EBSS, and the precipitates were analyzed by Western blot using anti-Myc. (F) Representative images showing the colocalization of GFP-ATG2A-ER and Cherry-Sec61β in HeLa cells. Scale bar, 2 µm. Data information: All statistical data are presented as mean ± SEM of three independent experiments unless otherwise specified. ns, not significant (Student’s t-test). Source data are available online for this figure.

References

    1. Aits S, Kricker J, Liu B, Ellegaard AM, Hämälistö S, Tvingsholm S, Corcelle-Termeau E, Høgh S, Farkas T, Holm Jonassen A et al (2015) Sensitive detection of lysosomal membrane permeabilization by lysosomal galectin puncta assay. Autophagy 11:1408–1424 - PMC - PubMed
    1. Broadbent DG, Barnaba C, Perez GI, Schmidt JC (2023) Quantitative analysis of autophagy reveals the role of ATG9 and ATG2 in autophagosome formation. J Cell Biol 222:e202210078 - PMC - PubMed
    1. Chamberlain LH, Shipston MJ (2015) The physiology of protein S-acylation. Physiol Rev 95:341–376 - PMC - PubMed
    1. Chen S, Zhu B, Yin C, Liu W, Han C, Chen B, Liu T, Li X, Chen X, Li C et al (2017) Palmitoylation-dependent activation of MC1R prevents melanomagenesis. Nature 549:399–403 - PMC - PubMed
    1. Chowdhury S, Otomo C, Leitner A, Ohashi K, Aebersold R, Lander GC, Otomo T (2018) Insights into autophagosome biogenesis from structural and biochemical analyses of the ATG2A-WIPI4 complex. Proc Natl Acad Sci USA 115:E9792–E9801 - PMC - PubMed

MeSH terms

LinkOut - more resources