. 2025 May;28(5):1012-1023.
doi: 10.1038/s41593-025-01921-6. Epub 2025 Mar 24.

Neural ensembles that encode nocifensive mechanical and heat pain in mouse spinal cord

Affiliations

Neural ensembles that encode nocifensive mechanical and heat pain in mouse spinal cord

Ming-Dong Zhang et al. Nat Neurosci. 2025 May.

Abstract

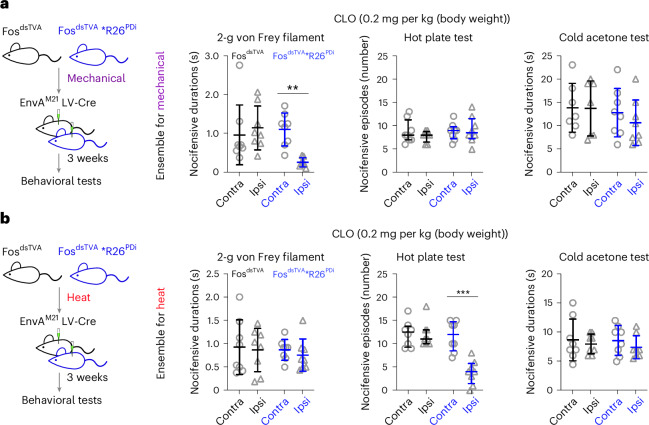
Acute pain is an unpleasant experience caused by noxious stimuli. How the spinal neural circuits attribute differences in quality of noxious information remains unknown. By means of genetic capturing, activity manipulation and single-cell RNA sequencing, we identified distinct neural ensembles in the adult mouse spinal cord encoding mechanical and heat pain. Reactivation or silencing of these ensembles potentiated or stopped, respectively, paw shaking, lifting and licking within but not across the stimuli modalities. Within ensembles, polymodal Gal+ inhibitory neurons with monosynaptic contacts to A-fiber sensory neurons gated pain transmission independent of modality. Peripheral nerve injury led to inferred microglia-driven inflammation and an ensemble transition with decreased recruitment of Gal+ inhibitory neurons and increased excitatory drive. Forced activation of Gal+ neurons reversed hypersensitivity associated with neuropathy. Our results reveal the existence of a spinal representation that forms the neural basis of the discriminative and defensive qualities of acute pain, and these neurons are under the control of a shared feed-forward inhibition.


Conflict of interest statement

Competing interests: The authors declare no competing interests.

Figures

Fig. 1
Fig. 1. Capturing ensembles encoding mechanical and heat pain in the spinal dorsal horn.
a, Left: representative images of c-Fos and PKCγ immunohistochemistry in the medial spinal dorsal horn after noxious stimulations. Right: auantification of c-Fos expression is shown (n = 6 mice). b, Left: colocalization of destabilized TVA and c-Fos in the spinal cord of FosdsTVA*R26Tom mice induced by skin incision and/or nerve injury. Right: colocalization between c-Fos and TVA neurons was quantified (n = 6 mice). Arrowheads indicate colocalization. c, Schematic of the validation experiment for the same type of stimulus; LV-Cre, lenti-Cre virus. d, Representative immunohistochemical images show ensembles activated and labeled with Tomato (Tom) and c-Fos in the spinal dorsal horn as illustrated in c (n = 3 mice per group). Right: high-magnification images from the dashed white boxes show the colocalization indicated by the arrowheads. e, Left: schematic of the gain-of-function study of ensembles infected with AAV9/2-DIO-hM3D(Gq) through treatment with subthreshold clozapine (CLO) combined with application of a peripheral stimulus; i.p., intraperitoneal; Mech, mechanical. Right, nocifensive durations/episodes for the 1-g von Frey filament test and hot plate test (46 °C) and withdrawal latency for the cold plantar assay under subthreshold activation of mechanical or heat ensembles (n = 5 for mechanical and n = 5 for heat); Con, FosdsTVA mice (n = 5) injected with virus without stimulation; C57, wild-type mice (n = 4); Contra, contralateral; Ipsi, ipsilateral; scale bars, 100 μm in a and d and 25 μm in b and magnified image in d. Data are expressed as mean ± s.d. Differences between contralateral and ipsilateral sides from the different groups were analyzed by ordinary one-way analysis of variance (ANOVA), followed by a Bonferroni multiple comparisons test (adjusted P < 0.0001 for both mechanical and heat groups in a; adjusted P values from left: P > 0.9999, P > 0.9999, P < 0.0001 and P > 0.9999 for the 1-g von Frey filament test and P > 0.9999, P= 0.3161, P > 0.9999 and P > 0.9999 for the cold plantar test in e). The nocifensive episodes for the hot plate test in e are presented as median with interquartile range, and differences between contralateral and ipsilateral sides from each group were analyzed by Mann–Whitney test (two-tailed P values from left: P = 0.5714, P= 0.2063, P > 0.9999 and P= 0.0079); ***P < 0.001 and **P < 0.01. Source data
Fig. 2
Fig. 2. Chemogenetic inhibition of ensembles encoding mechanical and heat pain in the spinal cord.
a,b, Experimental paradigm for chemogenetic inhibition of ensembles that encode mechanical pain (a) and heat pain (b) in the spinal dorsal horn with intraspinal-injected pseudotyped EnvAM21 lenti-Cre virus in FosdsTVA*R26PDi and FosdsTVA (control) mice (n = 32 mice, 8 mice per group). Nocifensive behavior (durations or episodes) was assessed with a 2-g von Frey filament test (mechanical), hot plate test (heat; 50 °C) and cold acetone test (cold) 60 min after intraperitoneal administration of clozapine (0.2 mg per kg (body weight)); Contra, contralateral; Ipsi, ipsilateral. Data are expressed as mean ± s.d. for nocifensive durations and median with interquartile range for nocifensive episodes. Nocifensive duration differences between contralateral and ipsilateral sides from different groups were analyzed by ordinary one-way ANOVA followed by a Bonferroni multiple comparisons test (adjusted P values from left in a: P = 0.9971 and P= 0.0067 for the 2-g von Frey filament test and P > 0.9999 and P > 0.9999 for the cold acetone test; adjusted P values from left in b: P > 0.9999 and P > 0.9999 for the 2-g von Frey filament test and P > 0.9999 and P > 0.9999 for the cold acetone test). The nocifensive episode differences between contralateral and ipsilateral sides from each group were analyzed by Mann–Whitney test (two-tailed; P = 0.6908 for FosdsTVA and P = 0.938 for FosdsTVA*R26PDi in a and P = 0.9764 for FosdsTVA and P = 0.0005 for FosdsTVA*R26PDi in b); ***P < 0.001 and **P < 0.01. Source data
Fig. 3
Fig. 3. Decoding ensembles encoding mechanical and heat pain with scRNA-seq.
a, Uniform manifold approximation and projection (UMAP) composed of the scRNA-seq data from 18,590 spinal dorsal horn neurons from adult mice (BAF53b-Cre*R26Tom, 12–20 weeks old, n = 8 mice) representing 27 clusters with 10 inhibitory (In1–In9 and In18) and 17 excitatory (Ex10–Ex17 and Ex19–Ex27) cell types in the adult spinal neuronal reference atlas. b, Top: experimental paradigm for scRNA-seq of ensembles encoding mechanical and heat pain. Bottom: sequenced neurons from control, mechanical and heat ensembles were plotted on the reference atlas by label transfer (n = 32 mice, including 8 mice for control ensembles, 12 mice for mechanical ensembles and 12 mice for heat ensembles). Modality-specific or shared cell types are highlighted with circles. c, Percentages of cell types from mechanical and heat ensembles derived from b were plotted for comparison (n = 4 mice per group, three groups per condition). Shades of gray highlight modality-specific cell types (scCODA, false discovery rate < 0.2). For the box plots, the center line represents the median, the box limits represent the top and bottom quartiles, and the whiskers represent the minimum and maximum. d, Dot plot of the expression of marker genes for excitatory neurons (Slc17a6 (vGLUT2)), inhibitory neurons (Slc32a1 (VGAT)), projection neurons (Gpr83 and Tacr1) and specific cell types (Pou4f1 (Ex19/Ex16), Tac1 (Ex21/Ex22), Crhbp (Ex25/Ex27) and Gal (In8)). e, Representative images showing mRNA coexpression of Tac1, Pou4f1, Tacr1 or Crhbp with Fos in the medial spinal dorsal horn from mice subjected to mechanical or heat stimulation (n = 4 or 5 mice for mechanical stimulation and 4 mice for heat stimulation). DAPI was used as a nuclear counterstain. Arrowheads indicate colocalization; scale bar, 50 μm; D, dorsal; M, medial; L, lateral; V, ventral. Source data
Fig. 4
Fig. 4. Spinal ensembles transition from nociceptive to chronic pain.
a, UMAP composed of 28,195 cells sequenced by scRNA-seq (n = 4 control mice and n = 4 SNI mice; 6 weeks). b, UMAP showing neuronal cell types of 17,229 neurons (left) from both SNI (11,234) and control (5,995) conditions (right). c, Numbers of genes regulated by SNI (SNI versus control) for each cell type by pseudobulk analysis are listed. Genes with a log2(fold change) of >0.59 or <–1.0 and adjusted P value of <0.01 were counted as regulated by SNI. d, Heat map of immediate early genes (g) related regulon activities in neuronal cell types from control and SNI mice from SCENIC analysis. e, Violin plot showing Fos expression in control and SNI mice in all neuronal cell types. f, Representative image of Fos expression in the contralateral and ipsilateral spinal dorsal horn after SNI (n = 4 mice). DAPI was used as a counterstain; scale bar, 100 μm. g, Experimental paradigm for the role of mechanical and heat ensembles in neuropathic pain. h,i, Nocifensive durations for the 2-g von Frey filament test, heat test and acetone test and withdrawal thresholds for von Frey filaments were recorded to assess the effects of inhibition of mechanical and heat ensembles by clozapine after SNI (n = 24 mice, 6 mice per group). Data are expressed as mean ± s.d. or median with interquartile range (withdrawal threshold data for von Frey filaments). Differences between contralateral and ipsilateral sides within the group were analyzed by ordinary one-way ANOVA followed by a Bonferroni multiple comparisons test (adjusted P values from left: P < 0.0001, P < 0.0001, P= 0.0042, P= 0.0014, P= 0.0002 and P= 0.0002 in h and P < 0.0001, P < 0.0001, P= 0.0001, P= 0.0002, P < 0.0001 and P < 0.0001 in i). The differences in withdrawal threshold for von Frey filaments between contralateral and ipsilateral sides from each group were analyzed by Mann–Whitney test (two-tailed; P = 0.0022 for FosdsTVA and P = 0.0022 for FosdsTVA*R26PDi in h and P = 0.0022 for FosdsTVA and P= 0.0022 for FosdsTVA*R26PDi in i); ***P < 0.001 and **P < 0.01. Source data
Fig. 5
Fig. 5. Gal+ In8 neurons modulate nociceptive pain.
a, Top: Gal and Prkcg expression in the mouse dorsal horn. Bottom: mCherry and PKCγ expression in the spinal dorsal horn of Gal-Cre mice injected with AAV9/2-DIO-mCherry; n = 4 mice per experiment. b, Experimental paradigm for the gain-of-function study of Gal+ In8 neurons (c and d); WT, wild-type. c,d, von Frey filament and 2-g von Frey filament tests (c) as well as a Hargreaves test and hot plate test (d) were assessed; n = 8 wild-type and 12 Gal-Cre mice. e, Experimental paradigm for the loss-of-function study of Gal+ In8 neurons. f,g, The same tests were assessed as in c (f) and d (g); n = 7 wild-type and 6 Gal-Cre mice and 5 mice per group in the hot plate test. h, Experimental paradigm for monosynaptic retrograde tracing from spinal Gal+ neurons to DRG neurons. i, Retrograde-traced DRG neurons were labeled with mCherry in Gal-Cre and wild-type mice (n = 2 mice per group). j, Identification of traced mCherry+ DRG neurons with RNAscope probes (n = 2 mice). Arrow indicates triple labeling, and arrowheads indicate double labeling. k, Summary for identified traced neurons with DRG neuronal subtype marker genes in Gal-Cre and NPY-Cre mice. Some traced neurons could not be assigned with the probes used here. DAPI was used as a counterstain; scale bars, 100 μm (a and i) and 50 μm (j). Data are expressed as mean ± s.d., whereas nocifensive episodes and withdrawal threshold are expressed as median with interquartile range. Differences between wild-type and Gal-Cre mice in c, d, f and g and clozapine were analyzed by ordinary one-way ANOVA followed by a Bonferroni multiple comparisons test, whereas the nonparametric data were analyzed by Kruskal–Wallis test and followed by a Dunn’s multiple comparison test. Adjusted P values from left: P > 0.9999, P= 0.0069, P= 0.8541 and P= 0.0292 (c); P > 0.9999, P= 0.9555, P > 0.9999 and P= 0.0011 (d); P= 0.6666, P= 0.0085, P > 0.9999 and P= 0.0304 (f); and P= 0.9925, P= 0.4638, P > 0.9999 and P= 0.0177 (g); **P < 0.01 and *P < 0.05; NS, not significant. Source data
Fig. 6
Fig. 6. Role of Gal+ In8 neurons in neuropathic pain.
a,b, Colocalization of Fos+ and Gal+ neurons in the spinal dorsal horn after mechanical (M; n = 4 mice per group; a) or heat stimulation (H; n = 4 mice per group; b). Arrowheads indicate neurons showing colocalization of Fos and Gal. Right: quantification for the percentage of Gal+ neurons that were Fos+ is plotted. Differences between control and SNI mice with stimulation were analyzed by unpaired, two-tailed t-test (P = 0.0291 in a and P = 0.0026 in b). c, Experimental paradigm for the effect of gain of function for Gal+ In8 neurons in SNI-induced chronic pain. d, Withdrawal threshold for mechanical and nocifensive durations for noxious mechanical tests on SNI mice with activation of Gal+ neurons. e, Withdrawal threshold for Hargreaves and nocifensive durations for noxious heat tests on SNI mice with activation of Gal+ neurons. These SNI mice were the same as in Fig. 5b–d, and the basal thresholds (BT) were the same values as those before clozapine treatment for the same tests. DAPI was used as a counterstain (a and b); scale bars, 50 μm. Data are expressed as mean ± s.d., whereas withdrawal threshold is expressed as median with interquartile range. Differences in the effects of clozapine in SNI mice between wild-type and Gal-Cre mice (d and e) were analyzed by ordinary one-way ANOVA followed by a Bonferroni multiple comparisons test, whereas the withdrawal threshold was analyzed by Kruskal–Wallis test followed by a Dunn’s multiple comparison test. Adjusted P values from left: P > 0.9999, P > 0.9999 and P= 0.0418 for the von Frey filaments test and P > 0.9999, P > 0.9999 and P < 0.0001 for the 2-g von Frey filament test in d and P > 0.9999, P > 0.9999 and P= 0.6952 for the Hargreaves test and P > 0.9999, P= 0.8136 and P < 0.0001 for the heat test in e; ***P < 0.001, **P < 0.01 and *P < 0.05. Source data
Extended Data Fig. 1
Extended Data Fig. 1. Fos activation, specificity of FosdsTVA mice and modulation of active neurons labelled by Fos expression.
a, Representative images of Fos mRNA in spinal dorsal horn induced by noxious stimuli and quantification for Fos+ neurons (n = 5 for mechanical and 4 for heat). Cc, central canal. b, Representative images of co-expression between c-Fos and TVA in hippocampus and hypothalamus from FosdsTVA mice (n = 2) counterstained with propidium iodide (PI). High magnification images show dentate gyrus (DG) and supraoptic nucleus (SON) from the insets. GrDG, granule cell layer of DG; MoDG, molecular DG; D3V, dorsal 3rd ventricle; opt, optic tract; PVN, paraventricular nucleus of hypothalamus. Arrowheads indicate co-localization. c, Representative images show a limited off-target labeling (Tom) of EnvAM21 lenti-Cre virus along injection tract induced by surgery (n = 2). d, In control R26Tom mice pairing Tomato (1st stimulus) and c-Fos (2nd stimulus) revealed no Tom+ signal (n = 2). e, Representative images examining in FosdsTVA*R26Tom mice Cre expression in Tom+ cells following heat stimulus (n = 4). f, Left, schematic diagram for the functional study of gain of function for ensembles infected by AAV9/2-DIO-hM3D(Gq) virus. Right, 1g von Frey filament test, hot plate test (46°C) and cold plantar assay under subthreshold activation of mechanical or heat ensembles (0.04 mg/kg clozapine, n = 19). Con: FosdsTVA mice injected virus without stimulation; C57: wild type mice; Contra-: contralateral; Ipsi-: ipsilateral. DAPI was used as a counterstaining. Scale bars = 100 μm in (a, c and d), 200 μm for the overview and 20 μm for high magnification in (b), 100 μm the overview and 20 μm for the inset in (e). Data are expressed as mean ± SD. Differences between contra- and ipsi- from different groups were analyzed by ordinary one-way ANOVA followed by Bonferroni’s multiple comparisons test (a, f). Adjusted P < 0.0001 for both stimulations in (a), values from left > 0.9999, 0.7309, < 0.0001 and 0.7309 for 1g von Frey filament, > 0.9999, > 0.9999, > 0.9999 and 0.0397 for hot plate test, > 0.9999, 0.5146, > 0.9999 and 0.0026 for Hargreaves test in (f). *** indicates P < 0.001, ** indicates P < 0.01 and * indicates P < 0.05. Source data
Extended Data Fig. 2
Extended Data Fig. 2. Inhibition of ensembles coding for mechanical or heat pain in spinal cord with chemogenetics or ablation of ensembles for heat with R26DTA mice.
Spinal ensembles were captured with EnvAM21 lenti-Cre virus in FosdsTVA*R26PDi mice (a and b). a, 2g von Frey filament test at different time points after application of clozapine (i.p.). Saline was used as the vehicle after 1.0 hr injection. Von Frey filaments test (non-noxious mechanical), Hargreaves test (thermo test) and acetone test (non-noxious cold/cool) were assessed after 60 min of application of clozapine (n = 16 mice, 8 mice/group, FosdsTVA mice as controls). Some tests only included 7 control mice. BT, basal threshold. b, Heat stimulation was assessed with hot plate test at different time points after application of clozapine (saline as vehicle, n = 16 mice, 8 mice/group). Von Frey filaments test, Hargreaves test and acetone test were assessed as in (a). c, Left: schematic diagram for ablation of spinal heat ensemble. Right: hot plate test (50°C), Hargreaves test and von Frey filaments test were assessed (n = 14 mice, 7 mice/group). Hargreaves test only used 6 mice from each group. d, Left: illustration of nocifensive responses and nocifensive episodes. Right: quantification of individual nocifensive response component and sum of the responses for hot plate test in (c). Data for durations and latency are expressed as mean ± SD and the rest are expressed as median with interquartile range. Differences of parametric data for different time points from ipsilateral and differences between contra- and ipsi- within the group were analyzed by ordinary one-way ANOVA followed by Bonferroni’s multiple comparisons test. The differences for nonparametric data between contra- and ipsi- from each group or ipsi- sides from different groups were analyzed by Mann-Whitney test (two-tailed). Adjusted P values from left 0.9321, 0.6483, > 0.9999 for FosdsTVA mice and 0.0004, 0.0052, > 0.9999 for FosdsTVA*R26PDi mice (time points, a), 0.7734 and > 0.9999 for vehicle (a), P = 0.4779 and 0.6623 for von Frey filaments, adjusted P values 0.4333 and > 0.9999 for Hargreaves, > 0.9999 and 0.1148 for acetone test (a). Adjusted P > 0.9999 from different time points for FosdsTVA mice and 0.003, > 0.9999, > 0.9999 for FosdsTVA*R26PDi mice (b), > 0.9999 and > 0.9999 for vehicle (b), P = 0.8591 and 0.6291 for von Frey filaments, adjusted P values 0.7114 and > 0.9999 for Hargreaves, 0.8920 and > 0.9999 for acetone test (b). P = 0.8328 for control, 0.0012 for mice with stimulation and 0.0076 between ipsilateral sides for hot plate test (c), adjusted P values from left > 0.9999, 0.3321, 0.3287 and 0.6358 for Hargreaves and von Frey filaments (c). P = 0.7855 for control mice, 0.0006 for mice with stimulation and 0.0047 between ipsilateral sides for shaking numbers (d), P = 0.204, 0.4167 and 0.5921 for lifting numbers, P = 0.8217, 0.3473 and 0.8013 for licking numbers, P = 0.5798, 0.0012 and 0.0105 for summed numbers (d). *** indicates P < 0.001, ** indicates P < 0.01, * indicates P < 0.05 and n.s. means no significance. Source data
Extended Data Fig. 3
Extended Data Fig. 3. Expression of cluster marker genes of spinal dorsal horn neuronal atlas and comparison with Häring’s annotation.
a, Dot Plot of top 5 genes for each cluster of the atlas. b, Heatmap of prediction of neurons from current atlas dataset with scPred to their known identity in the atlas. c, Heatmap of prediction of Häring’s dataset to current atlas annotation with scPred. d, UMAP of neurons from current atlas with predicted Häring’s annotation by Seurat label transfer.
Extended Data Fig. 4
Extended Data Fig. 4. Expression of marker genes in mouse spinal dorsal horn, co-localization with Fos stimulated by mechanical or heat and retrograde labeling from lateral parabrachial nucleus.
a, Representative images of Tac1, Pou4f1, Tacr1, Crhbp and Gal expression in mouse lumbar 4/5 spinal dorsal horn (n = 4 mice). DAPI was used as a counterstaining. Scale bar = 100 μm. M, medial; L, lateral; D, dorsal; V, ventral. b, Quantification for the percentage of Fos+ neurons that are Tac1, Pou4f1, Tacr1 or Crhbp positive in spinal dorsal horn with mechanical or heat stimulation (n = 4 or 5 mice/group). Data are expressed as mean ± SD. Differences between the stimuli were analyzed by unpaired t test (two-tailed, P values in order 0.0018, 0.0454, 0.0008 and 0.0942). *** indicates P < 0.001, ** indicates P < 0.01, * indicates P < 0.05, and n.s. means no significance. c, Experimental paradigm for retrograde labeling of spinal Gal+ neurons from lateral parabrachial nucleus. d, Left: representative projection image (12 μm) of spinal dorsal horn showing non-overlapping between Gal+ neurons (mCherry) and retrogradely labeled spinal parabrachial (SPB) projection neurons (CTb-488/green and CTb antibody/white) indicated by numeric numbers. Right: high magnification of SPB projection neurons and Gal+ neurons indicated by asterisks. Scale bars: 100 μm for the left and 20 μm for the inset. e, Representative projection images of spinal dorsal horn showing overlapping between retrogradely labeled SPB projection neurons and Tacr1+ neurons (left, 8 μm projection) or Tac1+ neurons (right, 10 μm projection) as indicated by arrowheads. Scale bar: 25 μm. n = 4 mice for (d) and (e). Source data
Extended Data Fig. 5
Extended Data Fig. 5. Single nucleus RNA sequencing of spinal cord from mice with noxious heat stimulation.
a, Experimental paradigm for single nucleus RNA sequencing (snRNA-seq) of NeuN+ nuclei from mouse spinal cord after noxious heat stimulation. b, Violin plots showing neuronal nuclei passed quality control from control and heat samples. The medians were added on top of the plots. c, UMAP for spinal neuronal nuclei cell types from control and heat stimulated samples (12,818 nuclei). d, Feature plots for Fos expression in control (4,745 nuclei) and heat stimulated (8,073 nuclei) samples. Clusters 20 and 27 were unique in heat stimulated samples. e, UMAP for the neuronal nuclei dataset with predicted cell types defined in the current study with scPred. f, Violin plots showing Fos expression based on cell types between control and heat stimulated samples.
Extended Data Fig. 6
Extended Data Fig. 6. Effects of sni on neuronal cell types in mouse spinal dorsal horn.
a, Effect of sni on the size (proportion) of neuronal cell types in mouse spinal dorsal horn. Con, control. b, Left: Perturbation analysis of sni on neuronal subtypes in spinal dorsal horn with Augur method. Right: Perturbation analysis on neuronal subtypes from a randomly selected control sample as negative control was also included. c, Enriched regulons for spinal dorsal horn neuronal cell types from control and sni mice by SCENIC analysis. d, Violin plot of module score for the list of genes from Fos regulon (166 g) in neuronal cell types from control and sni. e, Quantification of mean signal intensity for Fos mRNA (subtracted background, n = 4 mice). Data are expressed as mean ± SD. Differences between the stimuli were analyzed by unpaired t test (two-tailed, P = 0.0007). *** indicates P < 0.001. Source data
Extended Data Fig. 7
Extended Data Fig. 7. Effects of sni on neuronal cell types in mouse spinal dorsal horn from snRNA-seq.
a, Violin plots showing neuronal nuclei passed quality control from control and sni samples (4,160 nuclei each). Only protein-coding genes were included. The medians were added on top of the plots. There were 12,428 nuclei from control samples passed quality control and down sampled to 4,160 nuclei for comparison with sni sample. b, Violin plots showing Fos, Slc12a5 and Bdnf gene expression between con and sni samples. c, Violin plots showing Fos expression based on predicated cell types in the current study between con and sni samples. d, Violin plots showing Fos module score based on cell types between con and sni samples. e, Violin plots showing neuronal cells passed quality control from control and sni samples (5,995 cells each). The medians were added on top of the plots. Protein-coding genes (not Y chromosome) were included for the analysis here. f, Violin plots showing Fos, Slc12a5 and Bdnf gene expression between con and sni samples from scRNA-seq.
Extended Data Fig. 8
Extended Data Fig. 8. Effects of sni on Aif1+ cells in mouse spinal dorsal horn.
a, UMAP plot shows 5 clusters of Aif1+ cells (1,368 cells) from spinal cord of control mice. b, Heatmap shows top 10 differently expressed genes (avg_logFC) for each cluster. c, RNA velocity shows microglia activation tracjectory. Although cells of cluster 5 are Aif1+, they are border associated macrophages (BAM) according to specifically expressed genes in (b). d, UMAP plot shows the annotation of Aif1+ glia cells (M0, resting microglia; M1, activated microglia) according to top differently expressed genes, RNA velocity analysis and literature. e, Heatmap shows top 10 differently expressed genes enriched based on the newly annotated glial subtypes (M0, M1 and BAM). f, UMAP plots show the composition of glial cells from control and sni mice. g, Stacked bar plot shows proportion of different glial cell types from control (1,368 cells) and sni (969 cells) mice. h, Heatmap shows top 10 differently expressed genes from BAM, M0 and M1 cell types under control and sni conditions. Only 950 glial cells from each sample were included for visualization by down sampling. i, Heatmap of regulon activity enriched for glial cell types. j, Volcano plot shows sni induced regulated genes BAMs. Dashed line circle indicates genes coding for ribosomal proteins. k, Gene ontology analysis revealed sni regulated genes in BAMs were mainly involved in protein translation and immune response processes. l, Volcano plot shows sni induced regulated genes in resting microglia (M0). m, Volcano plot shows sni induced regulated genes in activated microglia (M1). Pro-inflammatory cytokine genes Ccl3, Ccl4, Il1b and Il6 or anti-inflammatory cytokine gene Il10 were indicated with arrows in (l and m). Genes plotted in j-m were analyzed with DESeq2 with absolute log2FoldChange > 0.3 and P < 1.0×10⁻⁵ (colored in red).
Extended Data Fig. 9
Extended Data Fig. 9. Effects of sni on oligodendrocytes and astrocytes in mouse spinal dorsal horn.
a, UMAP plot shows different cell subtypes along oligodendrocyte lineage from mouse spinal cord based on selected markers of Marques’s 2016 annotation. OPC, oligodendrocyte precursor cells; COP, differentiation-committed oligodendrocyte precursors; NFOL, newly formed oligodendrocytes; MFOL, myelin-forming oligodendrocytes; MOL, mature oligodendrocytes. b, Heatmap shows top 10 differently expressed genes (avg_logFC) for different oligodendrocyte subtypes. c, Feature plots show selected marker genes for different oligodendrocyte subtypes. d, Stacked bar plot shows the population sizes of different oligodendrocyte subtypes. e, UMAP plots show oligodendrocytes subtypes from spinal cord of control mice (4,750 cells) and mice with sni (3,719 cells). f, Stacked bar plot shows the population sizes of different oligodendrocyte subtypes from con and sni conditions. g, Left: UMAP plot shows 2 clusters of Sox9+ cells (116 cells) from spinal cord of control and sni mice. Right: Violin plots show Agt and Ntsr2 are specifically expressed in astrocytes, whereas Dynlrb2 and Cfap54 are limited to ciliated epithelial cells (ependymal cells). Fos is highly expressed in ciliated epithelial cells, like CSF contacting neurons (In1, Fig. 4e). h, UMAP plots show astrocytes and ciliated epithelial cells from spinal cord of control mice (74 cells) and mice with sni (32 cells). i, Volcano plot shows sni induced gene expression in astrocytes analyzed by DESeq2 with absolute log2FoldChange > 0.3 and P < 1.0 × 10⁻⁵ (colored in red).
Extended Data Fig. 10
Extended Data Fig. 10. Identification of retrograde traced DRG neurons projecting to spinal Gal+ and Npy+ neurons.
a, Representative image for Slc17a6, Gal and Cre in spinal dorsal horn from Gal-Cre mice (n = 3). High magnification images show co-localization of Gal and Cre from the inset. The asterisk indicated a triple labeled neuron. b, Identification of traced mCherry+ DRG neurons with genes covering DRG neuronal subtypes. c, Violin plots showing Npy and Gal expression in spinal cord. d, Validation of Npy-Cre*R26Tom mice in spinal cord with RNAscope. The percentage of Npy+ neurons that were tdTomato+ was 77 ± 7.7% for Npy-Cre mice and 1.1 ± 1.6% for WT mice (n = 2 mice/group). Npy+ neurons barely co-localized with Slc17a6 (0.5 ± 0.8%). The plotted dots stand for tissue sections. e, Experimental paradigm for monosynaptic tracing of spinal Npy+ neurons from DRGs. f, Traced DRG neurons were labelled with mCherry in Npy-Cre mice, but not in WT mice (n = 2 mice/group). g, Identification of traced mCherry+ DRG neurons as summarized in Fig. 5k. h, Quantification of Fos mRNA in spinal dorsal horn (n = 4 mice/group). con: contralateral, sni+M: sni with mechanical stimulation, sni+H: sni with heat stimulation. The sni data was also presented in Extended Data Fig. 6e. i, Experimental paradigm for chemogenetic silencing of Gal+ neurons in Gal-Cre mice with sni. j, Behavioral tests of von-Frey filaments and 2g von-Frey filament on sni mice with silenced spinal Gal+ neurons. k, Behavioral tests of Hargreaves and heat on sni mice with silenced spinal Gal+ neurons. n = 7 for WT and n = 6 for Gal-Cre mice in (j and k). Arrows indicate triple labelling and arrowheads indicate double labelling. Scale bars = 20 μm in (a), 5 μm for the inset from (a), 25 μm in (b, d, g) and 100 μm in (f). Data are expressed as mean ± SD, while withdrawal threshold is expressed as median with interquartile range. Fos intensity was analyzed by unpaired t test (two-tailed, P values from left 0.0007, 0.0004 and 0.0007. Differences for clozapine under sni condition between WT and Gal-Cre mice were analyzed by ordinary one-way ANOVA followed by Bonferroni’s multiple comparisons test, and withdrawal threshold was analyzed by Kruskal-Wallis test and followed by Dunn’s multiple comparison test. Adjusted P values from left > 0.9999, > 0.9999 and 0.2822 for von Frey filaments test, > 0.9999, > 0.9999 and 0.0005 for 2g von Frey filament test in (j), Adjusted P > 0.9999 for Hargreaves and heat tests between WT and Gal-Cre mice at BT, after sni and sni + CLO (k). *** indicates P < 0.001. Source data

References

    1. Koch, S. C., Acton, D. & Goulding, M. Spinal circuits for touch, pain, and itch. Annu. Rev. Physiol.80, 189–217 (2018). - PMC - PubMed
    1. Ma, Q. Labeled lines meet and talk: population coding of somatic sensations. J. Clin. Invest.120, 3773–3778 (2010). - PMC - PubMed
    1. Prescott, S. A., Ma, Q. & De Koninck, Y. Normal and abnormal coding of somatosensory stimuli causing pain. Nat. Neurosci.17, 183–191 (2014). - PMC - PubMed
    1. Bester, H., Chapman, V., Besson, J. M. & Bernard, J. F. Physiological properties of the lamina I spinoparabrachial neurons in the rat. J. Neurophysiol.83, 2239–2259 (2000). - PubMed
    1. Hachisuka, J. et al. Semi-intact ex vivo approach to investigate spinal somatosensory circuits. eLife5, e22866 (2016). - PMC - PubMed

LinkOut - more resources