. 2025 May;26(9):2262-2279.
doi: 10.1038/s44319-025-00427-3. Epub 2025 Mar 24.

Induction of a transcriptional adaptation response by RNA destabilization events

Affiliations

Induction of a transcriptional adaptation response by RNA destabilization events

Lihan Xie et al. EMBO Rep. 2025 May.

Abstract

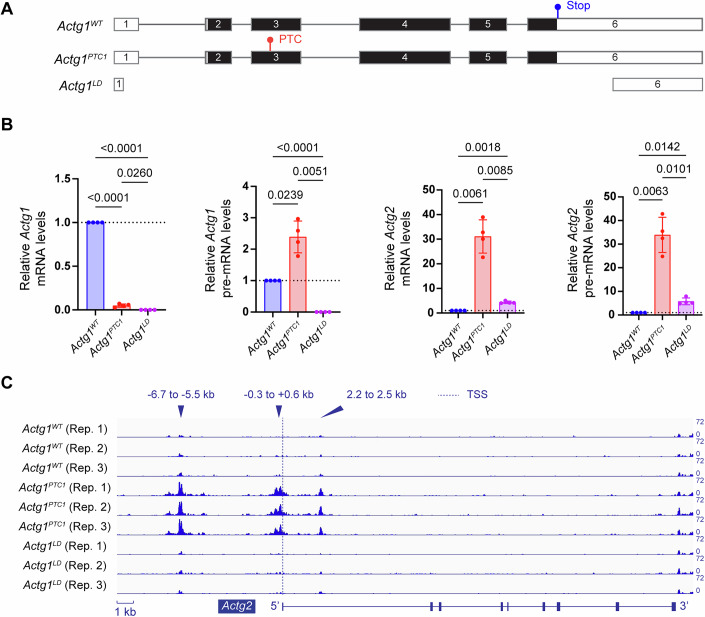
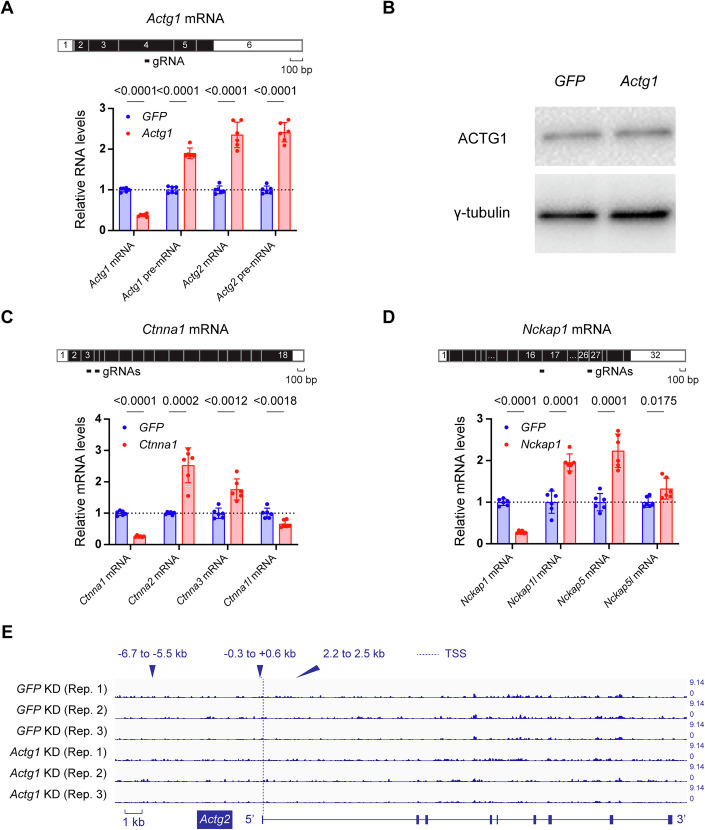
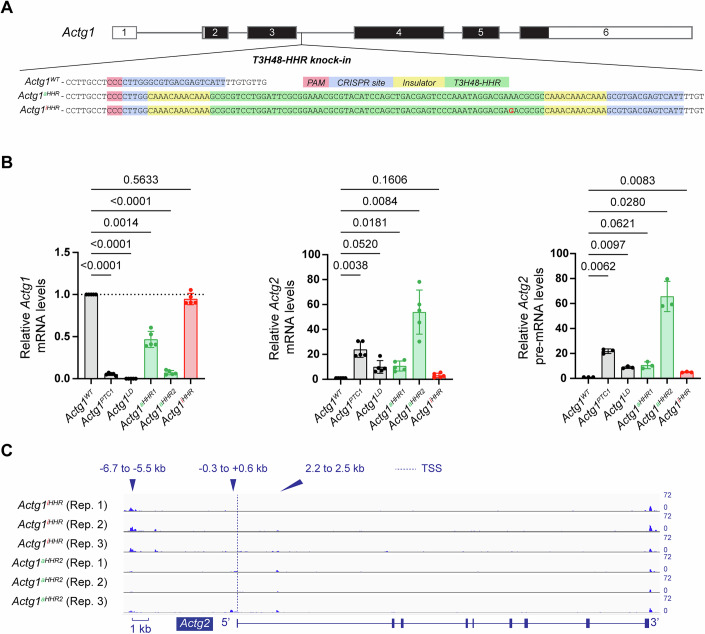
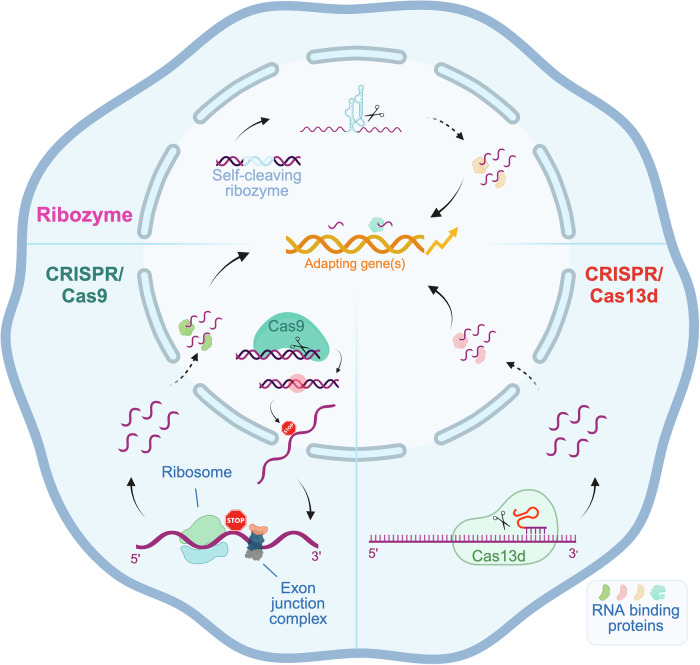
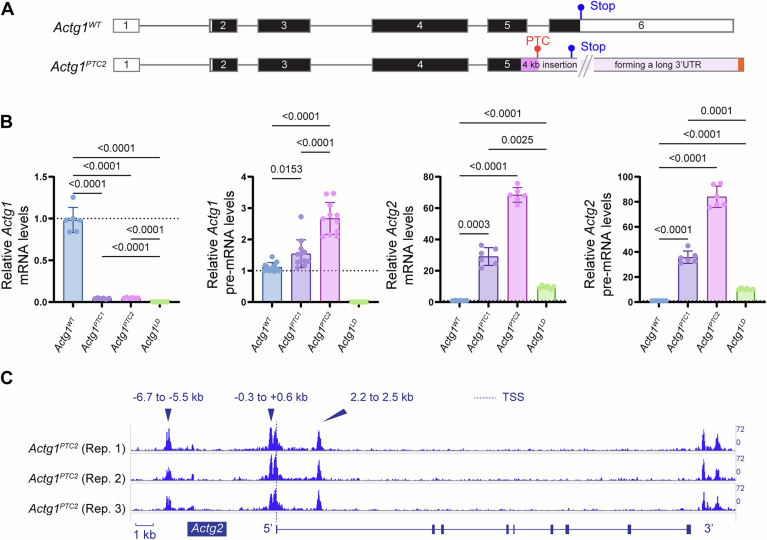
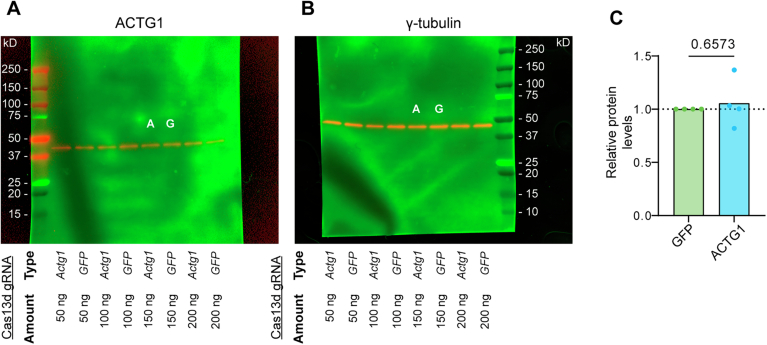
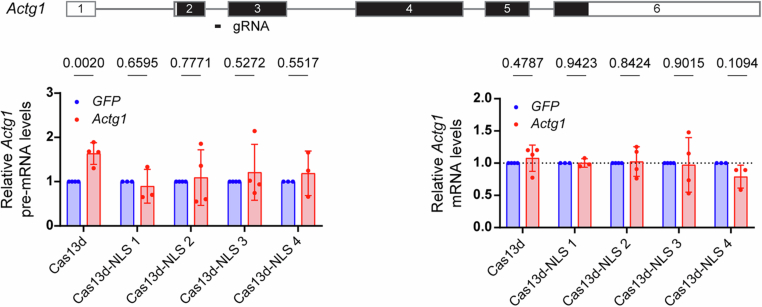
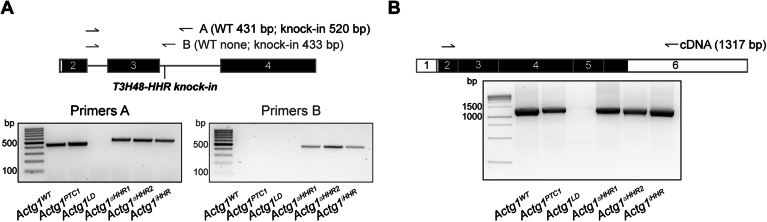
Transcriptional adaptation (TA) is a cellular process whereby mRNA-destabilizing mutations are associated with the transcriptional upregulation of so-called adapting genes. The nature of the TA-triggering factor(s) remains unclear, namely whether an mRNA-borne premature termination codon or the subsequent mRNA decay process, and/or its products, elicits TA. Here, working with mouse Actg1, we first establish two types of perturbations that lead to mRNA destabilization: Cas9-induced mutations predicted to lead to mutant mRNA decay, and Cas13d-mediated mRNA cleavage. We find that both types of perturbations are effective in degrading Actg1 mRNA, and that they both upregulate Actg2. Notably, increased chromatin accessibility at the Actg2 locus was observed only in the Cas9-induced mutant cells but not in the Cas13d-targeted cells, suggesting that chromatin remodeling is not required for Actg2 upregulation. We further show that ribozyme-mediated Actg1 pre-mRNA cleavage also leads to a robust upregulation of Actg2, and that this upregulation is again independent of chromatin remodeling. Together, these data highlight the critical role of RNA destabilization events as a trigger for TA, or at least a TA-like response.

Keywords: CRISPR/Cas13d; CRISPR/Cas9; Self-cleaving Ribozyme; Transcriptional Adaptation; mRNA Decay.


Conflict of interest statement

Disclosure and competing interests statement. The authors declare no competing interests.

Figures

Figure 1
Figure 1. Cas9-induced Actg1 mutation leads to mutant mRNA decay and Actg2 upregulation.
(A) Schematic view of wild-type and mutant Actg1 alleles. Actg1PTC1 cells contain a premature termination codon (PTC) in exon 3; this PTC is located 45 and 73 bases from the 5’ and 3’ ends of the exon, respectively. Actg1LD cells contain three different lesions: (1) complete absence of the gene, (2) absence of the gene except for the first 44 bases of the 5’UTR, and (3) absence of the gene except for the last 441 bases of the 3’UTR. Detailed information about the genotype of Actg1PTC1 and Actg1LD cells can be found in the Materials and Methods. (B) Relative mRNA and pre-mRNA levels of Actg1 and Actg2. n = 4 biologically independent samples, one-way ANNOVA, pairwise comparison, and exact p values are represented in the figure. Data are presented as mean ± standard deviation. (C) Chromatin accessibility at the Actg2 locus. ATAC-seq analysis reveals three open chromatin regions in the Actg1PTC1 allele located (1) in the 5’ intergenic region (i.e., −6.7 to −5.5 kb upstream of the transcription start site (TSS)), (2) around the TSS (i.e., −0.3 to +0.6 kb), and (3) in the first intron (i.e., 2.2 to 2.5 kb downstream of the TSS) of Actg2; n = 3 biologically independent samples. Source data are available online for this figure.
Figure 2
Figure 2. Cas13d-mediated Actg1 mRNA cleavage leads to Actg2 upregulation.
(A) Top: position of Cas13d gRNA targeting Actg1 coding sequence. Bottom: Cas13d-mediated Actg1 mRNA cleavage leads to decreased levels of Actg1 mRNA, as well as increased levels of Actg1 pre-mRNA, Actg2 mRNA, and Actg2 pre-mRNA. n = 6 biologically independent samples, unpaired t-test, and exact p values are represented in the figure. Data are presented as mean ± standard deviation. (B) Western blot analysis of the samples shown in Fig. 2A (150 ng of gRNA used; 14 h of transfection) reveals no obvious difference in ACTG1 protein levels between cells transfected with GFP- or Actg1-targeting gRNAs; γ-tubulin as loading control; full blot shown in Fig. EV2. (C, D) Top: position of Cas13d gRNAs targeting the coding sequence of Ctnna1 (C) and Nckap1 (D), respectively. Bottom: Cas13d-mediated mRNA cleavage leads to decreased mRNA levels of the targeted gene as well as increased mRNA levels of potential adapting genes: Ctnna2 and Ctnna3 for Ctnna1 (C) and Nckap1l, Nckap5, and Nckap5l for Nckap1 (D). n = 6 biologically independent samples, unpaired t-test, and exact p values are represented in the figure. Data are presented as mean ± standard deviation. (E) Chromatin accessibility at the Actg2 locus remains unchanged after two rounds of gRNA transfection 5 days and 3 days before sample collection (see methods); position of the open chromatin peaks observed in Actg1PTC1 mutant cells marked as in Fig. 1C. n = 3 biologically independent samples. Source data are available online for this figure.
Figure 3
Figure 3. Integration of a self-cleaving ribozyme in intron 3 of Actg1 leads to Actg1 pre-mRNA decay and Actg2 upregulation.
(A) Schematic view of Actg1 wild-type and T3H48 hammerhead ribozyme (HHR) knock-in alleles. Actg1aHHR and Actg1iHHR cells harbor an insulated T3H48-HHR, located 33 and 253 bases from the 5’ and 3’ ends of intron 3, respectively. A point mutation (A > G, highlighted in red) in Actg1iHHR cells renders the T3H48-HHR catalytically inactive. (B) Relative levels of Actg1 mRNA (left), Actg2 mRNA (middle), and Actg2 pre-mRNA (right) indicate Actg1 decay and Actg2 upregulation upon cleavage of Actg1 pre-mRNA by the T3H48 ribozyme. n = 3–5 biologically independent samples, one-way ANNOVA, pairwise comparison, and exact p values are represented in the figure. Data are presented as mean ± standard deviation. (C) Chromatin accessibility at the Actg2 locus. ATAC-seq analysis reveals that chromatin accessibility at the Actg2 locus remains unchanged in the catalytically active T3H48-HHR knock-in allele as compared with the catalytically inactive one; position of the open chromatin peaks observed in Actg1PTC1 mutant cells marked as in Fig. 1C. n = 3 biologically independent samples. Source data are available online for this figure.
Figure 4
Figure 4. Proposed model for TA/TA-like responses.
Three different means of RNA destabilization, namely Cas9-induced mutations, Cas13d-mediated mRNA cleavage, and ribozyme-triggered pre-mRNA cleavage, lead to the transcriptional upregulation of the adapting gene(s). Cas9-induced frameshift mutations can result in PTC-containing mutant mRNAs that are recognized by the NMD machinery and degraded. Cas13d, an endoribonuclease, is guided to specific transcripts by gRNAs and initiates their decay. A self-cleaving ribozyme integrated into an intron of a gene of interest rapidly cleaves the pre-mRNA and silences the target gene. Through yet unknown mechanisms, (m)RNA fragments by themselves or in association with RNA-binding proteins translocate to the nucleus, if necessary, where they modulate gene expression. Created with BioRender.com.
Figure EV1
Figure EV1. A second Cas9-induced Actg1 mutation also leads to mutant mRNA decay and Actg2 upregulation.
(A) Schematic view of Actg1WT and Actg1PTC2. Detailed information about the genotype of Actg1PTC2 cells can be found in the Materials and Methods section. (B) Relative mRNA and pre-mRNA levels of Actg1 and Actg2. n = 6–12 biologically independent samples, one-way ANNOVA, pairwise comparison, and exact p values are represented in the figure. Data are presented as mean ± standard deviation. (C) Chromatin accessibility at the Actg2 locus. ATAC-seq analysis reveals three open chromatin regions in the Actg1PTC2 allele located (1) in the 5’ intergenic region (i.e., −6.7 to −5.5 kb upstream of the transcription start site (TSS)), (2) around the TSS (i.e., −0.3 to +0.6 kb), and (3) in the first intron (i.e., 2.2 to 2.5 kb downstream of the TSS) of Actg2; n = 3 biologically independent samples.
Figure EV2
Figure EV2. Cas13d-mediated Actg1 mRNA cleavage does not lead to a substantial loss of ACTG1 protein.
(A, B) Western blot analysis for ACTG1 (A) and γ-tubulin (B) from Cas13d-expressing cells treated with various amounts of Actg1- or GFP-targeting gRNAs for 14 h; 150 ng of Actg1 and GFP gRNAs were used for the experiments shown in Fig. 2A, B. The molecular weight of ACTG1 is 41,793 Da, and that of γ-tubulin is 51,122 Da. Full uncropped views of blots shown in Fig. 2B; letters A and G on top of the bands in both blots refer to A – Actg1 and G – GFP. (C) Quantification of ACTG1 Western blot bands following Actg1 and GFP gRNA experiments; n = 4 biologically independent samples, unpaired t-test, and exact p values are represented in the figure.
Figure EV3
Figure EV3. Targeting Actg1 pre-mRNA in Cas 13d-NLS cells.
Top: position of Cas13d-NLS gRNA targeting Actg1 intron 2. Bottom: Actg1 pre-mRNA targeting does not lead to changes in Actg1 pre-mRNA (left) or mRNA (right) levels in four independent Cas13d-NLS knock-in clones, compared with cytoplasmic Cas13d-expressing cells transfected with the intron 2 targeting gRNA. n = 3–4 biologically independent samples, unpaired t-test, and exact p values are represented in the figure. Data are presented as mean ± standard deviation.
Figure EV4
Figure EV4. Validation of the T3H48-HHR knock-in cell lines.
(A) Homozygous knock-in of the T3H48 ribozyme in intron 3 of Actg1 as confirmed by two pairs of genotyping primers in Actg1aHHR and Actg1iHHR cells. Two independent clones were generated for Actg1aHHR. (B) Actg1 cDNA profile in Actg1aHHR and Actg1iHHR cells is identical to that in wild-type cells, indicating no alternative splicing caused by the T3H48-HHR knock-in. RT-PCR reactions were run at saturation and therefore, Actg1 downregulation was not observed in the PTC and T3H48-aHHR alleles in this experiment.

Similar articles

References

    1. Anders S, Huber W (2010) Differential expression analysis for sequence count data. Genome Biol 11:R106 - PMC - PubMed
    1. Bolger AM, Lohse M, Usadel B (2014) Trimmomatic: a flexible trimmer for Illumina sequence data. Bioinformatics 30:2114–2120 - PMC - PubMed
    1. Buenrostro JD, Giresi PG, Zaba LC, Chang HY, Greenleaf WJ (2013) Transposition of native chromatin for fast and sensitive epigenomic profiling of open chromatin, DNA-binding proteins and nucleosome position. Nat Methods 10:1213–1218 - PMC - PubMed
    1. Cao J, Cusanovich DA, Ramani V, Aghamirzaie D, Pliner HA, Hill AJ, Daza RM, McFaline-Figueroa JL, Packer JS, Christiansen L et al (2018) Joint profiling of chromatin accessibility and gene expression in thousands of single cells. Science 361:1380–1385 - PMC - PubMed
    1. Cong L, Ran FA, Cox D, Lin S, Barretto R, Habib N, Hsu PD, Wu X, Jiang W, Marraffini LA et al (2013) Multiplex genome engineering using CRISPR/Cas systems. Science 339:819–823 - PMC - PubMed

LinkOut - more resources