. 2025 Mar 24;8(1):479.
doi: 10.1038/s42003-025-07846-x.

Integrative genomics sheds light on the immunogenetics of tuberculosis in cattle

Affiliations

Integrative genomics sheds light on the immunogenetics of tuberculosis in cattle

John F O'Grady et al. Commun Biol. .

Abstract

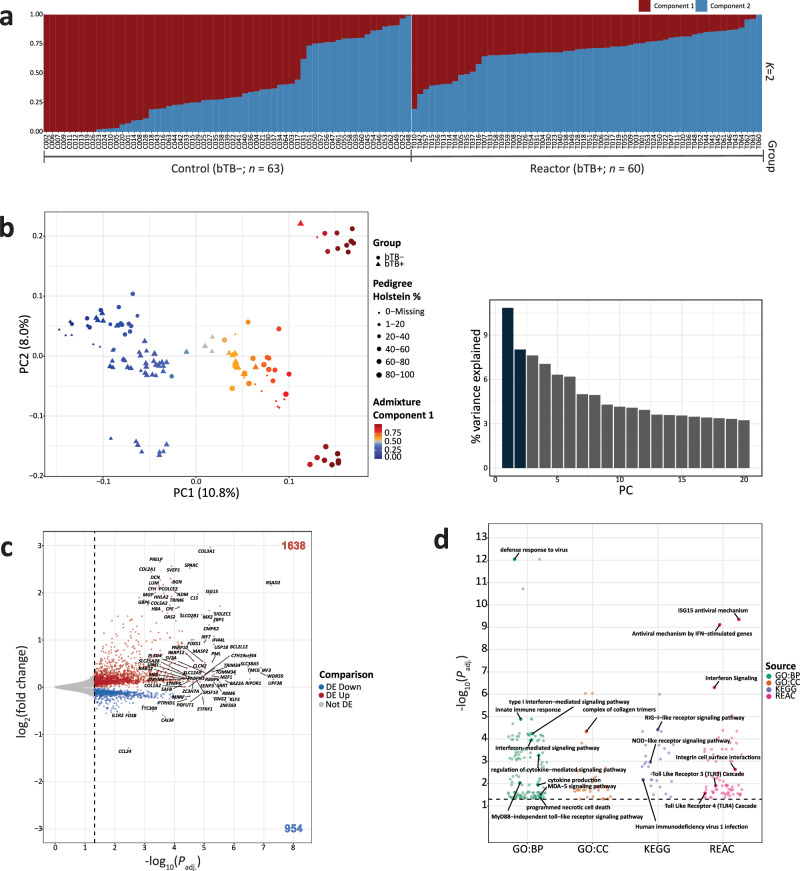
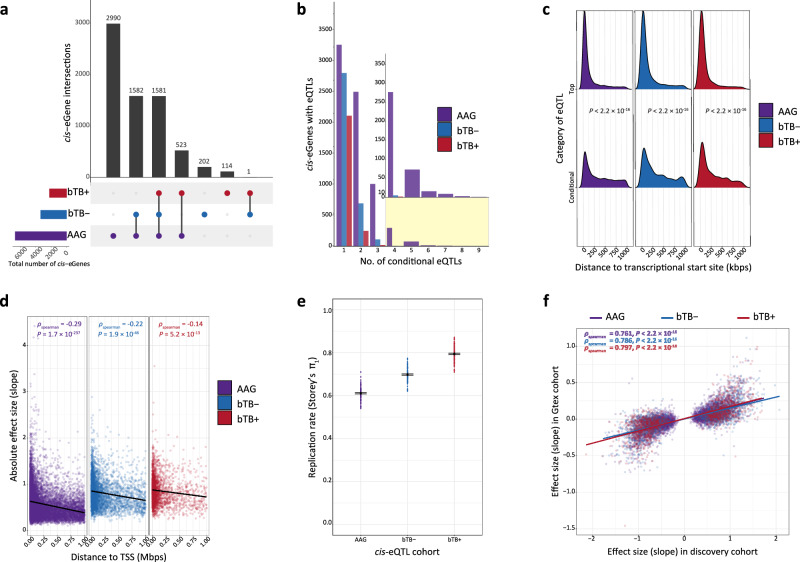
Mycobacterium bovis causes bovine tuberculosis (bTB), an infectious disease of cattle that represents a zoonotic threat to humans. Research has shown that the peripheral blood (PB) transcriptome is perturbed during bTB disease but the genomic architecture underpinning this transcriptional response remains poorly understood. Here, we analyse PB transcriptomics data from 63 control and 60 confirmed M. bovis-infected animals and detect 2592 differently expressed genes perturbing multiple immune response pathways. Leveraging imputed genome-wide SNP data, we characterise thousands of cis-expression quantitative trait loci (eQTLs) and show that the PB transcriptome is substantially impacted by intrapopulation genomic variation during M. bovis infection. Integrating our cis-eQTL data with bTB susceptibility GWAS summary statistics, we perform a transcriptome-wide association study and identify 115 functionally relevant genes (including RGS10, GBP4, TREML2, and RELT) and provide important new omics data for understanding the host response to mycobacterial infections that cause tuberculosis in mammals.


Conflict of interest statement

Competing interests: The authors declare no competing interests.

Figures

Fig. 1
Fig. 1. Experimental and computational workflow.
Data resources for the project included; (1) newly generated high-resolution SNP-array data, peripheral blood RNA-seq data and interferon-gamma (IFN-γ) release assay (IGRA) measurements from a reference panel of n = 60 bovine tuberculosis (bTB) reactor (bTB+) and n = 63 control (bTB−) cattle; (2) single and multi-breed GWAS summary statistics for bTB susceptibility from Ring et al.; (3) whole genome sequence (WGS) data from Dutta et al., (2020) and; (4) whole blood eQTL summary statistics from the Cattle Genotype-Tissue Expression (GTEx) Consortium. For the reference panel, SNP array genotype data was remapped to the ARS-UCD1.2 bovine genome build and imputed using the WGS cohort as a reference panel. RNA-seq data was aligned to ARS-UCD1.2 with the resulting count matrices normalised using various methodologies (see “Methods”) for inclusion in the differential expression, functional enrichment, and expression quantitative trait loci (eQTL) analyses. The normalised expression matrix was integrated with the imputed SNP-array data for the eQTL analysis. To assess the replication of eQTLs, we leveraged whole-blood eQTL summary statistics from the Cattle GTEx Consortium. Finally, the GWAS summary statistics were remapped to ARS-UCD1.2 before being integrated with the reference panel eQTL results to conduct three single- and one multi-breed transcriptome-wide association study (TWAS) for bTB susceptibility using the MOSTWAS software. Some figure components were created with a BioRender.com license. Individual cattle art images are modified from Felius with the permission of the author.
Fig. 2
Fig. 2. Population genomics, differential expression, and functional enrichment analyses.
a Structure plot showing the proportion of ancestry components 1 and 2 from the ADMIXTURE analysis for 123 animals (reactor bTB+ and control bTB−). b Principal component analysis (PCA) plot of PC1 and PC2 derived from 34,272 pruned SNPs genotyped in 123 animals. The data points are shaped based on their experimental designation, coloured based on the inferred ancestry component 1 from the ADMIXTURE analysis, and sized based on their reported pedigree Holstein percentage. A histogram plot of the relative variance contributions for the first 20 PCs is also shown with PC1 and PC2 accounting for 10.8% and 8.0% of the variation in the top 20 PCs, respectively. c Horizontal volcano plot of differentially expressed genes (DEGs) for the bTB+ (n = 60) vs bTB− (n = 63) contrast with thresholds determined by FDR Padj. < 0.05 and an absolute log2 fold-change (LFC) > 0. The x-axis represents the −log10 Padj. and the y-axis represents the LFC. d Jitter plot of significantly impacted pathways/GO terms identified across the gene ontology (GO) biological processes (GO:BP), cellular component (GO:CC), reactome (REAC) and Kyoto Encyclopaedia of Genes and Genomes (KEGG) databases using g:Profiler. The data points are coloured according to the corresponding database.
Fig. 3
Fig. 3. Cis-expression quantitative trait loci (cis-eQTL) mapping and external replication results.
a Upset plot showing the intersection of shared cis-eGenes identified in the reactor (bTB+), control (bTB−), and combined all animals group (AAG) cohorts, respectively. b Barplot illustrating the number of genes with a significant primary or conditional cis-eQTL for degrees 1–9 across all three groups. The inset shows the number of genes for cis-eQTL degrees 4–9. c Ridgeline plot showing the distribution of the absolute distance from the transcriptional start site (TSS) of top and conditional cis-eQTLs identified in all three groups. P-values are inferred from the Wilcoxon rank-sum test between top and conditional cis-eQTLs within each group. d Scatter plot illustrating the relationship between absolute cis-eQTL effect size and distance to the TSS for all significant cis-eQTLs (top and conditional) identified in each group separately. Spearman correlation (ρ) values are also reported in addition to the corresponding P-value representing the significance level of each respective correlation. The black line indicates line of best fit. e Replication rate as measured by Storey’s π1 in the current study and whole blood cis-eQTLs identified in the Cattle GTEx. The error bars indicate the standard error of the sample mean (SEM) calculated from 100 bootstrap samplings. f Scatterplot illustrating the effect sizes of significant cis-eQTLs identified in this study and matched variant-gene pairs identified in the Cattle GTEx. Spearman correlation values are also reported in addition to the corresponding P-value representing the significance level of each respective correlation. The coloured lines indicate lines of best fit within each group, respectively. The colour scheme for each group is consistent throughout the figure.
Fig. 4
Fig. 4. Effect of sample size on cis-QTL discovery and the characterisation of interaction cis-eQTLs and context-specific cis-eVariants.
a Boxplot showing the distribution of the absolute log2 allelic fold change (slope_aFC) for top significant cis-eQTLs (Padj. < 0.05) identified in the all animals group (AAG), the control group (bTB−) and the reactor group (bTB+), respectively. b Scatter plot showing the Spearman correlation (ρ) between the slope_aFC and the effect size from the linear regression model of top significant cis-eQTLs in the AAG, bTB−, and bTB+ cohorts, respectively. c Visualisation of an interaction cis-eQTL (ieQTL) for the gene PCBP2 identified in the AAG cohort. Data points are coloured and shaped based on an animal’s experimental designation. Trend lines are inferred from setting the geom_smooth function in R setting the method to “lm”. d Scatter plot illustrating the effect sizes of cis-eVariants tested in both the bTB− and bTB+ cohorts. Cis-eVariants are coloured depending on whether they are significant (Padj. < 0.05) in the bTB− cohort only (blue), in the bTB+ cohort only (red), in both the bTB− and bTB+ cohorts (gold), or neither (grey). e Boxplot displaying the residualized expression values for the gene IFI16, with individuals separated based on their genotype at the SNP Chr3:10984726:G:A and coloured based on their respective cohort. Nominal P-values of association in each cohort are displayed with slope values from the linear regression model. f Same as (e) but for the gene IFITM3 and the SNP Chr29:50294904:G:A. g Same as (e) but for the gene IL1R1 and the SNP Chr11:6851248:C:G. h Same as (e) but for the gene RGS10 and the SNP 26:40304855:C:A. The box plots in (a) and eh cover the interquartile range with the median line denoted at the centre, and the whiskers extend to the most extreme data point that is no more than 1.5 × IQR from the edge of the box.
Fig. 5
Fig. 5. Transcriptome-wide association analysis (TWAS) results.
a Manhattan plot showing all TWAS associations for expression models generated in the analysis of all animals combined and imputed into four GWAS data sets (Charolais (CH), Holstein-Friesian (HF), Limousin (LM), and multi-breed (MB)). Yellow data points have a Bonferroni FDR Padj. < 0.05, and red points correspond to genes that have a Bonferroni Padj. < 0.05, and Pperm. < 0.05. Labelled genes correspond to red data points in the plot. b Volcano plot highlighting significant TWAS associations for expression models generated in the control group (bTB−). The x-axis indicates the TWAS Z-score, and the y-axis shows the nominal (−log10 scale) P-value of association. Associations are coloured based on the GWAS data set for which the expression model was imputed. Associations are shaped according to whether they had a Bonferroni Padj. > 0.05 (circle), Padj. < 0.05 (triangle), or Padj. ≤ 0.05 and Pperm. < 0.05 (square). The dashed line corresponds to a Bonferroni Padj. cut-off (P < 2.00 × 105). c Volcano plot highlighting significant TWAS associations for expression models generated in the reactor group (bTB+). The x-axis indicates the TWAS Z-score, and the y-axis shows the nominal P-value of association. Associations are coloured based on the GWAS data set for which the expression model was imputed. Associations are shaped according to whether they had an FDR Padj. > 0.05 (circle), Padj. < 0.05 (triangle), or Padj. ≤ 0.05 and Pperm. < 0.05 (square). The dashed line corresponds to a Bonferroni Padj. cut-off (P < 3.14 × 105). The figure legend for (b, c) is common to both.

References

    1. Paulson, T. Epidemiology: a mortal foe. Nature502, S2–S3 (2013). - PubMed
    1. World Health Organization. Global Tuberculosis Report 2024 (World Health Organization, 2024).
    1. Brosch, R. et al. Comparative genomics of the mycobacteria. Int. J. Med. Microbiol.290, 143–152 (2000). - PubMed
    1. Garnier, T. et al. The complete genome sequence of Mycobacterium bovis. Proc. Natl. Acad. Sci. USA100, 7877–7882 (2003). - PMC - PubMed
    1. Gutierrez, M. C. et al. Ancient origin and gene mosaicism of the progenitor of Mycobacterium tuberculosis. PLoS Pathog1, e5 (2005). - PMC - PubMed

LinkOut - more resources