. 2025 Mar 24;13(1):84.
doi: 10.1186/s40168-025-02075-0.

The mitigation of spatial constraint in porous environments enhances biofilm phylogenetic and functional diversity

Affiliations

The mitigation of spatial constraint in porous environments enhances biofilm phylogenetic and functional diversity

Chengxia Fu et al. Microbiome. .

Abstract

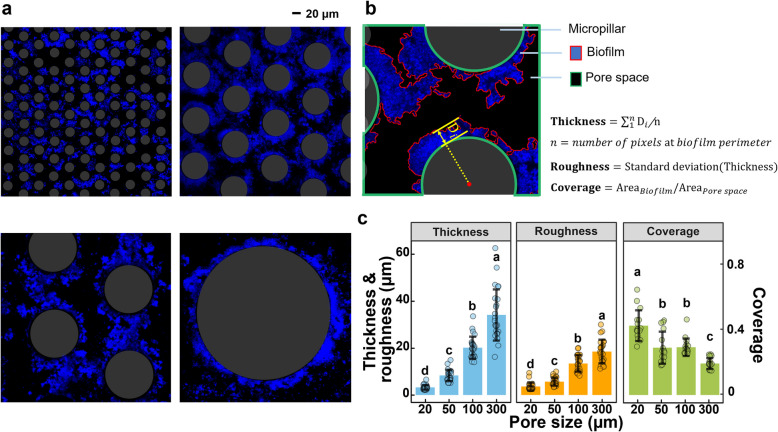
Background: Porous environments constitute ubiquitous microbial habitats across natural, engineered, and medical settings, offering extensive internal surfaces for biofilm development. While the physical structure of the porous environment is known to shape the spatial organization of biofilm inhabitants and their interspecific interactions, its influence on biofilm community structure and functional diversity remains largely unknown. This study employed microfluidic chips with varying micropillar diameters to create distinct pore spaces that impose different levels of spatial constraints on biofilm development. The impact of pore spaces on biofilm architecture, community assembly, and metabolic functions was investigated through in situ visualization and multi-omics technologies.

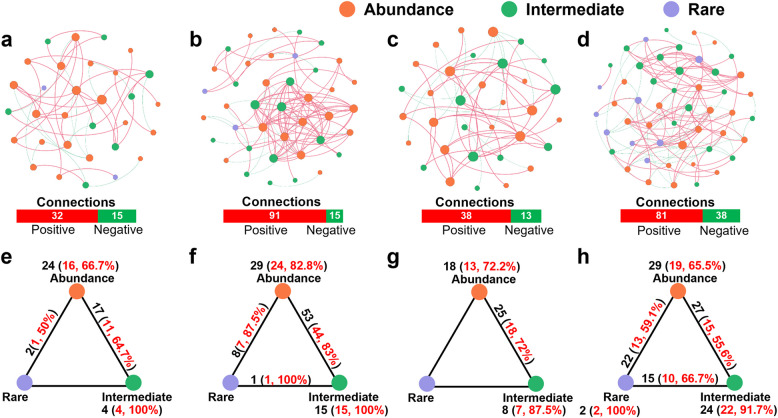
Results: Larger pore sizes were found to increase biofilm thickness and roughness while decreasing biofilm coverage over pore spaces. An increase in pore size resulted in reduced biofilm community evenness and increased phylogenetic diversity. Remarkably, biofilms in 300-μm pore spaces displayed the highest richness and the most complex and interconnected co-occurrence network pattern. The neutral model analysis demonstrated that biofilm assembly within different pore spaces was predominantly governed by stochastic processes, while deterministic processes became more influential as pore space increased. Exometabolomic analyses of effluents from the microfluidic chips further elucidated a significant correlation between the exometabolite profiles and biofilm community structure. The increased community richness in the 300-μm pore space was associated with the significantly higher exometabolome diversity.

Conclusions: Collectively, our results indicate that increased pore space, which alleviated spatial constraints on biofilm development, resulted in the formation of thicker biofilms with enhanced phylogenetic and functional diversity. Video Abstract.

Keywords: Biofilm; Community assembly; Microfluidics; Multi-omics; Pore space; Spatial constraints.


Conflict of interest statement

Declarations. Ethics approval and consent to participate: Not applicable. Consent for publication: Not applicable. Competing interests: The authors declare no competing interests.

Figures

Fig. 1
Fig. 1
Microfluidic platform to study soil biofilm assembly and function under varying spatial constraints. The microfluidic chips contain micropillars of different diameters to impose varying levels of spatial constraints on biofilm development. A soil microbial community extracted from woodland topsoil was cultivated in the microfluidic devices using a soil extract medium prepared from the same soil sample. Biofilm functional characteristics were analyzed through exometabolomic profiling of the effluent from the microfluidic chips
Fig. 2
Fig. 2
Biofilm development in the microfluidic chip. Biofilm morphologies in different pore spaces (a). Biofilm cells were stained with DAPI. Schematic diagram illustrating biofilm morphology and coverage analysis (b). Biofilm thickness was calculated as the average radial distance from the biofilm perimeter to the micropillar surface, while roughness was quantified as the standard deviation of biofilm thickness on individual micropillar surfaces. Coverage represents the proportion of pore space occupied by biofilm. The biofilm thickness, roughness, and coverage in different pore environments (c). Data are presented as mean ± standard deviation. Biofilm morphology and coverage were assessed using images sampled from random areas within three independent biological replicates per pore space. Twenty-five observations per group were analyzed for biofilm thickness and roughness, while 15 observations per group were collected for biofilm coverage analysis. Different letters indicate significant differences (p < 0.05, one-way ANOVA)
Fig. 3
Fig. 3
Taxonomic and phylogenetic diversities of biofilms across different pore spaces. Shannon diversity of biofilm communities at varying pore sizes (a). Negative and positive correlations between community richness (b) and evenness (c) with biofilm coverage. Decreased abundance-weighted mean nearest taxon distance (weighted SES.MNTD) associated with higher biofilm coverage (d). r represents the Spearman correlation coefficient, and the shaded area indicates the 95% confidence interval. Different letters indicate significant differences (p < 0.05, one-way ANOVA, n = 7 independent biological replicates per pore size). Relative abundance of whole biofilm communities and subcommunities (abundant, intermediate, and rare) at the genus level (e)
Fig. 4
Fig. 4
Fit of the Sloan neutral community model. Each point represents a bacterial ASV at the pore size of 20 µm (a, e), 50 µm (b, f), 100 µm (c, g), and 300 µm (d, h). Dashed lines illustrate 95% confidence intervals around the model prediction. ASVs that occur more frequently and less frequently than the prediction are shown in blue and yellow, respectively (a, b, c, d). The R2 demonstrates the goodness of fit to the neutral model. The inset pie chart reveals the proportion of ASVs below, within, and above neutral expectations. The abundant, intermediate, and rare ASVs were colored as orange, green, and purple, respectively (e, f, g, h). Relative abundance of different subcommunities that fall below, within, and above neutral model expectation (i, j, k, l). The numbers in the column denote the count of ASVs
Fig. 5
Fig. 5
Network associations of bacterial ASVs in different pore spaces. Co-occurrence networks were constructed using Spearman’s rank correlation to identify strong and significant correlations (Spearman’s r > 0.5 and p < 0.05) (a, b, c, d). The node color represents the abundance categories of the ASV, and the node size is proportional to its degree. The connection thickness reflects the strength of Spearman’s correlation coefficients. A red connection indicates a positive correlation, while a green connection denotes a negative correlation. The bar graph presents the total number of positive and negative connections within each porous environment. Summaries of node-connection statistics (e, f, g, h). The black numbers indicate the total number of connections within and between subcommunities, and the red numbers in parentheses represent the count and percentage of positive connections
Fig. 6
Fig. 6
Enhanced exometabolite diversity in large pore spaces. Procrustes analysis revealing the significant correlation between microbial communities and exometabolite profiles (a). The Shannon diversity of the exometabolites in different pore spaces (b). Enrichment analysis of exometabolomic data with respect to fresh ISEM (c). The bubble size corresponds to the pathway enrichment ratio for differentially abundant metabolites across various pore spaces. Asterisks denote statistically significant differences based on the hypergeometric test (***p ≤ 0.001, **p ≤ 0.01, *p ≤ 0.05, n = 7 independent biological replicates per pore size)

Similar articles

References

    1. Flemming HC, Wuertz S. Bacteria and archaea on earth and their abundance in biofilms. Nat Rev Microbiol. 2019;17:247–60. - PubMed
    1. Kolter R, Greenberg EP. The superficial life of microbes. Nature. 2006;441:300–2. - PubMed
    1. Flemming H-C, Baveye P, Neu TR, Stoodley P, Szewzyk U, Wingender J, et al. Who put the film in biofilm? The migration of a term from wastewater engineering to medicine and beyond. NPJ Biofilms Microbiomes. 2021;7:10. - PMC - PubMed
    1. Kurz DL, Secchi E, Carrillo FJ, Bourg IC, Stocker R, Jimenez-Martinez J. Competition between growth and shear stress drives intermittency in preferential flow paths in porous medium biofilms. Proc Natl Acad Sci USA. 2022;119:e2122202119. - PMC - PubMed
    1. Wilpiszeski RL, Aufrecht JA, Retterer ST, Sullivan MB, Graham DE, Pierce EM, et al. Soil aggregate microbial communities: towards understanding microbiome interactions at biologically relevant scales. Appl Environ Microbiol. 2019;85:e00324-e419. - PMC - PubMed

LinkOut - more resources