. 2025 May;12(19):e2413220.
doi: 10.1002/advs.202413220. Epub 2025 Mar 24.

Simultaneous Monitoring of Tyrosinase and ATP in Thick Brain Tissues Using a Single Two-Photon Fluorescent Probe

Affiliations

Simultaneous Monitoring of Tyrosinase and ATP in Thick Brain Tissues Using a Single Two-Photon Fluorescent Probe

Hong Huang et al. Adv Sci (Weinh). 2025 May.

Abstract

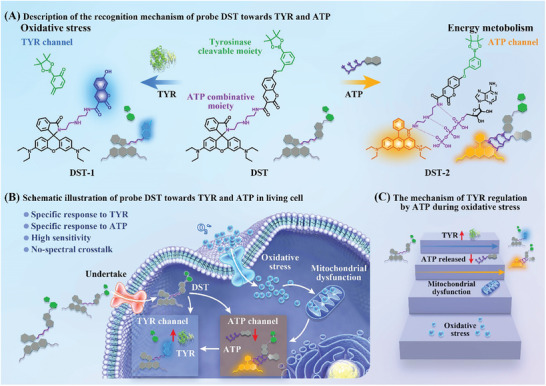
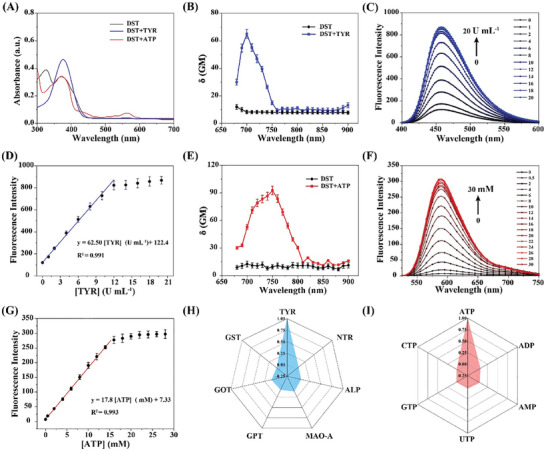
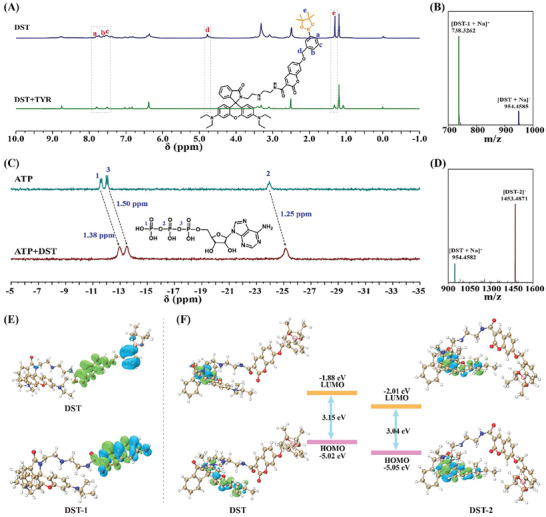
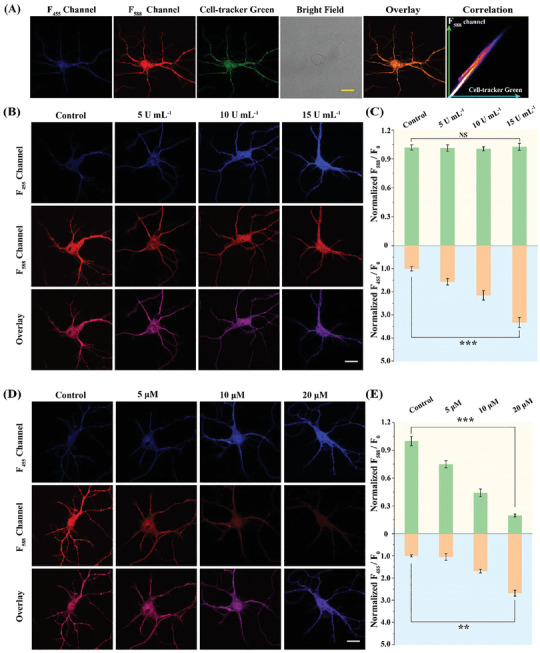
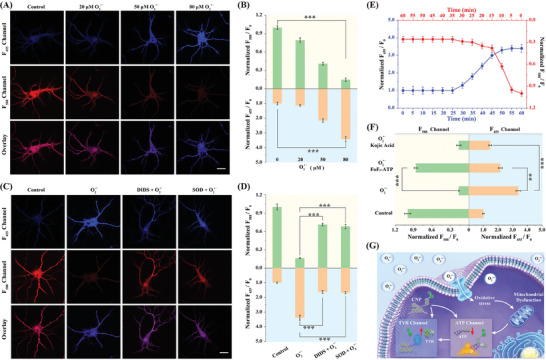
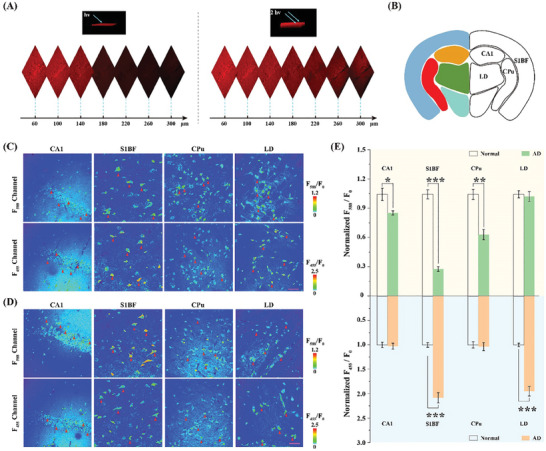
Cellular redox homeostasis and energy metabolism in the central nervous system are associated with neurodegenerative diseases. However, their real-time and concurrent monitoring in thick tissues remains challenging. Herein, a single dual-emission two-photon fluorescent probe (named DST) is designed for the simultaneous tracking of tyrosinase (TYR) and adenosine triphosphate (ATP), thereby enabling the real-time monitoring of both neurocellular redox homeostasis and energy metabolism in brain tissue. The developed DST probe exhibits excellent sensitivity and selectivity toward TYR and ATP, with distinctive responses in the blue and red fluorescence channels being observed without spectra crosstalk. Using this probe, the correlation and regulatory mechanism between TYR and ATP during oxidative stress are uncovered. Additionally, the two-photon nature of this probe allows alterations in the TYR and ATP levels to be monitored across different brain regions in an Alzheimer's disease (AD) mouse model. Notably, a significant decrease in ATP levels is revealed within the somatosensory cortex (S1BF) and caudate putamen brain regions of an AD mouse, alongside an increase in TYR levels within the S1BF and laterodorsal thalamic nucleus brain regions. These findings indicate the potential of applying the spatially resolved regulation of neurocellular redox homeostasis and energy metabolism to treat neurodegenerative diseases.

Keywords: ATP; alzheimer's disease; brain tissues; two‐photon imaging; tyrosinase.


Conflict of interest statement

The authors declare no conflict of interest.

Figures

Scheme 1
Scheme 1
Schematic representations of the working principle of the developed DST probe. A) Recognition mechanism of the developed DST probe. B) Schematic illustration showing the simultaneous response of the DST probe toward TYR and ATP in a neuron. C) Mechanism of TYR regulation by ATP during oxidative stress.
Figure 1
Figure 1
A) UV–vis absorption spectra of the DST probe before (black line) and after the addition of TYR (blue line) and ATP (red line). B) Two‐photon action cross‐section spectra of DST in the presence and absence of TYR. C) Two‐photon fluorescence spectra of the 5.0 µm DST probe in the presence of various TYR concentrations (0–20 U mL−1). D) Linear correlation between the TYR concentration and the fluorescence intensity at 455 nm. E) Two‐photon action cross‐section spectra of DST in the presence and absence of ATP. F) Two‐photon fluorescence spectra of the 5.0 µm DST probe in the presence of various ATP concentrations (0–30 mm). G) Linear correlation between the ATP concentration and the fluorescence intensity at 588 nm. Error bars represent the standard deviations (SD) for n = 10. H) Selectivity test performed for the 5.0 µm DST probe in the presence of various proteins, including NTR, ALP, MAO‐A, GPT, GOT, and GST (20 U mL−1 each). I) Selectivity test performed for the 5.0 µm DST probe in the presence of various energy‐relevant molecules, including ADP, AMP, UTP, GTP, and CTP (30 mm each). All data were recorded in PBS (10 mm, pH 7.4) containing 5% (v/v) DMSO using an excitation wavelength of 720 nm.
Figure 2
Figure 2
Mechanistic investigations into the molecular interactions between DST, TYR, and ATP. A) 1H NMR spectrum (D2O‐d2 , 500 MHz) of DST (5 mm) in the presence of TYR (20 U mL−1). B) HR‐MS results for the DST probe in the presence of TYR. C) 31P NMR spectrum (D2O‐d2 , 500 MHz) of DST (5 mm) in the presence of ATP (30 mm). D) HR‐MS results for the DST probe in the presence of ATP. E) Hole‐electron analysis of DST and DST‐1. F) HOMO‐LUMO energy levels of DST and DST‐2.
Figure 3
Figure 3
A) Fluorescence images of different channels of neurons incubated with DSTex = 720 nm; F455: λem = 400–480 nm, F588: λem = 520–620 nm) and CellTracker Green (λex = 488 nm; λem = 500–580 nm). The overlay image was obtained from the F588 channel and CellTracker Green. B) Fluorescence imaging of neurons in the presence of TYR (0, 5, 10, and 15 U mL−1). C) Quantification of the fluorescent intensity ratio changes (F455/F0 and F588/F0) based on the data presented in panel (B). D) Fluorescence imaging of neurons in the presence of oligomycin (0, 5, 10, and 20 µm). E) Quantification of the fluorescent intensity ratio changes (F455/F0 and F588/F0) based on the data presented in panel (D). F0 represents the average fluorescence intensity from the control group. F455 and F588 denote the average fluorescence intensities from the experimental groups. Error bars indicate the SD for n = 5. Scale bar: 30 µm. Statistical significance was assessed using a two‐tailed unpaired t‐test, and the associated P values are specified in the figure legends as follows: NSP > 0.05, ** p < 0.01, and *** p < 0.001.
Figure 4
Figure 4
Two‐photon fluorescence imaging and real‐time quantification of TYR and ATP in neurons and brain tissues. A) Confocal microscopy imaging of the DST probe (5 µm) in the neurons under O2 •− (0, 20, 50, and 80 µm) stimulation. B) Quantification of fluorescent intensity ratio changes (F455/F0 and F588/F0) based on the results presented in panel (A). C) Confocal microscopy imaging of the neurons after treatment with 100 µm O2 •− in the presence of 150 µm DIDS or 100 U mL−1 SOD. D) Quantification of fluorescent intensity ratio (F455/F0 and F588/F0) based on the results presented in panel (C). E) Quantification of fluorescent intensity ratio changes (F455/F0 and F588/F0) under O2 •− stimulation at different times. F) Quantification of fluorescent intensity ratio changes (F455/F0 and F588/F0) after treatment with 100 µm O2 •− in the presence of 100 mg kg−1 kojic acid or 100 mg kg−1 F0F₁‐ATP. G) Illustration of the recognition mechanism of the DST probe in response to TYR and ATP in the neurons. Error bars represent the SD for n = 10. Scale bar: 30 µm.Asterisks indicate statistically significant changes (** p < 0.01, *** p < 0.001).
Figure 5
Figure 5
Two‐photon fluorescence imaging and real‐time quantification of TYR and ATP in mouse brain tissues. A) 3D one‐photon and two‐photon fluorescence images of the hippocampus region in the mouse brain labeled with DST, and excited at 405 and 720 nm, respectively. B) Illustration of the mouse brain regions (dark blue: cortex; red: striatum; green: thalamus; and yellow: hippocampus). C) Confocal microscopy imaging of TYR and ATP in the CA1, S1BF, CPu, and LD regions of the AD mouse brain slices. D) Confocal microscopy imaging of TYR and ATP in the CA1, S1BF, CPu, and LD regions of the normal mouse brain slices. Note: Neuron segmentation was performed to assess the fluorescence intensity contribution specifically from the neurons, rather than from the overall tissue. Red triangles indicate the representative neurons. E) Quantification of the fluorescent intensity ratio changes (F455/F0 and F588/F0) based on the data presented in panels (C) and (D). Error bars show the SD for n = 10. Scale bar: 75 µm. Asterisks indicate statistically significant changes (* p < 0.05, ** p < 0.01, and *** p < 0.001).

Similar articles

References

    1. a) Kang Z., Jiang J., Tu Q., Liu S., Zhang Y., Wang D.‐E., Wang J., Yuan M.‐S., J. Am. Chem. Soc. 2023, 145, 507; - PubMed
    2. b) Brewster J. T. II, Dell'Acqua S., Thach D. Q., Sessler J. L., ACS Chem. Neurosci. 2019, 10, 155; - PubMed
    3. c) Liesz A., Science 2019, 365, 223; - PubMed
    4. d) Zhang L., Peng S., Sun J., Yao J., Kang J., Hu Y., Fang J., Chem. Sci. 2017, 8, 2966. - PMC - PubMed
    1. a) Fujieda N., Umakoshi K., Ochi Y., Nishikawa Y., Yanagisawa S., Kubo M., Kurisu G., Itoh S., Angew. Chem., Int. Ed. 2020, 59, 13385; - PubMed
    2. b) Zhang T., Li Y., Guo J., Sun W., Lv Y., Adv. Healthcare Mater. 2024, 13, 2303615; - PubMed
    3. c) Kampatsikas I., Bijelic A., Pretzler M., Rompel A., Angew. Chem., Int. Ed. 2019, 58, 7475. - PMC - PubMed
    1. a) Wu Z., He K., Chen Y., Li H., Pan S., Li B., Liu T., Xi F., Deng F., Wang H., Du J., Jing M., Li Y., Neuron 2022, 110, 770 ; - PubMed
    2. b) Liu J., Zhang W., Wang X., Ding Q., Wu C., Zhang W., Wu L., James T. D., Li P., Tang B., J. Am. Chem. Soc. 2023, 145, 19662; - PMC - PubMed
    3. c) Xu X., Fei J., Xu Y., Li G., Dong W., Xue H., Li J., Angew. Chem., Int. Ed. 2021, 60, 7617. - PubMed
    1. a) Yan H., Wang Y., Huo F., Yin C., J. Am. Chem. Soc. 2023, 145, 3229; - PubMed
    2. b) Brady M., Shchepetkina V. I., González‐Recio I., Martínez‐Chantar M. L., Buccella D., J. Am. Chem. Soc. 2023, 145, 21841; - PMC - PubMed
    3. c) Fang H., Chen Y., Jiang Z., He W., Guo Z., Acc. Chem. Res. 2023, 56, 258. - PubMed
    1. a) Tamima U., Sarkar S., Islam M. R., Shil A., Kim K. H., Reo Y. J., Jun Y. W., Banna H., Lee S., Ahn K. H., Angew. Chem., Int. Ed. 2023, 62, e202300580; - PubMed
    2. b) Yang S., Jiang J., Zhou A., Zhou Y., Ye W., Cao D.‐S., Yang R., Anal. Chem. 2020, 92, 7194; - PubMed
    3. c) Morozov B. S., Gargiulo F., Ghule S., Lee D. J., Hampel F., Kim H. M., Kataev E. A., J. Am. Chem. Soc. 2024, 146, 7105; - PubMed
    4. d) Sun P., Chen H.‐C., Lu S., Hai J., Guo W., Jing Y.‐H., Wang B., Anal. Chem. 2022, 94, 11573; - PubMed
    5. e) Cui Y., Park S. J., Wu X., Wang R., Qi S., Kim H. M., Yoon J., Chem. Commun. 2021, 57, 6911. - PubMed

LinkOut - more resources