. 2025 Mar 8:51:145-158.
doi: 10.1016/j.jot.2025.01.006. eCollection 2025 Mar.

Targeting Piezo1 channel to alleviate intervertebral disc degeneration

Affiliations

Targeting Piezo1 channel to alleviate intervertebral disc degeneration

Feiyun Li et al. J Orthop Translat. .

Abstract

Background: Low back pain impacts over 600 million people worldwide, predominantly due to intervertebral disc degeneration. This study focuses on the role of Piezo1, a crucial mechanosensitive ion channel protein, in the pathology and potential treatment of disc degeneration.

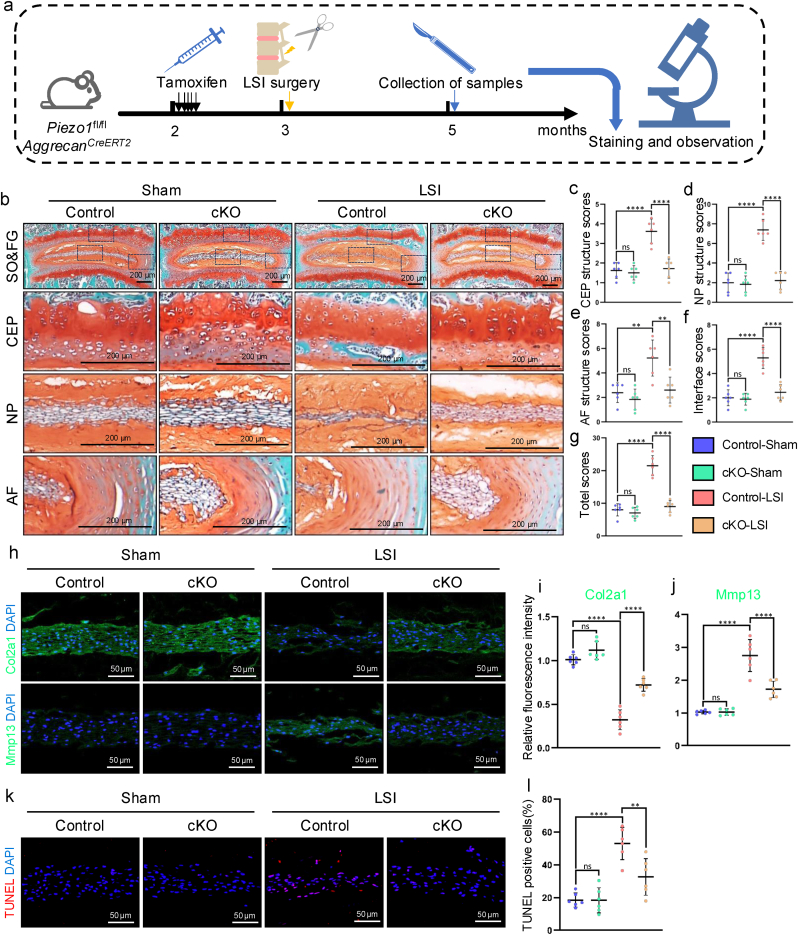
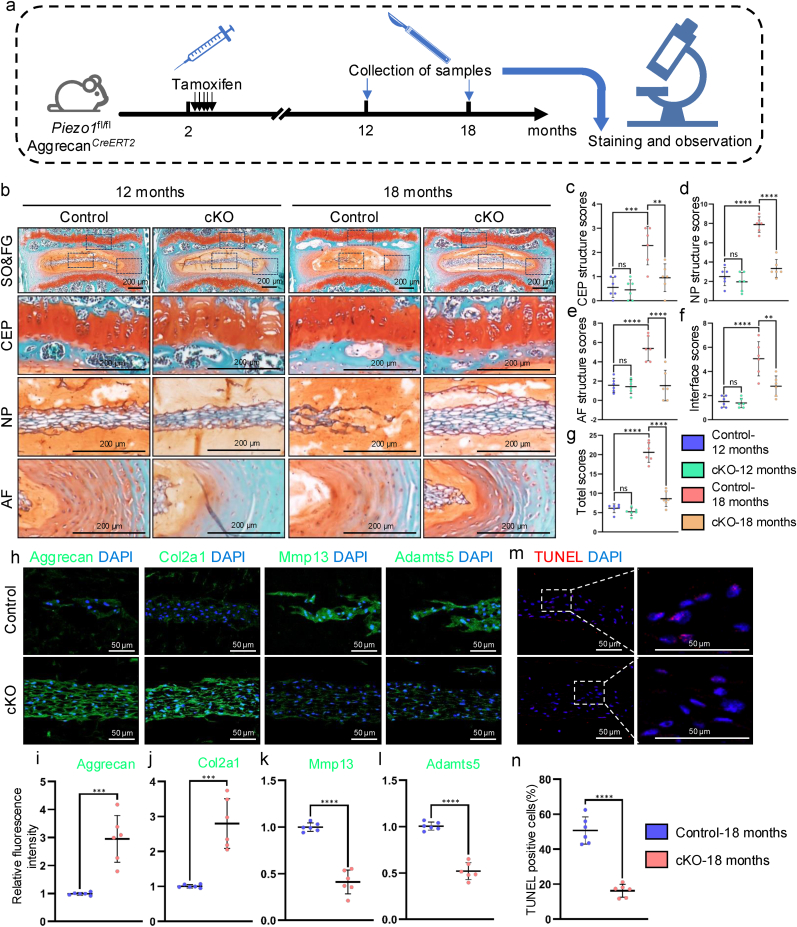
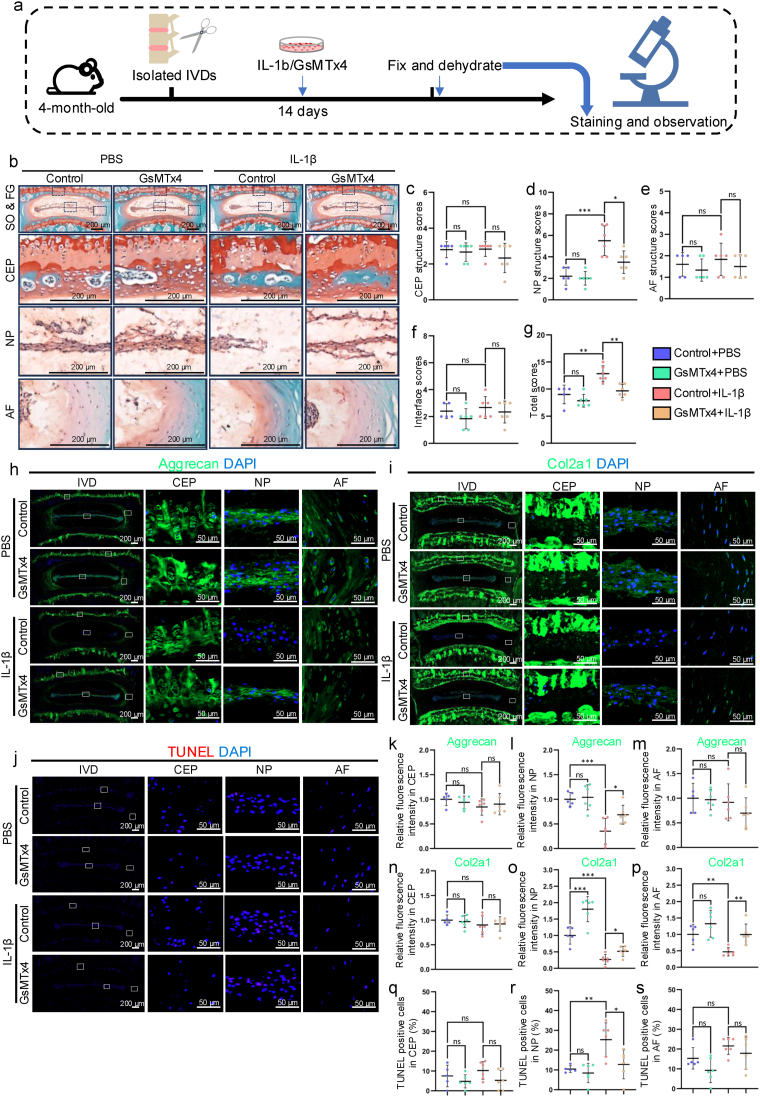
Materials and methods: To investigate the effects of disc-specific Piezo1 deletion, we generated Aggrecan CreERT2 ; Piezo1 fl/fl mice and examined both lumbar spine instability (LSI)- and aging-induced disc degeneration. Additionally, the effect of pharmacological inhibition of Piezo1 was evaluated using GsMTx4, a potent Piezo1 antagonist, in an ex vivo model stimulated with IL-1β to induce disc degeneration. Assessments included histological examinations, immunofluorescence, and western blot analyses to thoroughly characterize the alterations in the intervertebral discs.

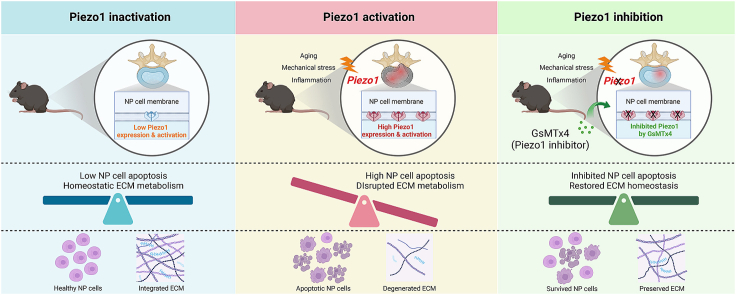
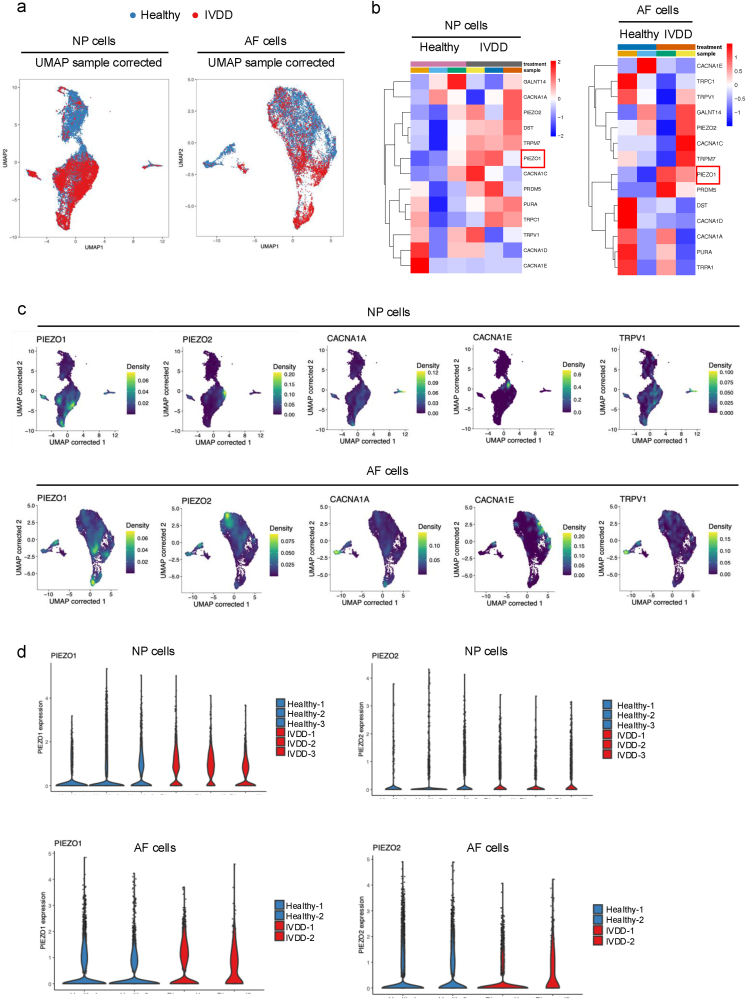
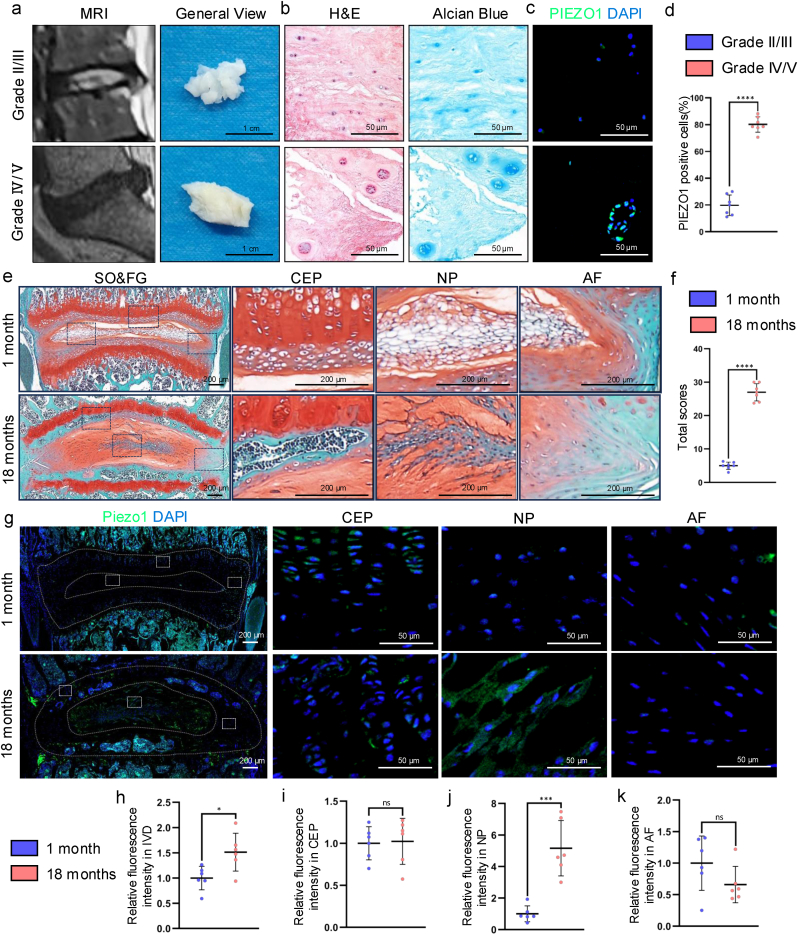
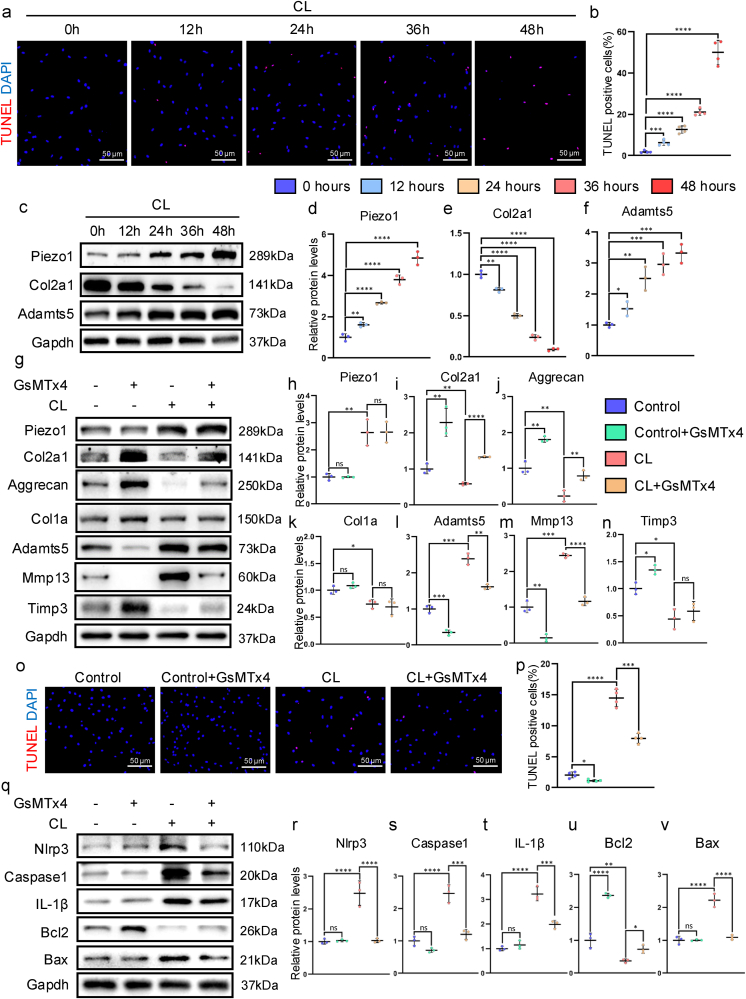
Results: Elevated expression of Piezo1 was detected in the nucleus pulposus (NP) of intervertebral discs with advanced disc degeneration in both aged mice and human patients. Inducible deletion of Piezo1 expression in aggrecan-expressing disc cells significantly reduced lumbar disc degeneration, decreased extracellular matrix (ECM) degradation, and lowered apoptosis in NP cells, observed in both aged mice and those undergoing LSI surgery. Excessive compression loading (CL) upregulated Piezo1 expression, induced ECM disruption, and increased apoptosis in NP cells, whereas inhibition of Piezo1 with GsMTx4 effectively mitigated these pathological changes. Furthermore, in ex vivo cultured mouse discs, GsMTx4 treatment significantly alleviated IL-1β-induced degenerative damages, restored ECM anabolism, and reduced apoptosis.

Conclusions: The findings suggest that Piezo1 plays a critical role in the development of disc degeneration and highlight its potential as a therapeutic target. Inhibiting Piezo1 could offer a novel strategy for treating or preventing this critical disease.

Translational potential of this article: This research highlights the involvement of Piezo1 in the development of intervertebral disc degeneration and emphasizes the potential for targeting Piezo1 as a therapeutic strategy to delay or reverse this condition.

Keywords: Aging; GsMTx4; Intervertebral disc degeneration; Lumbar spine instability; Piezo1.


Conflict of interest statement

The authors declare that they have no competing financial interests.

Figures

Image 1
Graphical abstract
Fig. 1
Fig. 1
scRNA expression analysis of PIEZO1 in human NP and AF cells across healthy and IVDD conditions. (a) Uniform Manifold Approximation and Projection (UMAP) visualization contrasting NP and AF cells from healthy individuals (colored blue) and patients with IVDD (colored red). Each point represents a single cell, with clear clustering based on health condition. (b) Heatmaps of differential expression for selected genes in NP and AF cells, both in healthy and IVDD states, include PIEZO1, PIEZO2, DST, PURA, TRPC1, TRPV1, CACNA1D, and CACNA1E. The heatmap uses a color gradient from blue (low expression) to red (high expression) to indicate variations in gene expression levels. (c) Density plots for gene expression in NP and AF cells use a blue to yellow gradient to represent the increasing density of cells expressing each gene, illustrating the gene expression distribution across both healthy and degenerated conditions within the sample-corrected UMAPs. (d) Expression levels of PIEZO1 and PIEZO2 in NP (upper panel) and AF (lower panel) cells from both healthy individuals and IVDD patients. Each dot represents the expression level in a single cell. Note: N = 3 per group for comparisons of NP cells between healthy controls and IVDD patients, and N = 2 per group for comparisons of AF cells between healthy controls and IVDD patients.
Fig. 2
Fig. 2
Upregulated expression of Piezo1 in degenerated IVDs. (a) Representative macroscopic views of NP tissues categorized by Pfirrmann grades. Scale bar: 1 cm. (b) Hematoxylin & eosin (H&E) and alcian blue staining of human NP samples. Scale bar: 50 μm. (c-d) Immunofluorescence (IF) staining for PIEZO1 in human NP samples. Scale bar: 50 μm. N = 7 biological replicates per group. (e-f) Safranin O and Fast Green (SO&FG) staining of lumbar IVDs from young (1-month-old) and aged (18-month-old) mice. Histological scoring provided. The black dashed box indicates regions magnified in subsequent images, focusing on the CEP, NP, and AF. Scale bar: 200 μm. N = 7 biological replicates per group. (g) IF staining for Piezo1 in lumbar IVDs from young and aged mice. The white dashed lines delineate the entire IVD (outer line) and the NP region (inner line). N = 6 biological replicates per group. (h-k) Quantitative analysis of Piezo1 fluorescence intensity in overall IVDs and individual subregions (CEP, NP, AF). Analysis regions are highlighted with white dashed boxes. Scale bars: 200 μm and 50 μm for magnified regions. N = 6 biological replicates per group. ∗p < 0.05, ∗∗p < 0.01, ∗∗∗p < 0.001, ∗∗∗∗p < 0.0001.
Fig. 3
Fig. 3
Effects of Piezo1 depletion on LSI-induced IVDD in mice. (a) Schematic of the experimental setup for the mouse LSI model. (b-g) SO&FG staining of lumbar IVDs in Piezo1-intact (control) and Piezo1-conditional knockout (cKO) mice with and without LSI induction. Histological evaluations are included. The black dashed boxes indicate areas of detailed magnification, showcasing the CEP, NP, and AF. Scale bar: 200 μm. N = 6 biological replicates per group. (h-j) IF staining for collagen type II alpha 1 chain (Col2a1) and matrix metallopeptidase 13 (Mmp13) in lumbar IVDs of control and cKO mice, both with and without LSI. Scale bar: 50 μm. N = 6 biological replicates per group. (k-l) TUNEL assay depicting apoptosis in lumbar IVDs. Scale bar: 50 μm. N = 6 biological replicates per group. ∗p < 0.05, ∗∗p < 0.01, ∗∗∗p < 0.001, ∗∗∗∗p < 0.0001.
Fig. 4
Fig. 4
Piezo1 depletion alleviates spontaneous IVDD in aging mice. (a) Schematic illustration of the experimental design. (b-g) SO&FG staining of lumbar IVDs in 12-month-old and 18-month-old mice. Histological scores are provided. The black dashed box highlights magnified regions, including the CEP, NP, and AF. Scale bar: 200 μm. N = 6 biological replicates per group. (h-l) IF staining for aggrecan, Col2a1, Mmp13, and a disintegrin and metalloproteinase with thrombospondin motifs 5 (Adamts5) in lumbar discs from 18-month-old control and cKO mice. Scale bar: 50 μm. N = 6 biological replicates per group. (m-n) TUNEL staining in lumbar discs, with the white dashed box indicating the magnified area of the NP. Scale bar: 50 μm. N = 6 biological replicates per group. ∗p < 0.05, ∗∗p < 0.01, ∗∗∗p < 0.001, ∗∗∗∗p < 0.0001.
Fig. 5
Fig. 5
Effects of compression loading on Piezo1 expression and its inhibition by GsMTx4 on apoptosis and ECM metabolism of NP Cells.(a-b) TUNEL staining and statistical analysis of NP cells under compression loading (CL) treatment from 0 to 48 h. Scale bar: 50 μm. N = 4 biological replicates per group. (c-f) Western blot analysis and statistical evaluation of Piezo1, Col2a1, and Adamts5 expression in NP cells. Scale bar: 50 μm. N = 3 biological replicates per group. (g-n) Western blot analysis and statistical evaluation of Piezo1, Col2a1, and Adamts5 expression in NP cells pre-treated with 4 μM GsMTx4, followed by treatments with or without CL. N = 3 biological replicates per group. (o-p) TUNEL staining and statistical analysis of apoptosis in NP cells. N = 4 biological replicates per group. (q-v) Western blot analysis and statistical evaluation of Nlrp3, Caspase1, IL-1β, Bcl2, and Bax expression in NP cells. N = 3 biological replicates per group. ∗p < 0.05, ∗∗p < 0.01, ∗∗∗p < 0.001, ∗∗∗∗p < 0.0001.
Fig. 6
Fig. 6
GsMTx4 attenuates ECM degradation and apoptosis in NP cells. (a) Schematic diagram of the isolation and ex vivo culture of mouse lumbar IVDs. (b-g) SO&FG staining and histological evaluation of isolated IVDs treated with or without IL-1β and GsMTx4. Black dashed boxes highlight magnified areas focusing on the CEP, NP, and AF. Scale bar: 200 μm. N = 5 biological replicates for control-PBS group, and N = 6 biological replicates for the other groups. (h) IF staining of aggrecan. White dashed boxes highlight magnification areas, showing the CEP, NP, and AF. Scale bars: 200 μm and 50 μm. (i) IF staining of Col2a1. (j) TUNEL staining. (k-p) Fluorescence intensity analysis of aggrecan and Col2a1. (q-s) Statistical analysis of the proportion of apoptotic cells. ∗p < 0.05, ∗∗p < 0.01, ∗∗∗p < 0.001, ∗∗∗∗p < 0.0001.

Similar articles

Cited by

References

    1. Xu J.N., Shao T., Lou J.F., Zhang J., Xia C. Aging, cell senescence, the pathogenesis and targeted therapies of intervertebral disc degeneration. Front Pharmacol. 2023;14 - PMC - PubMed
    1. Kos N., Gradisnik L., Velnar T. A brief review of the degenerative intervertebral disc disease. Med Arch. 2019;73(6):421. - PMC - PubMed
    1. Urban J.P.G., Roberts S. Degeneration of the intervertebral disc. Arthritis Res Ther. 2003;5(3):120–130. - PMC - PubMed
    1. Roberts S., Evans H., Trivedi J., Menage J. Histology and pathology of the human intervertebral disc. JBJS. 2006;88a(suppl_2):10–14. - PubMed
    1. Kepler C.K., Ponnappan R.K., Tannoury C.A., Risbud M.V., Anderson D.G. The molecular basis of intervertebral disc degeneration. Spine J. 2013;13(3):318–330. - PubMed

LinkOut - more resources