. 2025 Feb 21;33(1):101438.
doi: 10.1016/j.omtm.2025.101438. eCollection 2025 Mar 13.

Highly efficient in vivo hematopoietic stem cell transduction using an optimized self-complementary adeno-associated virus

Affiliations

Highly efficient in vivo hematopoietic stem cell transduction using an optimized self-complementary adeno-associated virus

Carsten T Charlesworth et al. Mol Ther Methods Clin Dev. .

Abstract

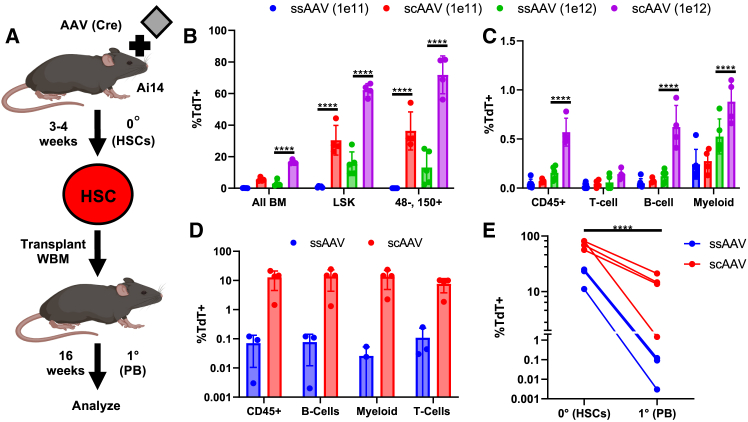
In vivo gene therapy targeting hematopoietic stem cells (HSCs) holds significant therapeutic potential for treating hematological diseases. This study uses adeno-associated virus serotype 6 (AAV6) vectors and Cre recombination to systematically optimize the parameters for effective in vivo HSC transduction. We evaluated various genetic architectures and delivery methods of AAV6, establishing an optimized protocol that achieved functional recombination in more than two-thirds of immunophenotypic HSCs. Our findings highlight that second-strand synthesis is a critical limiting factor for transgene expression in HSCs, leading to significant under-detection of HSC transduction with single-stranded AAV6 vectors. We also demonstrate that HSCs in the bone marrow (BM) are readily accessible to transduction, with neither localized injection nor mobilization of HSCs into the bloodstream, enhancing transduction efficacy. Additionally, we observed a surprising preference for HSC transduction over other BM cells, regardless of the AAV6 delivery route. Together, these findings not only underscore the potential of AAV vectors for in vivo HSC gene therapy but also lay a foundation that can inform the development of both in vivo AAV-based HSC gene therapies and potentially in vivo HSC gene therapies that employ alternative delivery modalities.

Keywords: AAV; HSC; adeno-associated virus; bone marrow transduction; genetic hematological disease; in vivo gene therapy; second-strand synthesis; self-complementary; systemic delivery; targeted integration.


Conflict of interest statement

H.N. is a co-founder of and shareholder in Megakaryon, and Century Therapeutics. A.C.W. is a consultant for ImmuneBridge. A.C. discloses financial interests in the following entities working in the rare genetic disease space: Beam Therapeutics, Diantus Therapeutics, Editas Medicines, GV, Inograft Biotherapeutics, Jasper Therapeutics, Kyowa Kirin, Prime Medicine, Rocket Pharmaceuticals, STRM.Bio, Spotlight Therapeutics, and Teiko Bio. However, none of these companies had input into the design, execution, interpretation, or publication of the work in this manuscript.

Figures

None
Graphical abstract
Figure 1
Figure 1
AAV6 preferentially transduces HSPCs in the BM at high doses (A) Schematic outlining the experimental procedure for determining if AAV6 can transduce HSCs in vivo using Ai14 mice. (B) Representative FACS plots showing gating for TdT+ positive cells in the general BM population and Lin-Sca1+Kit+ HSPCs (LSK) after injection AAV6-Cre vectors into Ai14 mice. (C) Bar graph showing the frequency of TdT+ cells in the BM of Ai14 mice after RO injection of AAV6 Cre at a dose of 1e11 vg or 1e12 vg (ANOVA, n = 5; mean ± SD). (D) Bar graph showing the frequency of TdT+ PB cell types 3–4 weeks after RO injection of AAV6 Cre (n = 5; mean ± SD). (E) Representative images of liver sections taken from mice injected with AAV6-Cre compared with controls. DAPI-stained nuclei are shown in blue, cells expressing TdT are shown in red. Scale bar, 100 μm. (F) Bar graph showing the frequency of TdT+ cells in the livers of mice injected with AAV6-Cre (t test; n = 5; mean ± SD). ∗∗p < 0.01, ∗∗∗∗p < 0.0001.
Figure 2
Figure 2
HSPCs are directly accessible to transduction in the BM (A) Schematic showing the different locations where AAV6-Cre vectors were injected into mice. (B) Bar graph showing the frequency of recombination in the BM of mice injected with AAV6-Cre by RO compared with caudal artery injection (ANOVA; n = 3–6; mean ± SD). (C) Bar graph comparing the frequency of TdT+ cells in the BM of mice injected with AAV6-Cre. RO delivery was compared with direct injection into the BM (femur) of mice, frequencies of TdT+ cells in the BM were also compared between the injected femur and non-injected femur (ANOVA; n = 6; mean ± SD). (D) Schematic showing the procedure to mobilize HSCs before injection of AAV6-Cre vectors into mice. Black arrows indicate the days on which mice were injected with reagents. (E) Representative FACS plots of PB staining for lineage (top) and LSK HSPCs (bottom) after mobilization. (F) Bar graph comparing the frequency of TdT+ cells in the BM of mice whose HSPCs were (mobilized) or were not (unmobilized) by treatment with GCSF and Plerixafor, before injection of AAV6-Cre vectors (ANOVA; n = 5–6; mean ± SD). (G) Bar graph comparing the frequency of Lin cells in the PB of mice that were treated with GCSF and Plerixafor compared with mice that were not (t test; n = 3–6; mean ± SD). (H) Bar graph comparing the frequency of LSK cells in the PB of mice that were treated with GCSF and Plerixafor compared with mice that were not (t test; n = 3–6; mean ± SD). ∗p < 0.05, ns = not significant.
Figure 3
Figure 3
A genetically optimized AAV6 vector to detect transduction in HSCs (A) Schematic outlining the procedure to compare the efficacy of different AAV6 constructs in expression of GFP, in expanded C57BL6/j HSCs in vitro. (B) Representative FACS plots from screening different AAV6 vectors for GFP expression in HSCs when AAV6 was added to cells at a dose of 1e5 vg/cell. (C) Schematic showing the design of different AAV6 cassettes to assess GFP expression and the difference in the genetic architecture of ssAAV vectors compared with scAAV vectors. (D) Bar graph showing the results from screening different ssAAV6 vectors on mouse HSCs in vitro for GFP expression (ANOVA; n = 3; mean ± SD). (E) Bar graph comparing the expression GFP from ssAAV and scAAV with the same optimized AAV6 genetic architecture (SFFV-GFP-SV40), 1e5 vg/cell of virus was used (t test; n = 3–6; mean ± SD). (F) Bar graph comparing the ability of optimized ssAAV and scAAV Cre expression vectors (SFFV-Cre-bGH) for their ability to induce recombination in Ai14 HSCs across a dose titration in vitro (ANOVA; n = 7; mean ± SD). ∗p < 0.05, ∗∗∗∗p < 0.0001.
Figure 4
Figure 4
scAAV vectors demonstrate that significantly more HSPCs are transduced by AAV6 in vivo than is detected using ssAAV vectors (A) Schematic outlining the experiments. Ai14 mice were injected with scAAV vectors and the ability of scAAV vectors to transduce cells was compared with ssAAV vectors 3–4 weeks after injection. To confirm that true HSCs were transduced by AAV6 WBM from injected mice was then transplanted into irradiated recipients and PB analyzed 16 weeks later. (B) Bar graph showing the frequency of TdT+ cells in the BM of mice injected with either ssAAV-Cre or scAAV-Cre at a dose of 1e11 or 1e12 vg/mouse (ANOVA; n = 4–5; mean ± SD). (C) Bar graph showing the frequency of TdT+ cells in the PB of mice injected with either ssAAV-Cre or scAAV-Cre at a dose of 1e11 or 1e12 vg/mouse (ANOVA; n = 4–5; mean ± SD). (D) Bar graph showing the frequency of TdT+ cells in the PB of mice transplanted with BM from Ai14 mice injected with AAV-Cre at a dose of 1e12 vg, 16 weeks after transplantation (n = 3–4; mean ± SD). (E) Line graph comparing the frequency of LSK, CD48, CD150+ TdT+ cells in the BM of mice that received 1e12 vg of AAV (0°) to the frequency of CD45+, TdT+ cells in the PB of transplant recipients 16 weeks after transplantation (1°) (ANOVA; n = 3–4).∗∗∗p < 0.0001.
Figure 5
Figure 5
Saturation of the liver and systemic delivery to the body of AAV6 vectors at high doses (A) Representative images of TdT fluorescence in Ai14 mice 3.5 weeks after injection with scAAV6 vectors. White dotted lines indicate the outline of mice in the image. (B) Bar graph comparing the difference in whole body fluorescence intensity of Ai14 mice injected with scAAV vectors at different doses compared with untreated control Ai14 mice (t test; n = 2–4; mean ± SD). (C) Representative images of liver sections from mice injected with scAAV6 vectors at different doses compared with control Ai14 mice. Blue indicates DAPI stained nuclei, red indicates cells expressing TdT. Scale bars, 100μm. (D) Bar graph showing the frequency of TdT+ cells in the liver of mice treated with scAAV at a dose of 1e11 or 1e12 vg/mouse (n = 4; mean ± SD). ∗p < 0.05.

References

    1. Charlesworth C.T., Hsu I., Wilkinson A.C., Nakauchi H. Immunological barriers to haematopoietic stem cell gene therapy. Nat. Rev. Immunol. 2022;22:719–733. doi: 10.1038/s41577-022-00698-0. - DOI - PMC - PubMed
    1. Aiuti A., Roncarolo M.G., Naldini L. Gene therapy for ADA-SCID, the first marketing approval of an ex vivo gene therapy in Europe: paving the road for the next generation of advanced therapy medicinal products. EMBO Mol. Med. 2017;9:737–740. doi: 10.15252/emmm.201707573. - DOI - PMC - PubMed
    1. Wilkinson A.C., Dever D.P., Baik R., Camarena J., Hsu I., Charlesworth C.T., Morita C., Nakauchi H., Porteus M.H. Cas9-AAV6 gene correction of beta-globin in autologous HSCs improves sickle cell disease erythropoiesis in mice. Nat. Commun. 2021;12:686. doi: 10.1038/s41467-021-20909-x. - DOI - PMC - PubMed
    1. Zeng J., Wu Y., Ren C., Bonanno J., Shen A.H., Shea D., Gehrke J.M., Clement K., Luk K., Yao Q., et al. Therapeutic base editing of human hematopoietic stem cells. Nat. Med. 2020;26:535–541. doi: 10.1038/s41591-020-0790-y. - DOI - PMC - PubMed
    1. Frangoul H., Altshuler D., Cappellini M.D., Chen Y.S., Domm J., Eustace B.K., Foell J., de la Fuente J., Grupp S., Handgretinger R., et al. CRISPR-Cas9 Gene Editing for Sickle Cell Disease and beta-Thalassemia. N. Engl. J. Med. 2021;384:252–260. doi: 10.1056/NEJMoa2031054. - DOI - PubMed