. 2025 Mar 10:15:1479795.
doi: 10.3389/fcimb.2025.1479795. eCollection 2025.

Urinary microbiota changes among NMIBC patients during BCG therapy: comparing BCG responders and non-responders

Affiliations

Urinary microbiota changes among NMIBC patients during BCG therapy: comparing BCG responders and non-responders

Toni Boban et al. Front Cell Infect Microbiol. .

Abstract

The gold standard for treating high-risk non-muscle-invasive bladder cancer involves the transurethral removal of cancerous tissue followed by BCG immunotherapy. So far, there is no reliable biomarker for predicting BCG efficacy and identifying patients who will or will not respond to BCG treatment. Emerging evidence suggests that urinary microbiota may play a crucial role in BCG efficacy. This study aimed to explore (i) changes in urinary microbiota during the six induction cycles of BCG and (ii) its potential predictive role in determining the outcome of BCG treatment. To this end, catheterized urine samples were collected before each of the six BCG doses and bacterial composition was analyzed using 16S rRNA gene sequencing. Patient inclusion criteria were male gender, no previous history of urothelial cancer, no other malignancies, no active infection, and no antibiotic usage for at least 20 days before the first BCG dose. We observed a significant decrease in biodiversity, measured by the Shannon Index, during the first week of therapy in 10 out of 12 patients (p=0.021). Additionally, differences in microbiota composition before the start of BCG therapy were noted between responders and non-responders to BCG therapy. Non-responders exhibited a 12 times higher abundance of genus Aureispira (p<0.001), and, at the species level, a 27-fold lower abundance of Negativicoccus succinivorans (p<0.001). Throughout the treatment, the abundance of the genus Aureispira decreased, showing an eightfold reduction by the end of therapy among non-responders (p<0.001). Our findings suggest that urinary microbiota plays an active role before and during the course of BCG therapy. However, this is a preliminary study, and further research involving larger patient cohorts is needed.

Keywords: BCG; immunotherapy; non-muscle invasive bladder cancer; response to therapy; urinary microbiome.


Conflict of interest statement

The authors declare that the research was conducted in the absence of any commercial or financial relationships that could be construed as a potential conflict of interest.

Figures

Figure 1
Figure 1
(A) Funnel plot of all patients with NMIBC recruited for the study and the exclusion criteria used for the selection of the final cohort. (B) Figure scheme of the sample collection of catheterized urine prior to each of the six induction BCG instillations.
Figure 2
Figure 2
(A, B) Relative abundance of bacterial genera in all patients individually (A) and grouped (B) in six different timepoints before and during the BCG induction therapy. (C) Relative abundance of bacterial genera in patients grouped by response to therapy and shown at six different timepoints in the BCG induction therapy. (D, E) Relative abundance of bacterial phyla in all patients (D) and patients grouped by response to therapy (E) and shown at six different timepoints in the BCG induction therapy. (T0-T5—therapy timepoints, R—responders to therapy, NR—non-responders to therapy, LFU—patient with limited 10-month follow-up of no cancer recurrence).
Figure 3
Figure 3
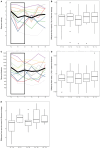
(A) Biodiversity as measured with Shannon Index in different timepoints. Each line represents alpha diversity volatility throughout six timepoints for one patient. Thick black line represents mean values. (B) Difference in Shannon Index from baseline value (week 0) in later timepoints. (C) Number of observed bacterial features (measure of species richness) in different timepoints. (D) Difference in observed bacterial features from baseline value (week 0) in later timepoints. (E) Difference in Shannon entropy from a previous week. Rectangles in (A, C) were added to highlight where significant changes in biodiversity measures were found.
Figure 4
Figure 4
Differential abundance analysis (ANCOMBC2) of urine samples between patients grouped by response to therapy: (A) before the onset of the therapy (T0) at genus and species levels and (B) at the end of the therapy (T5) at genus and species levels. The values shown in the figure are expressed as the logarithm base 2 of the fold change value (Log2FC). The results are represented as either positive or negative, depending on whether there is an increase or decrease in the abundance, respectively. LFC—logarithm base 2 of the fold change value.
Figure 5
Figure 5
Differential abundance analysis of urine samples between therapy timepoints in patients who responded to therapy (responders) on species level (ANCOMBC2 analysis). The values shown in the figure are expressed as the logarithm base 2 of the fold change value (Log2FC). The results are represented as either positive or negative, depending on whether there is an increase or decrease in the abundance, respectively, relative to the starting point before the onset of the therapy (T0). LogFC—logarithm base 2 of the fold change value.
Figure 6
Figure 6
Differential abundance analysis of urine samples between therapy timepoints in patients who did not respond to therapy (non-responders) on (A) genus and (B) species levels (ANCOMBC2 analysis). The values shown in the figure are expressed as the logarithm base 2 of the fold change value (Log2FC). The results are represented as either positive or negative, depending on whether there is an increase or decrease in the abundance, respectively, relative to the starting point before the onset of the therapy (T0). LogFC—logarithm base 2 of the fold change value.

References

    1. Bokulich N. A., Kaehler B. D., Rideout J. R., Dillon M., Boylen E., Knight R., et al. . (2018). Optimizing taxonomic classification of marker-gene amplicon sequences with QIIME 2’s q2-feature-classifier plugin. Microbiome 6, 90. doi: 10.1186/s40168-018-0470-z - DOI - PMC - PubMed
    1. Bolyen E., Rideout J. R., Dillon M. R., Bokulich N. A., Abnet C. C., Al-Ghalith G. A., et al. . (2019). Reproducible, interactive, scalable and extensible microbiome data science using QIIME 2. Nat. Biotechnol. 37 (8), 852–857. doi: 10.1038/s41587-019-0209-9 - DOI - PMC - PubMed
    1. Bučević Popović V., Šitum M., Chow C. T., Chan L. S., Roje B., Terzić J. (2018). The urinary microbiome associated with bladder cancer. Sci. Rep. 8, 12157. doi: 10.1038/s41598-018-29054-w - DOI - PMC - PubMed
    1. Callahan B. J., McMurdie P. J., Rosen M. J., Han A. W., Johnson A. J., Holmes S. P. (2016). DADA2: High-resolution sample inference from Illumina amplicon data. Nat. Methods 13, 581–583. doi: 10.1038/nmeth.3869 - DOI - PMC - PubMed
    1. Calvigioni M., Biancalana E., Mazzantini D., Celandroni F., Rossi C., Mengozzi A., et al. . (2024). In-depth microbiological characterization of urine from subjects with type 2 diabetes. J. Clin. Endocrinol. Metab. 110, 185–194. doi: 10.1210/clinem/dgae389 - DOI - PMC - PubMed

MeSH terms

LinkOut - more resources