. 2025 Mar 10:16:1550699.
doi: 10.3389/fimmu.2025.1550699. eCollection 2025.

Interleukin-27-polarized HIV-resistant M2 macrophages are a novel subtype of macrophages that express distinct antiviral gene profiles in individual cells: implication for the antiviral effect via different mechanisms in the individual cell-dependent manner

Affiliations

Interleukin-27-polarized HIV-resistant M2 macrophages are a novel subtype of macrophages that express distinct antiviral gene profiles in individual cells: implication for the antiviral effect via different mechanisms in the individual cell-dependent manner

Tomozumi Imamichi et al. Front Immunol. .

Abstract

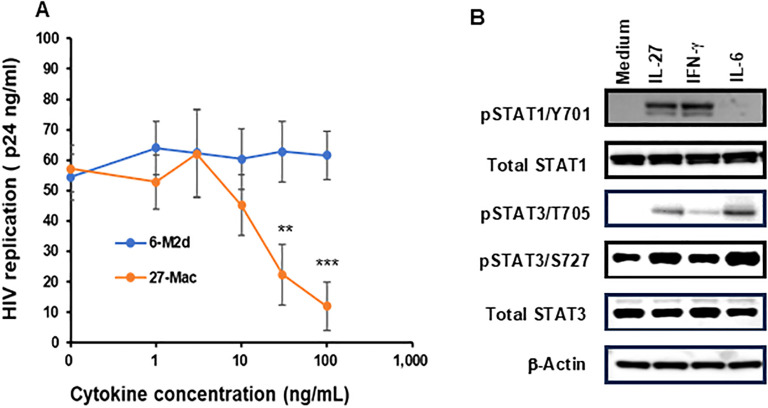
Introduction: Interleukin (IL)-27 is an anti-viral cytokine. IL-27-treated monocyte-derived macrophages (27-Mac) suppressed HIV replication. Macrophages are generally divided into two subtypes, M1 and M2 macrophages. M2 macrophages can be polarized into M2a, M2b, M2c, and M2d by various stimuli. IL-6 and adenosine induce M2d macrophages. Since IL-27 is a member of the IL-6 family of cytokines, 27-Mac was considered M2d macrophages. In the current study, we compared biological function and gene expression profiles between 27-Mac and M2d subtypes.

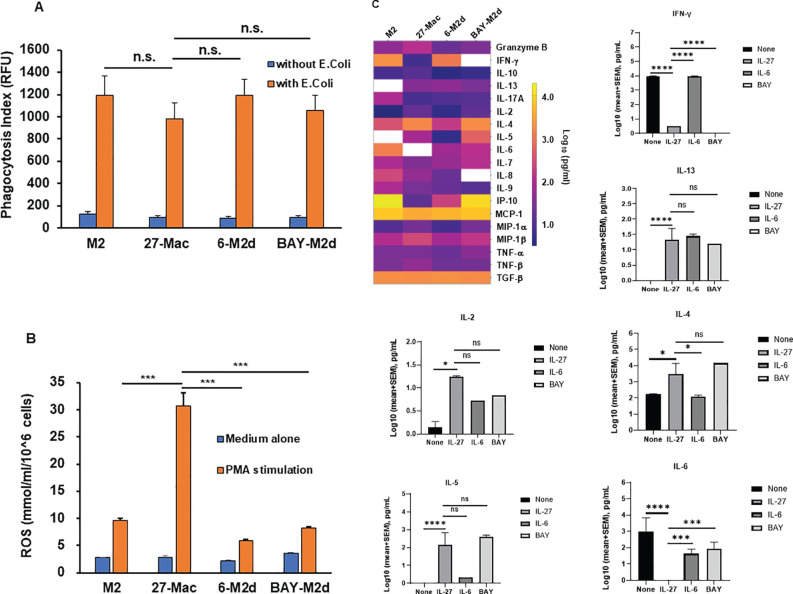
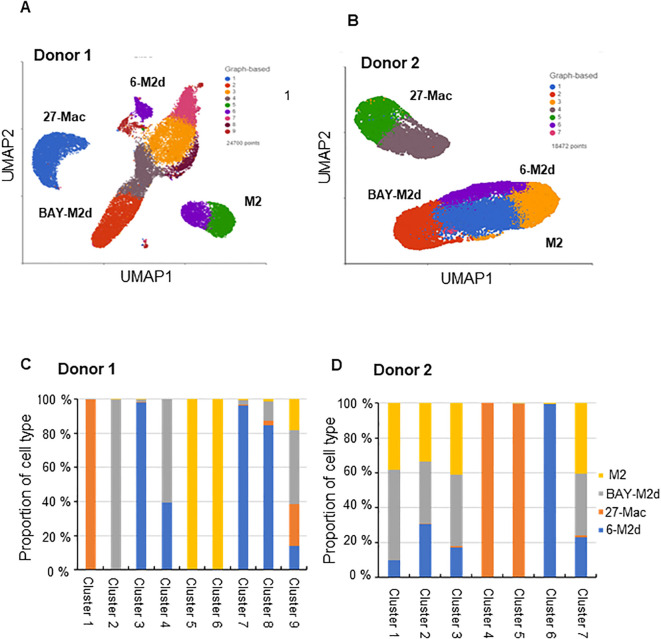
Methods: Monocytes derived from health donors were differentiated to M2 using macrophage colony-stimulating factor. Then, the resulting M2 was polarized into different subtypes using IL-27, IL-6, or BAY60-658 (an adenosine analog). HIV replication was monitored using a p24 antigen capture assay, and the production of reactive oxygen species (ROS) was determined using a Hydrogen Peroxide Assay. Phagocytosis assay was run using GFP-labeled opsonized E. coli. Cytokine production was detected by the IsoPlexis system, and the gene expression profiles were analyzed using single-cell RNA sequencing (scRNA-seq).

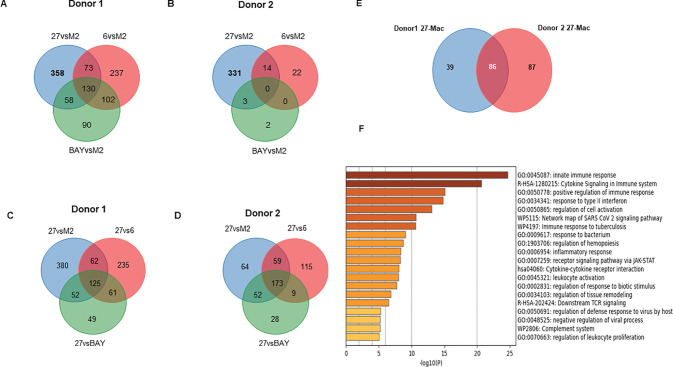
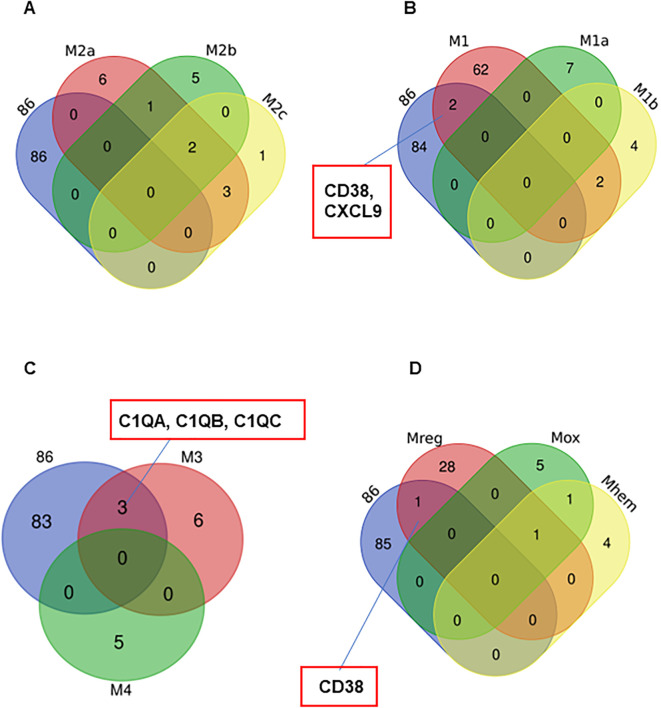
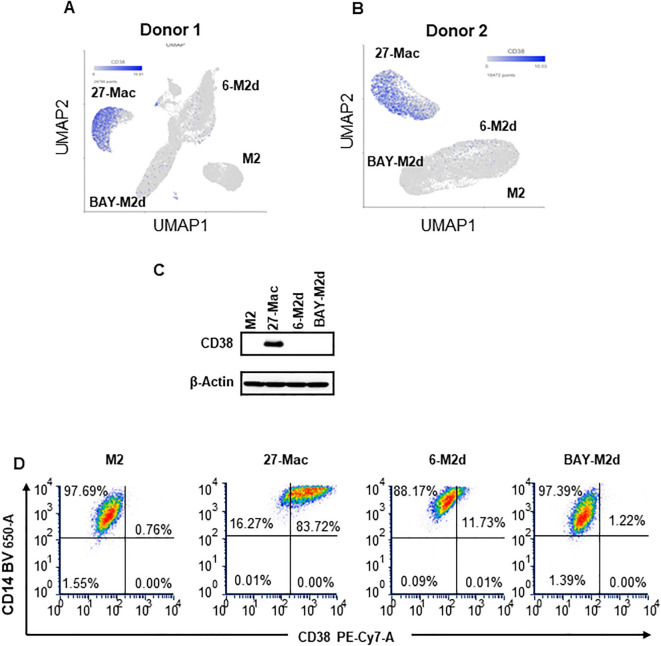
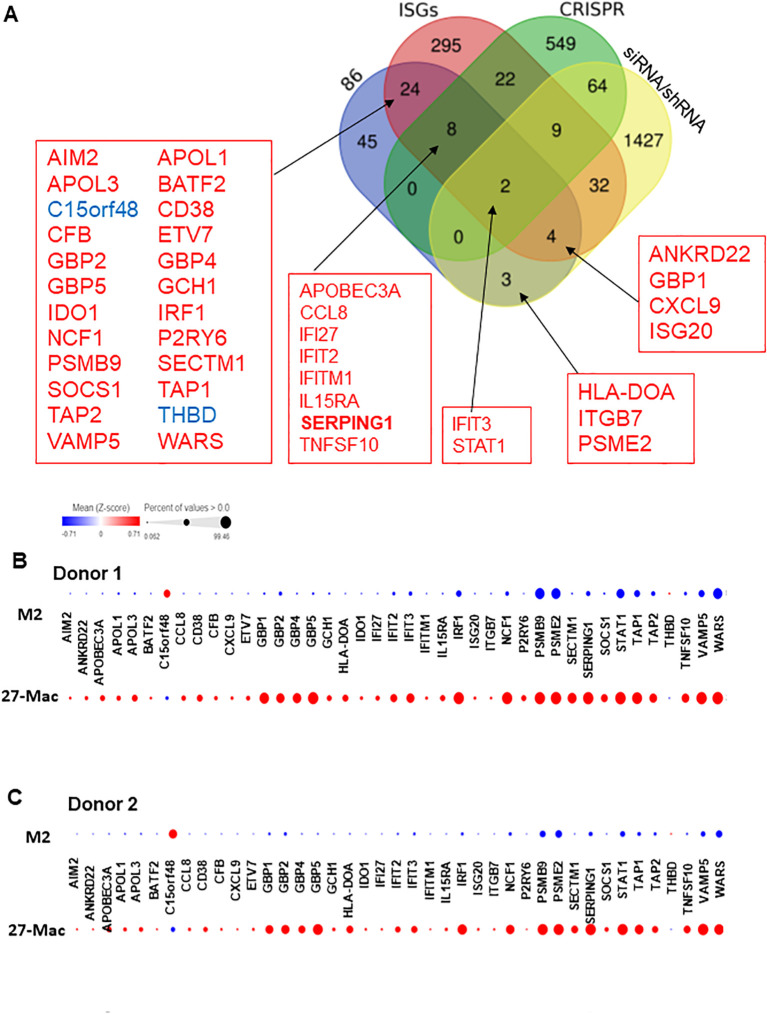
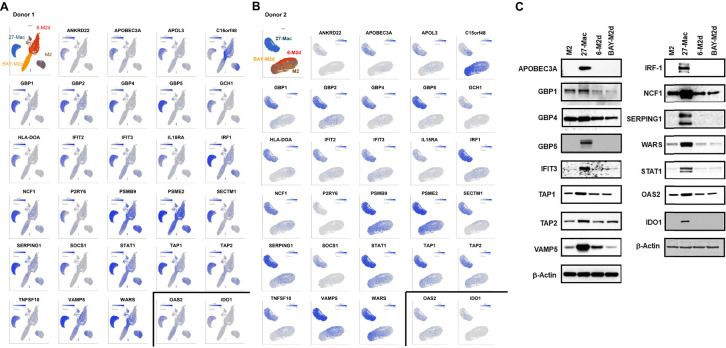
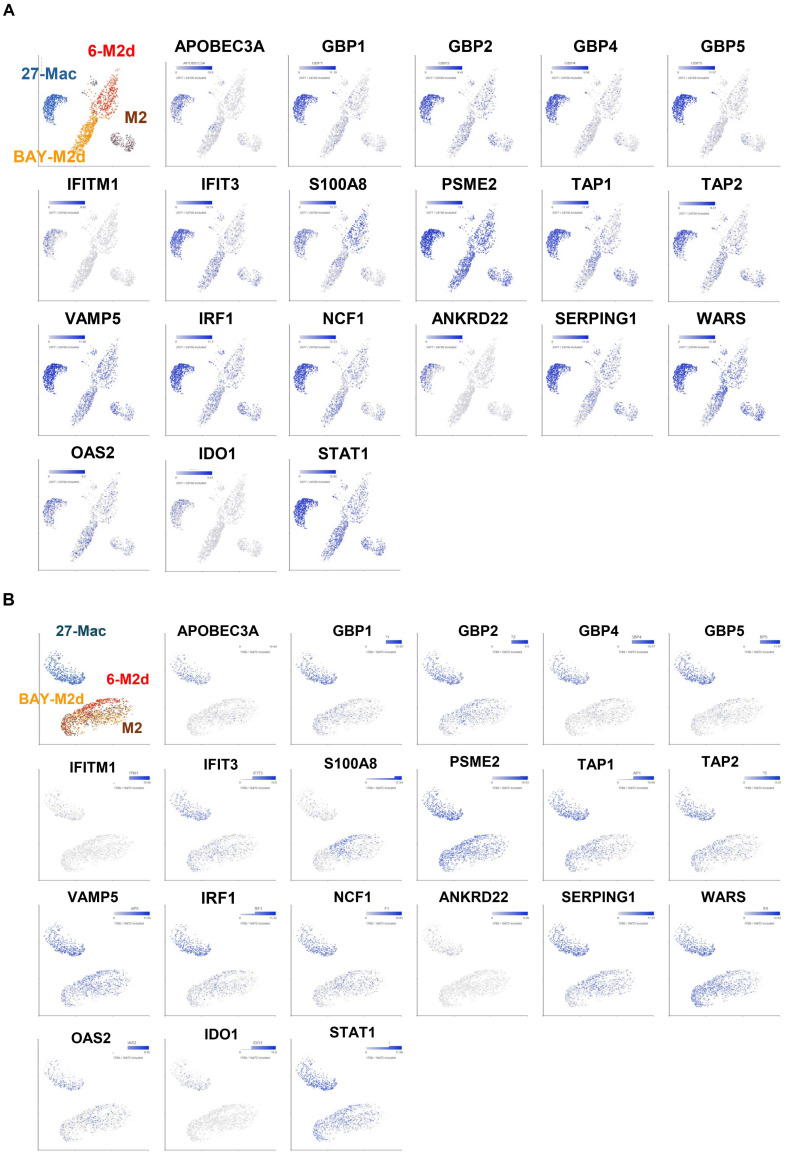
Results and discussion: 27-Mac and BAY60-658-polarized M2d (BAY-M2d) resisted HIV infection, but IL-6-polarized M2d (6-M2d) lacked the anti-viral effect. Although phagocytosis activity was comparable among the three macrophages, only 27-Mac, but neither 6-M2d nor BAY-M2d, enhanced the generation of ROS. The cytokine-producing profile of 27-Mac did not resemble that of the two subtypes. The scRNA-seq revealed that 27-Mac exhibited a different clustering pattern compared to other M2ds, and each 27-Mac expressed a distinct combination of anti-viral genes. Furthermore, 27-Mac did not express the biomarkers of M2a, M2b, and M2c. However, it significantly expressed CD38 (p<0.01) and secreted CXCL9 (p<0.001), which are biomarkers of M1.

Conclusions: These data suggest that 27-Mac may be classified as either an M1-like subtype or a novel subset of M2, which resists HIV infection mediated by a different mechanism in individual cells using different anti-viral gene products. Our results provide a new insight into the function of IL-27 and macrophages.

Keywords: M2 macrophages; anti-viral genes; interleukin-27; polarization; scRNA seq.


Conflict of interest statement

Author AA was employed by the company Septem-Soken. The remaining authors declare that the research was conducted in the absence of any commercial or financial relationships that could be construed as a potential conflict of interest. The author(s) declared that they were an editorial board member of Frontiers, at the time of submission. This had no impact on the peer review process and the final decision.

Figures

Figure 1
Figure 1
Comparison of HIV inhibitory effects of IL-27, IL-6, and adenosine receptor agonist-polarized M2 macrophages. (A) M2 macrophages were polarized in the presence of different concentrations of IL-6 or IL-27 for 3 days. The polarized cells were then infected with HIVAD8 as described in Materials and Methods and then cultured for 14 days. HIV replication was monitored using the p24 HIV antigen ELISA kit. (B) The STAT activation profile was compared. M2 macrophages were incubated with medium alone, 100 ng/mL IL-27, 100 ng/mL IFN-γ or 30 ng/mL IL-6 for 15 min, and then Western blotting was performed to measure the phosphorylation status of STAT-1 and STAT-3 in the cells. For each phosphorylated STAT measured, the unphosphorylated total protein was also measured. β-Actin was measured as a loading control. Data are mean ± SD (n = 4). IFN-γ **<0.01, ***<0.001.
Figure 2
Figure 2
Adenosine analog-polarized macrophages suppress HIV infection. Evaluation of the anti-HIV effect among cells polarized with different adenosine receptor agonists. M2 macrophages were cultured for 3 days with different concentrations (0–10 μM) of adenosine receptor agonists. The agonists used for A1AR and A2aaAR were CGS 21680 (CCPA) and CGS 21680 (CGS), respectively; the agonist used for A2bR was BAY60-6583 (BAY); the agonist used for AR3 was IB-MECA/CF-101 (IB). The polarized cells were then infected with HIVAD8 and cultured for 14 days. HIV replication was monitored by p24 antigen ELISA. Results are representative of data from three independent experiments. (E and F) Evaluation of phagocytic activity and ROS-inducing activity of cells polarized with different stimuli. M2 macrophages were cultured for 3 days in the presence of medium alone, 100 ng/mL IL-27, 30 ng/mL IL-6, and 10 μM of BAY. ROS, reactive oxygen species. **: p<0.01, ***: p<0.001, ****:p<0.0001.
Figure 3
Figure 3
Comparison of phagocytic activity, ROS-inducing activity, and cytokine production among 27-Mac, 6-M2d, and BAY-M2d. M2 macrophages were cultured for 3 days in the presence of medium alone, 100 ng/mL IL-27, 30 ng/mL IL-6, and 10 μM of BAY. Then, (A) the polarized cells were cultured with or without GFP-labeled opsonized Escherichia coli (T:E ratio at 10) for 2 hrs at 37°C. The cells were washed, and the uptake of E. coli was determined using a fluorescence plate reader. Results are representative of three independent assays. Data are mean ± SD (n = 4). (B) Polarized cells were washed with D-PBS-glucose (PBS-G) and then stimulated with 100 nM PMA in PBS-G for 30 min at 37°C in the presence of Amplex Red Hydrogen Peroxide/Peroxidase Assay Reagent. Induced ROS amounts were determined as described in Materials and Methods. All assays were run in quadruplicate, and results are representative of data from three independent assays. (C) Macrophages from five independent donors were polarized for 3 days in the presence of D10 medium alone, 100 ng/mL IL-27, 30 ng/mL IL-6, or 10 μM of BAY, and then culture supernatants were collected. The cell-free culture supernatants were subjected to cytokine assay using the IsoPlexis Human Adaptive Immune Panel Kit for detecting IFN-γ IL-10, IL-13, IL-17A, IL-2, IL-4, IL-5, IL-6, IL-7, IL-8, IL-9, IP-10, MCP-1, MIP-α, MIP-1β, TNF-α, and TNF-β, and TGF-β ELISA Kit for TGF-β. The results (log pg/mL) were displayed by means of a heat map. White boxes indicate no cytokine detection. Bar graphs show each cytokine production with statistical analysis using one-way ANOVA. *p < 0.05, ***p<0.001, ****p<0.0001 and n.s., not significant. ROS, reactive oxygen species; GFP, green fluorescent protein; PBS, phosphate-buffered saline; PMA, phorbol myristate acetate.
Figure 4
Figure 4
Single-cell RNA sequence analysis. The scRNA-Seq using fresh M2 macrophages, 27-Mac, 6-M2d, and BAY-M2d derived from two independent donors, Donor 1 (A, C) and Donor 2 (B, D), was conducted as described in Materials and Methods. (A, B) UMAP was used for clustering and visualization; (C, D) the bar plots show the cell count in the graph-based cluster for each subtype. The cells with similar gene expression profiles were clustered closer together using PCA and graph-based clustering. Macrophages from Donor 1 and Donor 2 were distributed in a total of nine and six clusters, respectively. UMAP, Uniform Manifold Approximation and Projection; PCA, principal component analysis.
Figure 5
Figure 5
Comparison of the gene expression profiles among M2, 27-Mac, 6-M2d, and BAY-M2d. (A, B) To identify DEGs in each polarized cell of Donors 1 and Donor 2, gene expression profiles in each subset were compared to those in M2 macrophages using Venn diagram analysis. (C, D) To identify DEGs that are uniquely expressed in 27-Mac of Donor 1 (C) and Donor 2 (D) compared to polarized cells, a Venn diagram analysis was performed among DEGs of 27-Mac compared to f M2 (27vsM2), 27-Mac compared to 6-Mac (27vs6), and 27-Mac compared to BAY-M2d (27vsBAY). (E) A Venn diagram analysis to identify common DEGs in the gene uniquely expressed in 27-Mac of Donor 1 and Donor 2: 125 genes from Donor 1 and 172 genes from Donor 2. (F) Functional enrichment analysis by Metascape (Metascape.org) for 86 genes.
Figure 6
Figure 6
Characterization of the 86 common genes in 27-Mac with other subsets of macrophages. Venn diagram analyses were employed to determine the degree of similarity between the 27-Mac and the macrophage subset signature genes ( Supplementary Table S8 ). (A) 27-Mac vs. M2a subsets (M2a, M2b, and M2c). (B) 27-Mac vs. M1 subset (M1, M1a, and M1b). (C) 27-Mac vs. M3 and M4. (D) 27-Mac vs. Mreg, Mox, and Mherm.
Figure 7
Figure 7
Characterization of CD38 expression. (A, B) The expression of the CD38 gene in M2, 27-Mac, 6-M2d, and BAY-M2d of Donors 1 (A) and Donor 2 (B) is illustrated using UMAP. The blue dots indicate cells that are expressing CD38. (C) In order to ascertain the expression of CD38 protein on macrophages, monocytes were obtained from donors who were independent of Donor 1 and Donor 2, subsequently differentiated into M2 macrophages, and then polarized using IL-27, IL-6, or BAY60-6583, as described in the Materials and Methods. Each polarized cell was subjected to Western blotting analysis using anti-CD38 or anti-β-actin as an internal control. Representative results from two independent assays are presented. (D) CD38 expression on cell surfaces of M2 macrophages, 27-Mac, 6-M2d, and BAY-M2d was analyzed using flow cytometry as described in the Materials and Methods. Representative results from three independent assays are presented. UMAP, Uniform Manifold Approximation and Projection.
Figure 8
Figure 8
Identification of host factors associated with HIV inhibition in the 86 common genes. (A) Venn diagram analysis was conducted using the 86 common genes and a total of 2,439 genes of host factor identified from CRISPR, siRNA, shRNA library screening, and ISGs ( Supplementary Table S9 ). (B, C) To demonstrate the proportion of cells expressing each of the 41 genes in M2 macrophages and 27-Mac, a bubble plot analysis was performed. The results demonstrate the comparative gene expression between M2 macrophages and 27-Mac from Donor 1 (B) or Donor 2 (C). The size of the bubbles is proportional to the percentage of cells in each sample that are expressing the gene of interest. The color intensity is proportional to the relative scaled (Z-score) gene expression within each sample. The relative expression levels are indicated by color, with higher expression levels represented by red and lower expression levels represented by blue. ISGs, interferon-stimulated genes.
Figure 9
Figure 9
Distribution of antiviral genes in each subset of macrophages. (A, B) The genes expressed in >40% of cells in either 27-Mac or M2 macrophages were selected from the 41 antiviral genes ( Figure 8 ). The results of 27 genes in Donor 1 (A) and Donor 2 (B) were analyzed to define gene distribution and population using UMAP. The genes of interest are colored blue. (C) To ascertain the expression of antiviral proteins in macrophage subsets, monocytes were obtained from two independent donors and subsequently differentiated into M2 macrophages. M2 macrophages were then polarized into 27-Mac, 6-M2d, and BAY-M2d as described in the Materials and Methods. Each polarized cell was subjected to Western blotting analysis using total of 16 antibodies or anti-β-actin as an internal control. Representative results from two independent assays are presented. UMAP, Uniform Manifold Approximation and Projection.
Figure 10
Figure 10
Detection of WSX and gp130 on M2 macrophages using FACS. The surface expression of WSX1 and gp130 on M2 macrophages was assessed by flow cytometry as described in the Materials and Methods. (A) The left and right panels show WSX1 and gp130 (CD130) staining, respectively. The staining pattern of isotype control antibodies is shown in gray line, and black indicates the protein of interest. The x-axis and y-axis show fluorescence intensity and cell counts, respectively. The percentages in the panels indicate the percentage of cells expressing WSX1 or gp130 in the samples. Data are representative of three independent experiments with similar outcomes. (B) Flow cytometric analysis of M2 macrophages showing the expression of WSX1 and gp130 (CD130) from one donor M2 macrophages. (C) FACS analysis for WSX1 and gp130 expression on M2 cells was performed using three independent donor cells. Results indicated means ± SE (n = 3). FACS, fluorescence-activated cell sorting.
Figure 11
Figure 11
Distribution of antiviral genes in CD4(+) and CCD5(+) each macrophage. Cells expressing both CD4 and CCR5 (the cutoff is 4 or above for expression) were selected from whole M2 macrophages, 6-M2d, BAY-M2d, and 27-Mac of Donor 1 (A) and Donor 2 (B). UMAP analysis for CD4(+)/CCR5(+) cells for each subtype was conducted by extracting them from the UMAP for entire subtype ( Figures 7A, B ). The UMAPs for genes of interest were colored blue to demonstrate the expression level. UMAP, Uniform Manifold Approximation and Projection.

Similar articles

References

    1. Pflanz S, Timans JC, Cheung J, Rosales R, Kanzler H, Gilbert J, et al. . IL-27, a heterodimeric cytokine composed of EBI3 and p28 protein, induces proliferation of naive CD4+ T cells. Immunity. (2002) 16:779–90. doi: 10.1016/s1074-7613(02)00324-2 - DOI - PubMed
    1. Guo Y, Cao W, Zhu Y. Immunoregulatory functions of the IL-12 family of cytokines in antiviral systems. Viruses. (2019) 11. doi: 10.3390/v11090772 - DOI - PMC - PubMed
    1. Swaminathan S, Dai L, Lane HC, Imamichi T. Evaluating the potential of IL-27 as a novel therapeutic agent in HIV-1 infection. Cytokine Growth Factor Rev. (2013) 24:571–7. doi: 10.1016/j.cytogfr.2013.07.001 - DOI - PMC - PubMed
    1. Pflanz S, Hibbert L, Mattson J, Rosales R, Vaisberg E, Bazan JF, et al. . WSX-1 and glycoprotein 130 constitute a signal-transducing receptor for IL-27. J Immunol. (2004) 172:2225–31. doi: 10.4049/jimmunol.172.4.2225 - DOI - PubMed
    1. Iwasaki Y, Fujio K, Okamura T, Yamamoto K. Interleukin-27 in T cell immunity. Int J Mol Sci. (2015) 16:2851–63. doi: 10.3390/ijms16022851 - DOI - PMC - PubMed