. 2025 Jan;12(Suppl 1):S14609.
doi: 10.1117/1.NPh.12.S1.S14609. Epub 2025 Mar 24.

Voluntary locomotion induces an early and remote hemodynamic decrease in the large cerebral veins

Affiliations

Voluntary locomotion induces an early and remote hemodynamic decrease in the large cerebral veins

Beth Eyre et al. Neurophotonics. 2025 Jan.

Abstract

Significance: Behavior regulates dural and cerebral vessels, with spontaneous locomotion inducing dural vessel constriction and increasing stimulus-evoked cerebral hemodynamic responses. It is vital to investigate the function of different vascular network components, surrounding and within the brain, to better understand the role of the neurovascular unit in health and neurodegeneration.

Aim: We characterized locomotion-induced hemodynamic responses across vascular compartments of the whisker barrel cortex: artery, vein, parenchyma, draining, and meningeal vein.

Approach: Using 2D-OIS, hemodynamic responses during locomotion were recorded in 9- to 12-month-old awake mice: wild-type, Alzheimer's disease (AD), atherosclerosis, or mixed (atherosclerosis/AD) models. Within the somatosensory cortex, responses were taken from pial vessels inside the whisker barrel region [(WBR): "whisker artery" and "whisker vein"], a large vein from the sagittal sinus adjacent to the WBR (draining vein), and meningeal vessels from the dura mater (which do not penetrate cortical tissue).

Results: We demonstrate that locomotion evokes an initial decrease in total hemoglobin (HbT) within the draining vein before the increase in HbT within WBR vessels. The locomotion event size influences the magnitude of the HbT increase in the pial vessels of the WBR but not of the early HbT decrease within the draining veins. Following locomotion onset, an early HbT decrease was also observed in the overlying meningeal vessels, which unlike within the cortex did not go on to exceed baseline HbT levels during the remainder of the locomotion response. We show that locomotion-induced hemodynamic responses are altered in disease in the draining vein and whisker artery, suggesting this could be an important neurodegeneration biomarker.

Conclusions: This initial reduction in HbT within the draining and meningeal veins potentially serves as a "space-saving" mechanism, allowing for large increases in cortical HbT associated with locomotion. Given this mechanism is impacted by disease, it may provide an important target for vascular-based therapeutic interventions.

Keywords: Alzheimer’s disease; hemodynamic; neurodegeneration; optical imaging spectroscopy; vasculature.


Figures

Fig. 1
Fig. 1
Experimental set-up. (a) The 2D-OIS imaging set-up for recording spontaneous hemodynamic responses in an awake mouse on a spherical treadmill with locomotion tracked [Created in BioRender. Eyre, B. (2025)45]. (b) Thinned cranial window from a representative animal with cortical surface vasculature visible (imaged at 575-nm illumination). The whisker barrel region is indicated by the red ROI. The purple ROI indicates the artery, the green ROI the vein, the pink ROI the parenchyma selected from within the whisker barrel region, the dark blue ROI represents the draining vein adjacent to the whisker barrels, and the teal ROI the meningeal vessel from the overlying dura mater. (c) Example continuous time series traces for locomotion (black, top) and HbT from the whisker artery (purple, bottom) and draining vein (blue, bottom) from one single 750-s recording (first 500 s visualized). The green dots on the locomotion plot represent the detected locomotion events. (d) Spatial map generated from this representative imaging session for trial-average changes in concentration (μM) of total hemoglobin (HbT) in response to locomotion (from 1 s before to 5 s after onset). The scale bar represents the micromole change for activated pixels, with a decrease in HbT shown in blue and an increase in red. The draining vein is observed on the left side of the images, with the rapid decrease in HbT (blue) seen in this vessel from 1 s, whereas the whisker barrel arterial network is highlighted in red as HbT increases in these vessels from 2 s onward. (e) In our illustrative example, the image of the thinned cranial window from one single wavelength captured under 2D-OIS was averaged for the 2s following detected locomotion events. The white borders along the edges of the draining and meningeal veins indicate vasoconstriction. (f) A profile of the vessel diameter was also taken for the 2 s following the onset of locomotion across the yellow line indicated in the left image, with the draining vein having darker pixels compared with the surrounding tissue. The change in the number of dark pixels representing the size of the draining vein is visualized as a number of pixels (center) or a percentage change from the baseline size (right), indicating that the draining vein is constricting following locomotion onset.
Fig. 2
Fig. 2
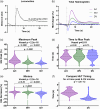
Spontaneous locomotion induces a fast, remote decrease in the large cerebral draining vein that precedes the regional HbT influx. (a) A total of 2343 individual locomotion events were detected across 118 imaging sessions taken from 40 mice. The 5 s prior to the locomotion event and 20 s after the onset were taken, and the locomotion traces averaged. (b) Concurrent total hemoglobin (HbT) traces corresponding to these locomotion events were extracted for the artery (purple), whisker vein (green), and draining vein (blue) in the somatosensory cortex. The size and timing of the maximum peak were significantly impacted by vessel type, with the artery showing (c) the largest increase in HbT from baseline following the onset of locomotion (art M: 7.33, SD: 4.77, wv M: 3.61, SD: 2.89, dv M: 2.06, SD: 2.40; art – dv, p<0.0001; art – wv, p<0.0001), and (d) the quickest time to reach its maximum peak (art M: 3.13, SD: 0.96, wv M: 3.19, SD: 1.03, dv M: 3.22, SD: 1.27; art – dv, p=0.01; art – wv, p=0.08). (e) The draining vein showed a significantly larger minimum decrease below baseline in HbT (art M: 0.97, SD: 2.01, wv M: 1.06, SD: 1.73, dv M: 2.77, SD: 2.56; art – dv, p<0.0001; wv – dv, p<0.0001), (f) an active response which occurred significantly faster than the artery HbT increase (p<1.2e12). p-values are taken from linear mixed-effects models with vessel type inputted as a fixed-effect factor, and animal ID as the random effect, except for (f) where a Wilcoxon–Signed ranks was conducted for a two-group paired comparison (see Statistics Report Table SR1 in the Supplementary Material). Shaded error bars represent mean ± SEM. Horizontal lines on violin plots show median and interquartile ranges. Source data are provided as a Source Data file.
Fig. 3
Fig. 3
Amount of locomotion modulates the size of the HbT increase but not the initial HbT decrease in the draining vein. (a) The size of the locomotion event, measured using the area under the curve for the 5 s following locomotion onset, correlated with the magnitude of the increase in HbT across all vessel regions (artery purple, wv green, dv blue). (b) The size of the initial decrease in the draining vein (measured by the minima) was not modulated by the size of the locomotion event. For correlation analysis, p-values are taken from a Pearson’s correlation (cor.test package RStudio). (c) All locomotion events (n=2343) were sorted in ascending order from the smallest area under the curve value during the 5 s following locomotion onset (5 to 10s), (d) and this index was used to order the corresponding HbT traces for the artery (left), whisker vein (middle), and draining vein (right). (e) The average HbT traces were visualized across the vessel types for the bottom (n=234) and top (n=234) 10% of locomotion trials, (f) and although a significant impact of locomotion group (bottom versus top) was observed on the size of the peak across vessel types (maximum for art and wv, minimum for dv), there was no impact of locomotion group on the size of the minimum decrease in the draining vein (bottom 10% dv min peak—top 10% dv min peak p=0.93). p-values are taken from linear mixed-effects models with vessel type and locomotion group inputted as fixed-effect factors, and animal ID as the random effect (lmer package RStudio), and pairwise comparisons (with correction for multiple comparisons) were conducted using the Tukey method (emmeans package RStudio) (see Statistics Report Tables SR2–SR4 in the Supplementary Material). Shaded error bars represent mean ± SEM. Horizontal lines on violin plots show median and interquartile ranges. Source data are provided as a Source Data file.
Fig. 4
Fig. 4
Meningeal vein shows a larger HbT decrease following locomotion onset, which unlike in the draining vein does not subsequently increase above baseline. (a) The average locomotion traces for the 1224 locomotion events detected from the 57 imaging sessions (21 mice) where both the meningeal and draining vein were visible in the imaging window. (b) Locomotion-dependent corresponding average total hemoglobin traces were plotted for the draining and meningeal veins, which both showed a large decrease in HbT immediately following the onset of locomotion, but with the meningeal vessel (which lies outside of the brain) not showing the subsequent overall increase in HbT during the remainder of the locomotion event. (c) A linear regression analysis revealed there were no significant differences in the relationship between the size of the locomotion event and the size of the HbT minima (test of the difference between slopes p=0.76), with neither vessel type showing a significant correlation between the size of these responses (dv p=0.58, mn p=0.47). (d) The size of the decrease in the minima in the meningeal vessel is significantly larger than in the draining vein (dv M: 2.77, SD: 2.56; mn M: 3.97, SD: 3.06), (e) and when we calculated a normalized speed metric by dividing the absolute value of the HbT minima (%) by the time to reach this minima (seconds), this was significantly larger for the meningeal vein which reflects a larger HbT peak being reached in a relatively faster time. (f) To capture the vascular dynamics regarding the return to baseline, the area under the curve in the 5 s following locomotion onset was assessed between draining and meningeal veins (dv M: 0.03, SD: 10.77; mn M: 6.11, SD: 12.73), with a significant difference found as the meningeal vessel was primarily negative (sustained decrease not exceeding baseline) and the draining vein closer to 0 (as the negative decrease was followed by a subsequent increase in HbT). Two-group unpaired comparisons were conducted using Mann–Whitney tests, and linear relationships were estimated using linear regression (see Statistics Report Tables SR5 and SR6 in the Supplementary Material). Shaded error bars represent mean ± SEM. Horizontal lines on violin plots show median and interquartile ranges. Source data are provided as a Source Data file.
Fig. 5
Fig. 5
Locomotion-induced draining vein HbT decrease is enhanced in mixed mice. (a) Locomotion traces were averaged across four genotypes [wildtype (WT, purple, nLocoEvents = 580), APP/PS1 (AD, green, nLocoEvents = 761), Atherosclerosis (ATH, pink, nLocoEvents = 700), and APP/PS1 × Atherosclerosis (MIX, orange, nLocoEvents = 302)]. There were no significant differences in locomotion between genotypes (vessel type p=1.00, genotype p=0.33, vessel type * genotype p=1.00; assessed using area under the curve from individual locomotion events), so all locomotion events were included in subsequent analyses. Corresponding HbT traces were visualized across genotypes for the (b) artery, (c) whisker vein, and (d) draining vein. Again, significant differences in the size of the HbT (e) maximum and (f) minima were found across vessel types, with the artery showing the largest increase in HbT and the draining vein the largest decrease. There was no significant impact of disease on the size (or timing) of these responses; however, there was an interaction between vessel type and genotype as APP/PS1 (AD) mice showed a smaller maximum peak in the artery (AD artery (M: 6.21, SD: 4.17) – ATH artery (M: 8.03, SD: 5.02), p=0.02), and smaller minima in the draining vein (AD dv (M: 2.48, SD: 2.03) – MIX dv (M: 3.74, SD: 5.10), p=0.01) HbT responses. p-values are taken from linear mixed-effects models with vessel type and genotype inputted as fixed-effect factors, and animal ID as the random effect (see Statistics Report Table SR7 in the Supplementary Material). Shaded error bars represent mean ± SEM. Horizontal lines on violin plots show median and interquartile ranges. Source data are provided as a Source Data file.

References

    1. Howarth C., Gleeson P., Attwell D., “Updated energy budgets for neural computation in the neocortex and cerebellum,” J. Cereb. Blood Flow Metab. 32(7), 1222–1232 (2012).10.1038/jcbfm.2012.35 - DOI - PMC - PubMed
    1. Attwell D., et al. , “Glial and neuronal control of brain blood flow,” Nature 468(7321), 232–243 (2010).10.1038/nature09613 - DOI - PMC - PubMed
    1. Iadecola C., “The neurovascular unit coming of age: a journey through neurovascular coupling in health and disease,” Neuron 96(1), 17–42 (2017).NERNET10.1016/j.neuron.2017.07.030 - DOI - PMC - PubMed
    1. Schaeffer S., Iadecola C., “Revisiting the neurovascular unit,” Nat. Neurosci. 24(9), 1198–1209 (2021).NANEFN10.1038/s41593-021-00904-7 - DOI - PMC - PubMed
    1. Kim S.-G., Ogawa S., “Biophysical and physiological origins of blood oxygenation level-dependent fMRI signals,” J. Cereb. Blood Flow Metab. 32(7), 1188–1206 (2012).10.1038/jcbfm.2012.23 - DOI - PMC - PubMed