Prevalence and determinants of chronic kidney disease among community-dwelling adults, 50 years and older in Ireland
- PMID: 40130228
- PMCID: PMC11932339
- DOI: 10.1093/ckj/sfaf065
Prevalence and determinants of chronic kidney disease among community-dwelling adults, 50 years and older in Ireland
Abstract
Background: Using the Irish Longitudinal Study on Ageing (TILDA), we evaluated the prevalence and distribution of chronic kidney disease (CKD), and its determinants in order to identify risk groups for population health planning in Ireland.
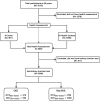
Methods: Data were analysed from Wave 1 (2009-2011) of the TILDA, a national cohort of participants aged 50+ years who had both plasma creatinine and cystatin C measured at baseline. Kidney function was estimated using the 2012 and 2021 Chronic Kidney Disease Epidemiology Collaboration (CKD-EPI) equations. CKD was defined as estimated glomerular filtration rate <60 mL/min/1.73 m2. Multivariable logistic regression explored associations using adjusted odds ratios (OR).
Results: Prevalence of CKD was significantly higher using the CKD-EPI 2012(Scr-CysC) compared with the CKD-EPI 2021(Scr-CysC) (14.7% vs 11.3%, respectively). The prevalence was highest in patients with cardiovascular disease (CVD) (33.9%), diabetes (28.0%), cancer (25.5%), urinary incontinence (23.7%), bone diseases (21.5%), hypertension (19.8%) and obesity (19.5%). In multivariable analysis, individuals with hypertension (OR 1.78), diabetes (OR 1.45), CVD (OR 1.43), cancer (OR 1.53), overweight (OR 1.37) and obesity (OR 2.33) experienced greater likelihood of CKD. In addition, individuals with a history of previous hospitalization (OR 1.50), free or subsidized healthcare (OR 1.31), and unemployed individuals (OR 1.86) were also significantly more likely to have CKD.
Conclusion: Compared with the national average, the burden of CKD is far greater in older individuals with major chronic conditions and socioeconomic deprivation. The identification and targeting of these groups through national surveillance programmes is likely to yield substantial benefits from more effective disease management and proactive population health planning.
Keywords: chronic kidney disease; comorbid condition; prevalence; risk factor; social deprivation.
© The Author(s) 2025. Published by Oxford University Press on behalf of the ERA.
Conflict of interest statement
All authors report no disclosures.
Figures


References
-
- Institute for Health Metrics and Evaluation . The Lancet: Latest Global Disease Estimates Reveal Perfect Storm of Rising Chronic Diseases and Public Health Failures Fuelling COVID-19 Pandemic [Internet]. Institute for Health Metrics and Evaluation (IHME). 2020. Available from: https://hpfhub.info/wp-content/uploads/2021/12/The-Lancet_-Latest-global... (10 June 2024, date last accessed).
-
- Foreman KJ, Marquez N, Dolgert A et al. Forecasting life expectancy, years of life lost, and all-cause and cause-specific mortality for 250 causes of death: reference and alternative scenarios for 2016-40 for 195 countries and territories. Lancet 2018;392:2052–90. 10.1016/S0140-6736(18)31694-5 - DOI - PMC - PubMed
LinkOut - more resources
Full Text Sources

