

In Vivo Noncontact Imaging of Conjunctival Goblet Cells with Customized Widefield Fluorescence Microscopy
- PMID: 40130265
- PMCID: PMC11930793
- DOI: 10.1016/j.xops.2025.100712
In Vivo Noncontact Imaging of Conjunctival Goblet Cells with Customized Widefield Fluorescence Microscopy
Abstract
Purpose: Conjunctival goblet cells (CGCs) play a crucial role in maintaining ocular surface health by producing mucins. However, assessing CGC changes in ocular diseases remains limited by invasive techniques and subjective evaluations. This study aims to develop a noncontact cellular resolution fluorescence microscopy for in vivo CGC imaging and investigate CGC dynamics in a dry eye disease (DED) mouse model.
Design: Experimental study.
Subjects: Freshly ex vivo porcine eyes, New Zealand white rabbits, and C57BL/6 mice.
Methods: Based on the intrinsic fluorescence properties of moxifloxacin, a high-resolution noncontact widefield fluorescence microscopy (WFFM) was customized with an all-in-focus algorithm to optimize in vivo CGC imaging over the curved conjunctival surface. A DED mouse model was established by topically applying 0.2% benzalkonium chloride (BAC) to the ocular surface daily for 7 days, followed by a 7-day recovery period without BAC. In vivo CGC alterations were assessed using WFFM on days 0, 3, 7, and 14. Additional assessments included the phenol red thread tear test, corneal sodium fluorescein staining, and periodic acid-Schiff (PAS) assay.
Main outcome measures: Conjunctival goblet cell density and area ratio.
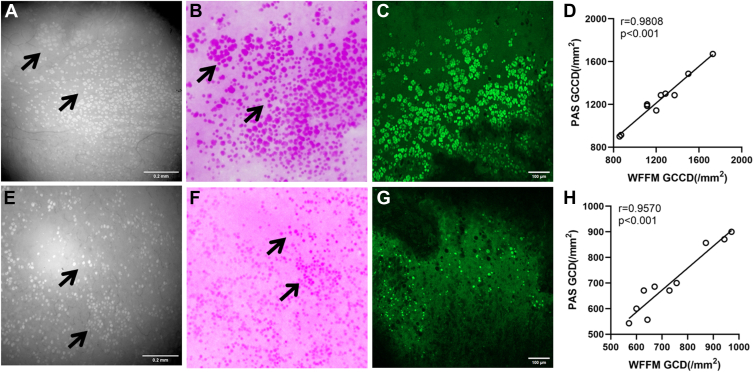
Results: The WFFM system achieved a cellular resolution of 1 μm and a field of view of 1.4 mm × 1.4 mm. Imaging validation in mice and rabbits allowed for the distinguishing and quantitative assessment of individual CGCs or clusters on the curved conjunctival surface in vivo. Significant reductions in CGC density and area ratio on days 3 and 7 after BAC induction were observed in DED mouse in vivo with WFFM, with their values returning to the baseline 7 days after BAC removal, which was consistent with PAS staining results.
Conclusions: The customized WFFM enables in vivo cellular imaging of CGCs, offering a safe and accurate method for continuous monitoring of CGC pathophysiology in ocular surface diseases such as DED.
Financial disclosures: Proprietary or commercial disclosure may be found in the Footnotes and Disclosures at the end of this article.
Keywords: Cellular imaging; Conjunctival goblet cells; Dry eye disease; Noncontact imaging.
© 2025 by the American Academy of Ophthalmologyé.
Figures


Similar articles
-
Imaging assessment of conjunctival goblet cells in dry eye disease.Clin Exp Ophthalmol. 2024 Jul;52(5):576-588. doi: 10.1111/ceo.14379. Epub 2024 Mar 30. Clin Exp Ophthalmol. 2024. PMID: 38553944 Review.
-
Noninvasive Imaging of Conjunctival Goblet Cells as a Method for Diagnosing Dry Eye Disease in an Experimental Mouse Model.Transl Vis Sci Technol. 2023 Dec 1;12(12):22. doi: 10.1167/tvst.12.12.22. Transl Vis Sci Technol. 2023. PMID: 38149964 Free PMC article.
-
Moxifloxacin based axially swept wide-field fluorescence microscopy for high-speed imaging of conjunctival goblet cells.Biomed Opt Express. 2020 Aug 6;11(9):4890-4900. doi: 10.1364/BOE.401896. eCollection 2020 Sep 1. Biomed Opt Express. 2020. PMID: 33014588 Free PMC article.
-
Moxifloxacin-Based Extended Depth-of-Field Fluorescence Microscopy for Real-Time Conjunctival Goblet Cell Examination.IEEE Trans Med Imaging. 2022 Aug;41(8):2004-2008. doi: 10.1109/TMI.2022.3151944. Epub 2022 Aug 1. IEEE Trans Med Imaging. 2022. PMID: 35167445
-
Conjunctival goblet cells: Ocular surface functions, disorders that affect them, and the potential for their regeneration.Ocul Surf. 2020 Jan;18(1):19-26. doi: 10.1016/j.jtos.2019.11.005. Epub 2019 Nov 14. Ocul Surf. 2020. PMID: 31734511 Free PMC article. Review.
References
-
- Baudouin C., Rolando M., Benitez Del Castillo J.M., et al. Reconsidering the central role of mucins in dry eye and ocular surface diseases. Prog Retin Eye Res. 2019;71:68–87. - PubMed
-
- Hong J., Zhu W., Zhuang H., et al. In vivo confocal microscopy of conjunctival goblet cells in patients with Sjogren's syndrome dry eye. Br J Ophthalmol. 2010;94:1454–1458. - PubMed
LinkOut - more resources
Full Text Sources
