. 2025 Jun 3;151(22):1583-1605.
doi: 10.1161/CIRCULATIONAHA.124.072194. Epub 2025 Mar 25.

XBP1s-EDEM2 Prevents the Onset and Development of HFpEF by Ameliorating Cardiac Lipotoxicity

Affiliations

XBP1s-EDEM2 Prevents the Onset and Development of HFpEF by Ameliorating Cardiac Lipotoxicity

Oveena Fonseka et al. Circulation. .

Abstract

Background: Morbidity and mortality of heart failure with preserved ejection fraction (HFpEF) is increased in metabolic disorders. However, options for preventing and treating these prevalent outcomes are limited. Intramyocardial lipotoxicity contributes to cardiac dysfunction. Here, we investigate the mechanisms underlying EDEM2 (endoplasmic reticulum degradation-enhancing alpha-mannosidase-like protein 2) regulation of cardiac lipid homeostasis and assess strategies that inhibit the incidence and progression of HFpEF.

Methods: Metabolic stress was induced in C57BL/6 male mice using a high-fat diet and Nω-nitro-L-arginine methyl ester. The recombinant adeno-associated virus 9 delivery system was used for loss- and gain-of-function studies. Palmitic acid and oleic acid stimulation of rat cardiomyocytes and human induced pluripotent stem cell-derived cardiomyocytes imitated a condition of high lipids in vitro. Molecular mechanisms were investigated via RNA sequencing, mass spectrometry proteomics, lipidomic analyses, transmission electron microscopy, histology, and luciferase reporter assays.

Results: In the human heart, we first detected lipid overload accompanied by a reduction of XBP1 (X-box binding protein 1) under metabolic stress. Thereafter, a decrease in EDEM2 was confirmed in human and mouse HFpEF hearts. Given that XBP1s (spliced X-box binding protein 1) is a transcription factor, EDEM2 was identified as its new target in cardiomyocytes. EDEM2 knockdown mice manifested lipid droplet accumulation and higher levels of triglycerides and diglycerides in the myocardium, aggravating oxidative stress, hypertrophy, and the onset and progression of HFpEF under metabolic stress. XBP1s ablation mice displayed a similar myocardial lipid disturbance and cardiac phenotypes, which were reversed by EDEM2 overexpression. Mechanistically, the findings obtained from rat cardiomyocytes and human induced pluripotent stem cell-derived cardiomyocytes demonstrated that, in the presence of EDEM2, SEC23A mediated intracellular translocation of ATGL (adipose triglyceride lipase) under fatty acid stimulation, inhibiting ATGL degradation and excessive intracellular lipid droplets. Furthermore, the functional studies supported that EDEM2 prevention of lipid overload occurred in an ATGL-dependent manner. Therapeutically, cardiac XBP1s or EDEM2 restoration mitigated lipid deposition and preserved lipid profiles in the myocardium, thus preventing the development of HFpEF.

Conclusions: We demonstrate a cardioprotective mechanism regulating myocardial lipid homeostasis. The findings provide a promising therapeutic target to prevent and treat HFpEF, a condition with limited treatment options.

Keywords: EDEM2; HFpEF; XBP1s; cardiac lipotoxicity; heart failure; metabolic stress.


Conflict of interest statement

T.M.A.M. holds equities at Tenaya Therapeutics.

Figures
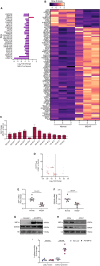
Figure 1.
Figure 1.
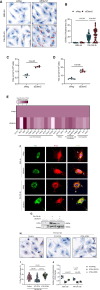
Endoplasmic reticulum degradation–enhancing alpha-mannosidase–like protein 2 is regulated by spliced X-box binding protein 1 and reduced in hearts with heart failure with preserved ejection fraction. A, Among the genes with differential expression (Padj<0.1) identified in human hearts from people with metabolic syndrome (MS) who died of heart failure (HF) compared with normal controls without MS and HF (n=3–5 hearts), genes involved in the endoplasmic reticulum and lipid metabolic function are presented. B, Liquid chromatography-mass spectrometry heatmap analysis exhibiting altered proteins in human MS-HF hearts compared with normal controls (n=3 hearts; Padj<0.05). C, Lipidomics displaying significantly changed diglycerides and triglycerides in the human heart under metabolic stress (n=3–5 hearts). D, RNA sequencing demonstrates the genes with differential expression in human hearts with heart failure with preserved ejection fraction (n=4–6 hearts; Padj<0.1). E and F, Quantitative PCR of XBP1 (E) and quantitative PCR of EDEM2 in human hearts with heart failure with preserved ejection fraction (F; n=8). G and H, Immunoblots demonstrating that XBP1s (spliced X-box binding protein 1) overexpression achieved by an adenovirus expressing XBP1s increased EDEM2 (endoplasmic reticulum degradation–enhancing alpha-mannosidase–like protein 2) levels (Ad-LacZ: control; G) and XBP1s reduction (siXbp1) decreased EDEM2 levels in neonatal rat cardiomyocytes (H). Gβ is the loading control. I, Edem2 promotor luciferase activity was augmented by XBP1s overexpression (n=6 experiments). Data are presented as mean±SEM. P values were calculated using a Mann-Whitney test (C), an unpaired Student t test (E and F), or a 2-way ANOVA with Šidák post hoc tests (I). siNeg indicates siNegative.
Figure 2.
Figure 2.
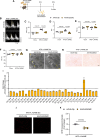
Endoplasmic reticulum degradation–enhancing alpha-mannosidase–like protein 2 deficiency induces lipotoxicity and impairs cardiac function under metabolic stress. A, Schematic of the experimental design. B, Representative pulsed-wave Doppler tracings. C, Isovolumic relaxation time (n=5–9 mice). D, Ratio of peak velocity blood flow from left ventricular relaxation in early diastole to that in late diastole (n=5–9 mice). E, Representative left ventricular M-mode echocardiographic tracings in short-axis view. F, Percentage of left ventricular fractional shortening (FS%; n=5-9 mice). G, Percentage of ejection fraction (n=5–9 mice). H, Representative transmission electron microscopy images; arrows indicate lipid droplets (scale bar=1 µm). I, Representative oil red O staining (scale bar=20 µm). J, Lipidomic analysis displaying diglycerides and triglycerides significantly altered in EDEM2 (endoplasmic reticulum degradation–enhancing alpha-mannosidase–like protein 2) knockdown hearts compared with control mice exposed to metabolic stress (n=5–9 hearts; P<0.05). K, Representative images of dihydroethidium staining (scale bar=50 µm). L, Quantification of dihydroethidium intensity (n=3–5 hearts). Data are presented as mean±SEM. P values were calculated using a 2-way ANOVA with Tukey post hoc tests (C, D, F, and G), an unpaired Student t test (J), or a Mann-Whitney test (L). DG indicates diglyceride; DHE, dihydroethidium; E/A, ratio of peak velocity blood flow from left ventricular relaxation in early diastole to that in late diastole; FS%, percentage of left ventricular fractional shortening; IVRT, isovolumic relaxation time; and TG, triglyceride.
Figure 3.
Figure 3.
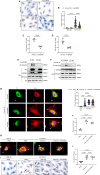
Endoplasmic reticulum degradation–enhancing alpha-mannosidase–like protein 2 knockdown increases lipid droplet accumulation and endoplasmic reticulum retention of adipose triglyceride lipase in cardiomyocytes with fatty acid stimulation. A, Representative images of oil red O staining of neonatal rat cardiomyocytes (NRCMs) with EDEM2 (endoplasmic reticulum degradation–enhancing alpha-mannosidase–like protein 2) knockdown (siEdem2) with 4 hours of palmitic acid and oleic acid stress (300 μM; scale bar=20 µm). B, Percentage of oil red O–positive area in NRCMs (n=50 cells collected from 3 separate experiments). C and D, Diglyceride (C) and triglyceride (D) contents in H9C2 myoblasts subjected to stress of palmitic acid and oleic acid for 4 hours (n=4–6 experiments). E, Liquid chromatography-mass spectrometry analysis showing proteins significantly changed in EDEM2 knockdown H9C2s (Padj<0.05) under stress for 4 hours (n=3 experiments). F, ATGL (adipose triglyceride lipase) distribution in NRCMs. Endoplasmic reticulum retention (blue arrows) is indicated by an endoplasmic reticulum marker, PDI (protein disulfide isomerase [green]); white arrows indicate cytosol-diffused ATGL (red). Nuclei were stained with 4',6-diamidino-2-phenylindole (DAPI; blue; scale bar=20 µm). G, Levels of ATGL on isolated lipid droplets (perilipin 2 as a lipid droplet indicator) from 5×10⁷ H9C2 cells. H, Representative images of oil red O staining of NRCMs overexpressing wild-type or endoplasmic reticulum–retained ATGL (scale bar=20 µm). I, Quantification of oil red O–positive area in NRCMs (n=50 cells collected from 3 separate experiments). J, ATGL lipase activity assay in whole-cell extracts from H9C2 cells expressing wild-type ATGL, mutant ATGL (S47A), or endoplasmic reticulum–retained ATGL in the absence and presence of fatty acid stress (n=8 experiments). Data are presented as mean±SEM. P values were calculated using a 2-way ANOVA with Tukey post hoc tests (B) or Šidák post hoc tests (J), a Mann-Whitney test (C), an unpaired Student t test (D), or a Kruskal-Wallis test with Dunn’s post hoc tests (I). ATGL indicates adipose triglyceride lipase; ATGL-KDEL, endoplasmic reticulum–retained ATGL; DG, diglyceride; OA, oleic acid; PA, palmitic acid; siNeg, siNegative; TG, triglyceride; and WT, wild type.
Figure 4.
Figure 4.
Endoplasmic reticulum degradation–enhancing alpha-mannosidase–like protein 2 overexpression decreases lipid droplet accumulation and triggers SEC23A-mediated adipose triglyceride lipase release from the endoplasmic reticulum in cardiomyocytes. A, Representative images of oil red O staining of neonatal rat cardiomyocytes with EDEM2 (endoplasmic reticulum degradation–enhancing alpha-mannosidase–like protein 2) overexpression with stimulation of palmitic acid and oleic acid stress (300 μM) for 12 hours (scale bar=20 µm). B, Percentage of oil red O–positive areas in cells (n=50 cells collected from 3 separate experiments). C and D, Diglycerides (C) and triglycerides (D) in H9C2 cells (n=4–6 experiments) under stress for 12 hours. E, Co-immunoprecipitation demonstrating the association of EDEM2 and SEC23A in EDEM2-overexpressing H9C2 cells. F, Co-immunoprecipitation displaying endogenous EDEM2 and SEC23A association in H9C2 upon acute fatty acid stimulation. G, ATGL (adipose triglyceride lipase; red) release from the endoplasmic reticulum (ER; PDI [protein disulfide isomerase], an ER marker, is shown in green) as shown by white arrows in EDEM2- or SEC23A-overexpressing neonatal rat cardiomyocytes (blue arrows indicate ER-retained ATGL), nuclei were stained with 4',6-diamidino-2-phenylindole (DAPI; blue; scale bar=20 µm). H, ATGL (red) localization in neonatal rat cardiomyocytes with SEC23A deficiency (PDI, an ER marker, is shown in green). White arrows indicate cytosolic trafficking of ATGL, whereas blue arrows indicate ER-retained ATGL (scale bar=20 µm). I, Representative images of oil red O staining of neonatal rat cardiomyocytes with SEC23A knockdown (siSec23a) in the absence and presence of EDEM2 overexpression with 4 hours of stimulation (palmitic acid and oleic acid, 300 μM; scale bar=20 µm). J, Percentage of oil red O–positive areas in cells (n= 50 cells collected from 3 separate experiments). K and L, diglycerides (K) and triglycerides (L) in H9C2 cells under stress for 4 hours (n=4–6 experiments). Data are presented as mean±SEM. P values were calculated using a 2-way ANOVA with Tukey post hoc tests (B), a Mann-Whitney test (C), an unpaired Student t test (D), a 1-way ANOVA with Tukey post hoc tests (J), or a Kruskal-Wallis test with Dunn’s post hoc tests (K and L). DG indicates diglyceride; IP, immunoprecipitation; OA, oleic acid; PA, palmitic acid; siNeg, siNegative; and TG, triglyceride.
Figure 5.
Figure 5.
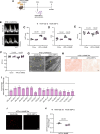
Endoplasmic reticulum degradation–enhancing alpha-mannosidase–like protein 2 overexpression alleviates cardiac lipotoxicity and heart failure with preserved ejection fraction upon metabolic stress. A, Schematic of the experimental design. B, Representative pulsed-wave Doppler tracings. C, Isovolumic relaxation time. D, Ratio of peak velocity blood flow in early diastole to late diastole. E, Percentage of left ventricular fractional shortening. F, Percentage of ejection fraction (n=5–9 mice). G, Representative transmission electron microscopy images; arrows indicate lipid droplets (scale bar=1 µm). H, Oil red O staining (scale bar=20 µm). I, Lipidomics analysis of mice hearts displaying diglycerides and triglycerides significantly altered in EDEM2 (endoplasmic reticulum degradation–enhancing alpha-mannosidase–like protein 2)-overexpressing hearts compared with control mice exposed to metabolic stress induced by a high-fat diet and Nω-nitro-L-arginine methyl ester (n=4–5 hearts, P<0.05). J, Representative dihydroethidium staining images (scale bar=50 µm). K, Quantification of dihydroethidium intensity (n=3–5 hearts). Data are presented as mean±SEM. P values were calculated using a 2-way ANOVA with Šidák post hoc tests (C to F) or a Mann-Whitney test (I and K). DG indicates diglyceride; DHE, dihydroethidium; E/A, ratio of peak velocity blood flow in early diastole to late diastole; EF%, percentage of ejection fraction; FS%, percentage of left ventricular fractional shortening; HFD, high-fat diet; IVRT, isovolumic relaxation time; L-NAME, Nω-nitro-L-arginine methyl ester; and TG, triglyceride.
Figure 6.
Figure 6.
Spliced X-box binding protein 1 loss–induced cardiac lipid overload under metabolic stress is rescued by endoplasmic reticulum degradation–enhancing alpha-mannosidase–like protein 2 overexpression. A, Schematic of the experimental design. B, Representative pulsed-wave Doppler tracings. C, Isovolumic relaxation time. D, Ratio of peak velocity blood flow in early diastole to late diastole obtained from pulsed-wave Doppler. E, Representative left ventricular M-mode echocardiographic tracings in short-axis view. F and G, Percentage of left ventricular fractional shortening (F) and percentage of ejection fraction obtained from M-mode echocardiography (n=4–6 mice). H, Representative transmission electron microscopy images (arrows indicate lipid droplets; scale bar=1 µm). I, Oil red O staining (scale bar=20 µm). J, Lipidomics showing significantly changed diglycerides and triglycerides by EDEM2 (endoplasmic reticulum degradation–enhancing alpha-mannosidase–like protein 2) restoration in hearts with loss of XBP1s (spliced X-box binding protein 1) compared with hearts with loss of XBP1s under metabolic stress induced by a high-fat diet and Nω-nitro-L-arginine methyl ester (n=4–5 hearts, P<0.05). K, Representative images of dihydroethidium staining (scale bar=50 µm). L, Quantification of dihydroethidium intensity (n=3–6 hearts). Data are presented as mean±SEM. P values were calculated using a 2-way ANOVA with Šidák post hoc tests (C, D, F, and G), a Mann-Whitney test (J), or a Kruskal-Wallis test with Dunn’s post hoc tests (L). DG indicates diglyceride; DHE, dihydroethidium; E/A, ratio of peak velocity blood flow in early diastole to late diastole; EF%, percentage of ejection fraction; FS%, percentage of left ventricular fractional shortening; HFD, high-fat diet; IVRT, isovolumic relaxation time; L-NAME, Nω-nitro-L-arginine methyl ester; and TG, triglyceride.
Figure 7.
Figure 7.
Spliced X-box binding protein 1 overexpression ameliorates cardiac lipotoxicity upon metabolic stress. A, Schematic of the experimental design. B, Representative pulsed-wave Doppler tracings. C and D, Isovolumic relaxation time (C) and ratio of peak velocity blood flow in early diastole to late diastole (D) obtained from pulsed-wave Doppler. E and F, Percentage of left ventricular fractional shortening (E) and percentage of ejection fraction (F) obtained from M-mode echocardiography (n=4–8 mice). G, Representative transmission electron microscopy images (arrows indicate lipid droplets; scale bar=1 µm). H, Oil red O staining (scale bar=20 µm). I, Lipidomics showing significantly changed diglycerides and triglycerides in hearts overexpressing XBP1s (spliced X-box binding protein 1) compared with control hearts under metabolic stress induced by a high-fat diet and Nω-nitro-L-arginine methyl ester (n=6 hearts, P<0.05). J, Representative images of dihydroethidium staining (scale bar=50 µm). K, Quantification of dihydroethidium intensity (n=3–5 hearts). Data are presented as mean±SEM P values were calculated using a 2-way ANOVA with Šidák post hoc tests (C to F), an unpaired Student t test (I), or a Mann-Whitney test (K). DG indicates diglyceride; DHE, dihydroethidium; E/A, ratio of peak velocity blood flow in early diastole to late diastole; EF%, percentage of ejection fraction; FS%, percentage of left ventricular fractional shortening; HFD, high-fat diet; IVRT, isovolumic relaxation time; L-NAME, Nω-nitro-L-arginine methyl ester; and TG, triglyceride.
Figure 8.
Figure 8.
The spliced X-box binding protein 1 and endoplasmic reticulum degradation–enhancing alpha-mannosidase–like protein 2 pathway is required to facilitate adipose triglyceride lipase translocation to inhibit excessive lipid droplets in human induced pluripotent stem cell–derived cardiomyocytes. A, Representative immunoblots of EDEM2 (endoplasmic reticulum degradation–enhancing alpha-mannosidase–like protein 2) and XBP1s (spliced X-box binding protein 1) in response to stimulation of palmitic acid and oleic acid (300 μM each). B and C, Quantification of EDEM2 (B) and quantification of XBP1s (C) in human induced pluripotent stem cell–derived cardiomyocytes (n=4 experiments). D, Immunoblots showing XBP1s overexpression and higher EDEM2 expression in human induced pluripotent stem cell–derived cardiomyocytes. E, Immunoblots validating EDEM2 overexpression. F, Representative oil red O staining images (scale bar=20 µm). G, percentage of oil red O–positive area (n=50 cells in 3 experiments). H, Co-immunoprecipitation demonstrating the association of endogenous EDEM2 and SEC23A upon acute stress. I, Longer-term stress resulted in endoplasmic reticulum–retained ATGL (adipose triglyceride lipase; red) (PDI [protein disulfide isomerase; green] is an endoplasmic reticulum marker marker), which was diminished by either SEC23A or EDEM2 overexpression. Nuclei were stained with 4',6-diamidino-2-phenylindole (DAPI; blue). White arrows indicate cytosolic translocated ATGL, whereas blue arrows indicate endoplasmic reticulum–retained ATGL (scale bar=20 µm). Data are presented as mean±SEM. P values were calculated using a 1-way ANOVA and Tukey post hoc tests (B and C) or 2-way ANOVA with Šidák post hoc tests (G). J, Schematic model summarizing the molecular picture of XBP1s-EDEM2 governing lipid homeostasis. XBP1s regulation of EDEM2 facilitates SEC23A-mediated ATGL translocation and inhibits ATGL degradation, mitigating myocardial lipotoxicity and heart failure with preserved ejection fraction under metabolic stress (BioRender). HFpEF indicates heart failure with preserved ejection fraction; LD, lipid droplet; OA, oleic acid; and PA, palmitic acid.

References

    1. Karwi QG, Ho KL, Pherwani S, Ketema EB, Sun Q, Lopaschuk GD. Concurrent diabetes and heart failure: interplay and novel therapeutic approaches. Cardiovasc Res. 2022;118:686–715. doi: 10.1093/cvr/cvab120 - PubMed
    1. Schiattarella GG, Altamirano F, Kim SY, Tong D, Ferdous A, Piristine H, Dasgupta S, Wang X, French KM, Villalobos E, et al. Xbp1s-FoxO1 axis governs lipid accumulation and contractile performance in heart failure with preserved ejection fraction. Nat Commun. 2021;12:1684. doi: 10.1038/s41467-021-21931-9 - PMC - PubMed
    1. Chen X, Ruiz-Velasco A, Zou Z, Hille SS, Ross C, Fonseka O, Gare SR, Alatawi NHO, Raja R, Zhang J, et al. PAK3 exacerbates cardiac lipotoxicity via SREBP1c in obesity cardiomyopathy. Diabetes. 2024;73:1805–1820. doi: 10.2337/db24-0240 - PMC - PubMed
    1. Zlobine I, Gopal K, Ussher JR. Lipotoxicity in obesity and diabetes-related cardiac dysfunction. Biochim Biophys Acta. 2016;1861:1555–1568. doi: 10.1016/j.bbalip.2016.02.011 - PubMed
    1. Hankiewicz JH, Banke NH, Farjah M, Lewandowski ED. Early impairment of transmural principal strains in the left ventricular wall after short-term, high-fat feeding of mice predisposed to cardiac steatosis. Circ Cardiovasc Imaging. 2010;3:710–717. doi: 10.1161/CIRCIMAGING.110.959098 - PMC - PubMed