. 2025 Feb;10(2):202-217.
doi: 10.1016/j.jacbts.2024.10.008. Epub 2024 Dec 18.

Therapeutic Efficacy of a Novel Pharmacologic GRK2 Inhibitor in Multiple Animal Models of Heart Failure

Affiliations

Therapeutic Efficacy of a Novel Pharmacologic GRK2 Inhibitor in Multiple Animal Models of Heart Failure

Rajika Roy et al. JACC Basic Transl Sci. 2025 Feb.

Abstract

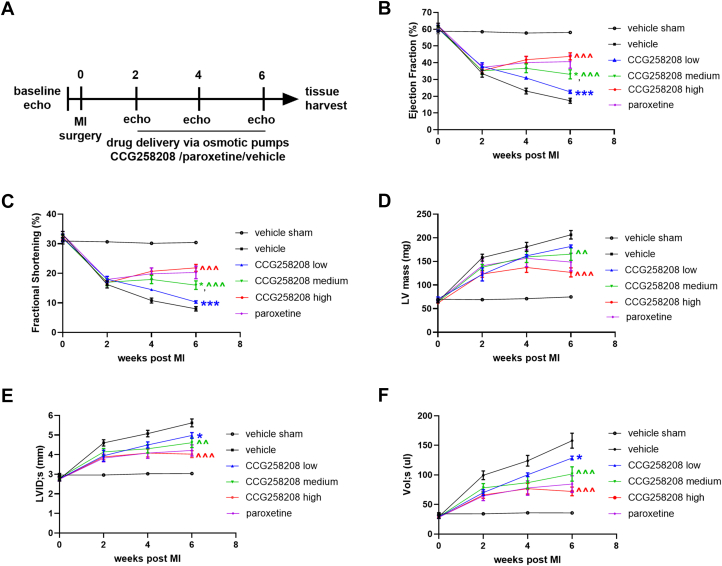
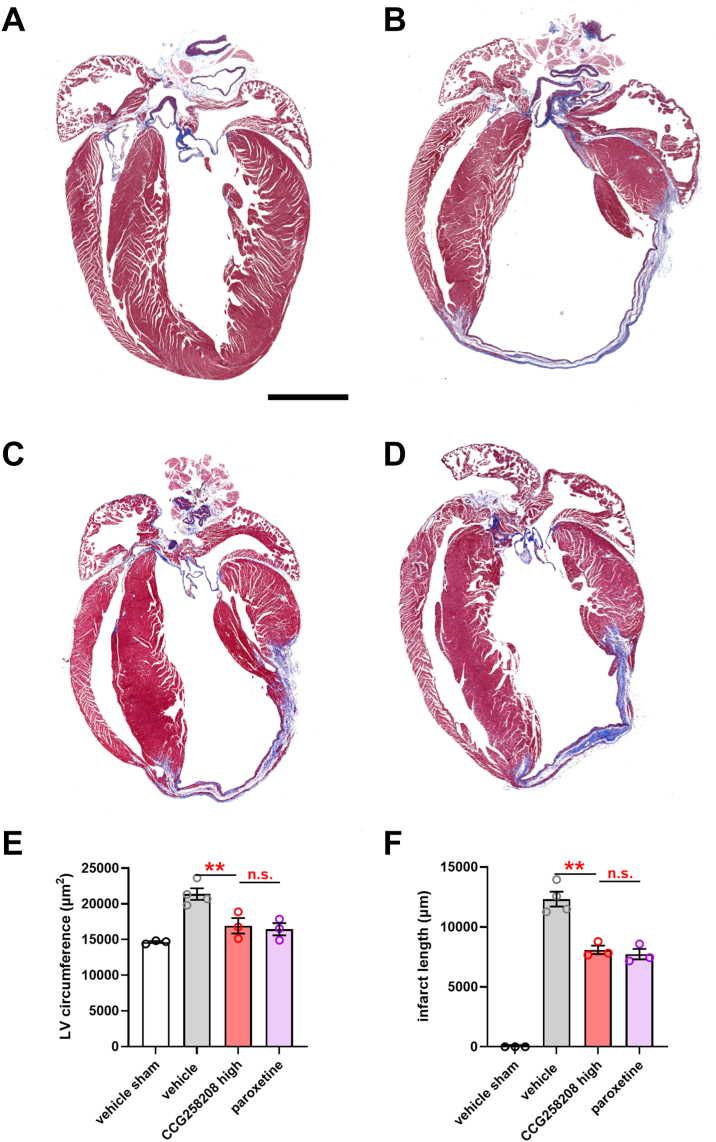
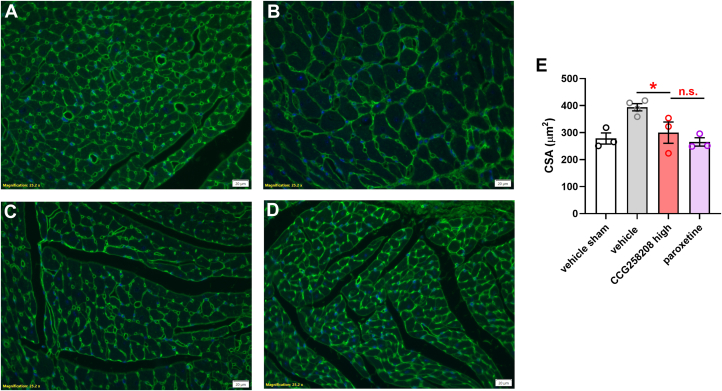
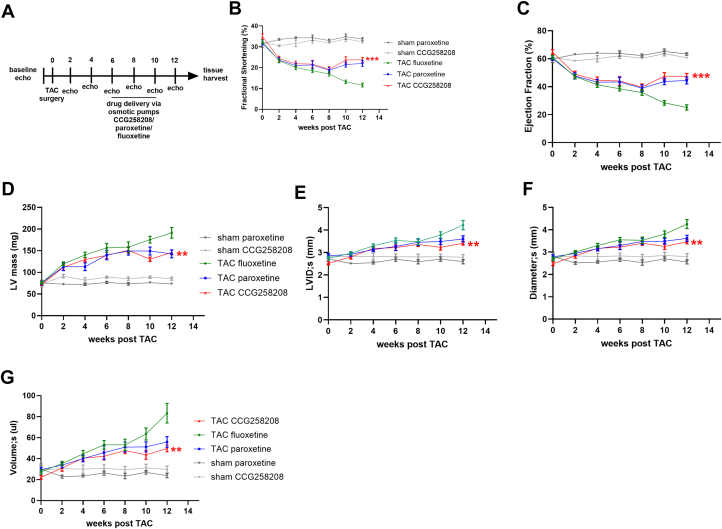
GRK2 is the most prominent G protein-coupled receptor kinase that is upregulated in heart failure (HF), and inhibiting GRK2 has improved cardiac function in mice. CCG258208, generated from the paroxetine scaffold, which has GRK2 inhibitory properties, has a 50-fold higher selectivity for GRK2 at 100-fold lower doses. We evaluated CCG258208 in 2 mice HF models and found that CCG258208 has robust therapeutic effects. In a chronic mini-swine HF model, acute administration of CCG258208 enhanced dobutamine inotropic responses. Our results indicate that CCG258208 has robust cardioprotective and HF-reversing effects in different HF models and it stands as a promising lead for HF therapy.

Keywords: GPCR; GRK2; LV function; cardiac pathophysiology; dobutamine; heart failure; paroxetine.


Conflict of interest statement

Funding Support and Author Disclosures This work was funded by National Institutes of Health grants R01 HL061690 and R01 HL157151 (to Dr Koch), AHA Merit Award (to Dr Koch) R01 HL071818 (to Drs Koch and Tesmer), and National Institutes of Health RO1 grants CA254402 and CA221289 (to Dr Tesmer). Funding for pharmacokinetics was provided by the PIDD (Purdue) FY20 Drug Evaluation Committee Project “Selective Inhibition of G Protein-Coupled Receptor Kinases for the Treatment of Heart Failure.” The authors have reported that they have no relationships relevant to the contents of this paper to disclose.

Figures

None
Graphical abstract
Figure 1
Figure 1
cAMP Levels in Cells With Control, Paroxetine, and CCG258208 Pretreatment (A) Cyclic adenosine monophosphate (cAMP) readouts in untreated and isoproterenol-treated cells. n = 3. #P < 0.001 compared with samples without isoproterenol. (B) Differences in cAMP readouts between control cells and cells pretreated with paroxetine and CCG258208. Data are presented as mean ± SEM, n = 3, and data are compared using 2-way analysis of variance followed by Tukey's multiple comparisons test. ∗∗P = 0.002 compared with control condition, ∗∗∗P < 0.001 compared with control condition. w = with; w/o = without.
Figure 2
Figure 2
Time Course of CCG258208 Distribution in Mouse Plasma and Organs (A) Distribution after peroral administration. Inhibitory concentrations (>30 nM) of the compound remain in both plasma and heart at 10× above IC50 level after 2 hours and at IC50 level after 4 hours. (B) Distribution 30 minutes after intraperitoneal administration. In either route of administration, no compound reaches the brain, eliminating serotonin reuptake inhibition associated off-target effects in that tissue. Data are presented as mean ± SD.
Figure 3
Figure 3
Dose-Dependent Effects of CCG258208 on Cardiac Function in Post-MI Mice Cardiac function was assessed in all mice by serial echocardiography using M-mode tracing. (A) Experimental design in which there was an even distribution of mice randomly assigned to all treatment and vehicle groups based on left ventricular (LV) ejection fraction and fractional shortening measurements at 2 weeks post–myocardial infarction (MI) to ensure similar functional starting points. Treatment groups were CCG258208 high (2 mg/kg/day), medium (0.5 mg/kg/day), and low (0.1 mg/kg/day); paroxetine (5 mg/kg/day); vehicle; and a vehicle sham group (n = 6-17 per group). (B) LV ejection fraction; (C) LV fractional shortening; (D) calculated LV mass; (E) left ventricular inner diameter at systole (LVID;s); (F) LV volume at systole (Vol;s). ∗P < 0.05 compared with paroxetine, ∗∗∗P < 0.001 compared with paroxetine, ∧∧P < 0.01 compared with vehicle, ∧∧∧P < 0.001 compared with vehicle. (B to F) High-dose CCG258208 was not significantly different from paroxetine. (D to F) Medium-dose CCG258208 was not significantly different from paroxetine. Data are presented as mean ± SEM. Linear mixed-effects models were used to determine predicted mean values at each assessment point and to test group differences at a given time point. In each linear mixed-effects model, time was included as a fixed effect. Vehicle sham: n = 17; vehicle: n = 13; CCG258208 high: n = 12; CCG258208 medium: n = 13; CCG258208 low: n = 6; paroxetine: n = 11. echo = echocardiography.
Figure 4
Figure 4
Gravimetric Analysis of Healthy and Post-MI Hearts Treated With CCG258208 Heart weight (HW) was normalized to (A) body weight (BW) and (B) tibia length (TL) to account for changes in growth rate in mice during the 6-week study period. (C) An increase in lung weight (LW) after myocardial infarction (MI) injury was also recorded and normalized to body weight. CCG258208 high was 2 mg/kg/day, CCG258208 medium was 0.5 mg/kg/day, and CCG258208 low was 0.1 mg/kg/day; n = 6 to 17 per group. Data are presented as mean ± SEM, and 1-way analysis of variance was used to compare group differences. ∗∗P < 0.01 compared with vehicle, ∗∗∗P < 0.001 compared with vehicle. n.s. = not significant.
Figure 5
Figure 5
Effect of CCG258208 Treatment on LV Circumference at 6 Weeks Post-MI Mice treated with high-dose CCG258208 had smaller infarcts and were less dilated compared with vehicle-treated mice, reflected by a smaller LV circumference at 6 weeks post-MI. Representative images of (A) sham vehicle–treated heart, (B) vehicle-treated post-MI heart, (C) CCG258208 high dose–treated post-MI heart, (D) paroxetine-treated post-MI heart. Magnification ×0.8; scale bar = 2,000 μm. (E) Quantification and group-wise comparisons of LV circumference. (F) Quantification and group-wise comparisons of infarct length. n = 3 to 4 per group. Data are presented as mean ± SEM, and 1-way analysis of variance was used to compare group differences. ∗∗P < 0.01 compared with vehicle. Abbreviations as in Figure 3.
Figure 6
Figure 6
Effect of CCG258208 Treatment on Post-MI Cardiomyocyte Cellular Hypertrophy Six weeks after myocardial infarction (MI) (4 weeks after drug treatment), hearts were fixed, sectioned, and stained with wheat germ agglutinin for measurements of myocyte cross-sectional area (CSA) as an assessment of cellular hypertrophy. Shown are representative sections and quantification. (A) Vehicle sham, (B) post-MI vehicle, (C) post-MI CCG258208 high-dose treatment, and (D) post-MI paroxetine treatment (×25.2 magnification; scale bar = 20 μm). (E) Quantification and group-wise comparisons (n = 3-4 per group). Data are presented as mean ± SEM, and 1-way analysis of variance was used to compare group differences. ∗P < 0.05 compared with vehicle. n.s. = not significant.
Figure 7
Figure 7
Effect of CCG258208 on Cardiac Function in Heart Failure Mice after TAC All measurements were made from serial M-mode transthoracic echocardiography. Two-dimensional images were acquired before (at baseline and 2, 4, and 6 weeks) and after (at 8, 10, and 12 weeks) treatment with CCG258208 or control groups. (A) Study design in which mice were treated from 6 weeks post–transverse aortic constriction (TAC) to 10 weeks post-TAC with CCG258208 (2 mg/kg/day), paroxetine (5 mg/kg/day), and fluoxetine 5 mg/kg/day, along with 2 sham groups (paroxetine and CCG258208 treated). (B) LV fractional shortening; (C) LV ejection fraction; (D) LV mass; (E) LVID;s; (F) LV diameter at systole; (G) LV volume at systole. Data are presented as mean ± SEM. Linear mixed-effects models were used to determine predicted mean values at each assessment point and to test group differences at a given time point. In each linear mixed-effects model, time was included as a fixed effect. ∗∗P < 0.01 compared with fluoxetine, ∗∗∗P < 0.001 compared with fluoxetine. There was no difference between CCG258208 and paroxetine in any of the measured functional parameters. Sham paroxetine: n = 5; sham CCG258208: n = 5; TAC CCG258208: n = 8; TAC paroxetine: n = 8; TAC fluoxetine: n = 10. Abbreviations as in Figure 3.
Figure 8
Figure 8
Effect of CCG258208 on Cardiac Hypertrophy Post-TAC Following 12 weeks post-TAC, mice were sacrificed and HW was compared with BW and TL. Shown are the quantification of (A) HW/BW ratios and (B) HW/TL ratios. n = 5 to 10 per group. Data are presented as mean ± SEM, and 1-way analysis of variance was used to compare group differences. ∗∗P < 0.01 compared with TAC fluoxetine. Abbreviations as in Figures 4 and 7.
Figure 9
Figure 9
Effect of CCG258208 Treatment on Post-TAC Cardiomyocyte Cross-Sectional Area Twelve weeks after TAC, hearts were fixed, sectioned, and stained with wheat germ agglutinin for measurements of myocyte CSA as an assessment of cellular hypertrophy. Shown are representative sections and quantification. (A) Representative images of stained heart sections from TAC and sham hearts treated with paroxetine, CCG258208, or fluoxetine. (B) Quantification of myocytes (in arbitrary units [AU]) from groups from left ventricular, right ventricular, and septum areas of the hearts. Red indicates wheat germ agglutinin, blue indicates DAPI. Image magnification ×20, n = 3 per group. Data are presented as mean ± SEM, and 1-way analysis of variance was used to compare group differences. ∗P < 0.05 compared with TAC fluoxetine. Abbreviations as in Figures 6 and 7.
Figure 10
Figure 10
Effect of CCG258208 Treatment on Left Ventricular Microvasculature 12 Weeks Post-TAC Twelve weeks after transverse aortic constriction (TAC), hearts were fixed, sectioned, and stained with anti-CD31, an endothelial marker as a measure of altered microvasculature after cardiac injury and heart failure. Shown are representative sections and quantification. (A) Representative images of stained heart sections from TAC and sham hearts treated with paroxetine, CCG258208, or fluoxetine (as labeled). (B) Quantification of microvasculature in the left ventricle, septum, and right ventricle. Red indicates CD31, Blue indicates DAPI, Image magnification ×40, n = 3 per group. Data are presented as mean ± SEM, and 1-way analysis of variance was used to compare group differences. ∗P < 0.05 compared with TAC fluoxetine. HPF = high-power field.
Figure 11
Figure 11
Effect of CCG258208 Treatment on Cardiac Fibrosis Post-TAC Twelve weeks after transverse aortic constriction (TAC), hearts were fixed, sectioned, and stained with Masson’s trichrome to assess and quantitate interstitial and perivascular fibrotic areas of the post-TAC hearts. (A) Representative whole-mount sections of 12 weeks post-TAC hearts from groups treated with fluoxetine, paroxetine, or CCG258208. Image magnification ×0.8; scale bar = 2,000 μm. (B) Representative sections showing interstitial fibrosis. Image magnification ×20; scale bar = 20 μm. (C, E) Quantification of groups for interstitial and perivascular fibrosis (n = 3 each), Data are presented as mean ± SEM, and 1-way analysis of variance was used to compare group differences. ∗P < 0.05 compared with fluoxetine. (D) Representative sections showing perivascular fibrosis around the left ventricular vasculature. Image magnification ×20; scale bar = 20 μm. A.U. = arbitrary units; n.s. = not significant.
Figure 12
Figure 12
Effect of Acute CCG258208 Administration on Systolic Pressure and β-Adrenergic Inotropic Reserve in Mini-Pigs With Chronic Heart Failure (A) Göttingen mini-swine that had chronic heart failure 3 months after MI was studied experimentally as shown with a baseline hemodynamic assessment (see Methods for details), first dobutamine infusion (10 mg/kg/min) followed by 2 boluses of CCG258208 (2 mg/kg each bolus) or fluoxetine (5 mg/kg each bolus) (n = 3 each), and a second dobutamine infusion. ˆ indicates all points in which pressure recordings were made. (B) Change in end-systolic pressure (ESP) in CCG258208 and fluoxetine groups between the first and second dobutamine administrations. (C) LV +dP/dtmax % change in CCG258208 and fluoxetine-treated pigs between the first and second dobutamine administration. Data are presented as mean ± SEM. ∗P < 0.05 vs fluoxetine-treated swine. Abbreviations as in Figure 3.

References

    1. Virani S.S., Alonso A., Benjamin E.J., et al. Heart Disease and Stroke Statistics-2020 Update: a report from the American Heart Association. Circulation. 2020;141:e139–e596. - PubMed
    1. Cohn J.N., Archibald D.G., Ziesche S., et al. Effect of vasodilator therapy on mortality in chronic congestive heart failure. Results of a Veterans Administration Cooperative Study. N Engl J Med. 1986;314:1547–1552. - PubMed
    1. Casu G., Merella P. Diuretic therapy in heart failure - current approaches. Eur Cardiol. 2015;10:42–47. - PMC - PubMed
    1. Massie B.M. 15 years of heart-failure trials: what have we learned? Lancet. 1998;352(Suppl 1):SI29–SI33. - PubMed
    1. Packer M., Anker S.D., Butler J., et al. Effect of empagliflozin on the clinical stability of patients with heart failure and a reduced ejection fraction: the EMPEROR-Reduced trial. Circulation. 2021;143:326–336. - PMC - PubMed