. 2025 Mar 25:13:RP103492.
doi: 10.7554/eLife.103492.

Genomic and structural insights into Jyvaskylavirus, the first giant virus isolated from Finland

Affiliations

Genomic and structural insights into Jyvaskylavirus, the first giant virus isolated from Finland

Gabriel Magno de Freitas Almeida et al. Elife. .

Abstract

Giant viruses of protists are a diverse and likely ubiquitous group of organisms. Here, we describe Jyvaskylavirus, the first giant virus isolated from Finland. This clade B marseillevirus was found in Acanthamoeba castellanii from a composting soil sample in Jyväskylä, Central Finland. Its genome shares similarities with other marseilleviruses. Helium ion microscopy and electron microscopy of infected cells unraveled stages of the Jyvaskylavirus life cycle. We reconstructed the Jyvaskylavirus particle to 6.3 Å resolution using cryo-electron microscopy. The ~2500 Å diameter virion displays structural similarities to other Marseilleviridae giant viruses. The capsid comprises of 9240 copies of the major capsid protein, encoded by open reading frame (ORF) 184, which possesses a double jellyroll fold arranged in trimers forming pseudo-hexameric capsomers. Below the capsid shell, the internal membrane vesicle encloses the genome. Through cross-structural and -sequence comparisons with other Marseilleviridae using AI-based software in model building and prediction, we elucidated ORF142 as the penton protein, which plugs the 12 vertices of the capsid. Five additional ORFs were identified, with models predicted and fitted into densities that either cap the capsomers externally or stabilize them internally. The isolation of Jyvaskylavirus suggests that these viruses may be widespread in the boreal environment and provide structural insights extendable to other marseilleviruses.

Keywords: NCLDV; giant viruses; infectious disease; marseilleviruses; microbiology; molecular biophysics; structural biology; viruses.

Plain language summary

Viruses are everywhere. Some viruses can cause illness in humans, which has led to people often viewing them as threats. But most viruses are harmless to humans. Many viruses target microbes instead of humans. These viruses likely play essential roles in maintaining a healthy balance in ecosystems by preventing overpopulation of their target microbes. Yet, scientists know very little about most viruses and their role in ecosystems. Scientists have recently discovered a special group of giant viruses that target microscopic creatures called amoebas. The giant viruses that target them are much larger than most viruses and have some other unique features, such as having large genomes. A tough outer coating provides the structural reinforcement necessary to support their large size. Most of the giant viruses identified so far have been discovered in Europe and South America. A few have been found in North Africa, India, Japan and Siberia. But scientists still do not know how many giant viruses there are and where else they exist around the world. They are also still learning about the structures that allow these giant viruses to be so large. Almeida et al. describe the first giant virus ever discovered in Finland. In the experiments, the researchers mixed a type of amoeba called Acanthamoeba castellanii with environmental samples and monitored the amoebas for infection. The experiments revealed a giant amoeba-infecting virus in a compost sample. Almeida et al. named it Jyvaskylavirus after the city from which the compost sample came. The investigators then sequenced the virus’ DNA and used a cutting-edge imaging tool called cryogenic electron microscopy and artificial intelligence to determine details of the viral structure. This detailed structure of Jyvaskylavirus provided information about the structure of giant viruses and key structural proteins, which may also benefit scientists studying other kinds of viruses. The experiments confirm that giant viruses are a part of Finland’s boreal forest ecosystem, extending the known range of these unusual viruses. More studies are needed to identify the full range of giant viruses worldwide and to understand their role in ecosystems.


Conflict of interest statement

GA, IA, Bd, ML, JA, JA, DZ, JR, NA, LS No competing interests declared

Figures
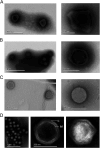
Figure 1.
Figure 1.. Transmission electron microscopy images of negative stained virus-like particles isolated from Finnish samples.
(A) Left, diamond-shaped virions found in a Recirculating Aquaculture System (RAS) tank sample and in experimental aquarium samples. Right, enlarged view showing the virion interior with at least three attachment points to the external capsid. (B) Left, virions with loosely structured capsids found in a RAS tank sample and in experimental aquarium samples. Right, detailed view of one virion of this morphotype. (C) Left, round morphotype found in an experimental aquarium sample; right, enlarged view of a spherical-shaped virion. (D) Left, clusters of full and empty Jyvaskylavirus virions isolated from a composting soil sample. Center, an empty capsid showing the double-layered architecture of Jyvaskylavirus; C marks the capsid and IM marks the putative internal membrane. Right, a fully packaged Jyvaskylavirus virion.
Figure 2.
Figure 2.. Jyvaskylavirus genomic data.
(A) Representative map of Jyvaskylavirus genome features. The G-C content, G-C skew, and open reading frames (ORFs) distribution throughout the DNA sequence are coded by different ring colors as indicated in the color legend above. ORFs coding for the structural proteins mentioned in this paper are indicated by their ORF number. The outer blue ring represents the forward strand (positive sense) whereas the inner blue ring represents the reverse strand (negative sense). This illustrative genome map was constructed using CGView server (Grant and Stothard, 2008). (B) Number of Jyvaskylavirus proteins according to the function predicted during genome annotation; n=388. (C) Maximum-likelihood phylogenetic tree based on DNA polymerase family B amino acid sequences from different nucleocytoviruses. The Jyvaskylavirus sequence is indicated by a blue circle. An asterisk (*) marks close viruses with structures obtained by cryo-electron microscopy (cryo-EM). The alignment was performed with MUSCLE and the maximum-likelihood tree was reconstructed using IQtree software using ultrafast bootstrap (1000 replicates). The best-fit model selected using ModelFinder (implemented in IQtree) was VT+F+ R5. Scale bar indicates the number of substitutions per site.
Figure 3.
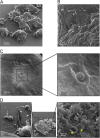
Figure 3.. Helium ion microscopy images of Jyvaskylavirus attachment to A. castellanii cells.
(A) A. castellanii cells with spined structures (acanthopodia); elongated cell at the center. (B) Details of a cell containing several viral particles on its surface (white arrowheads mark virions). (C) Icosahedrally shaped virions near cell surface invaginations appearing as craters; inset, details of a virion likely starting the infection process through endocytosis. (D) Center, one cell containing viruses on its surface (white arrowhead) near a burst cell displayed with its ruptured content. Right inset, details of the burst cell content, showing several vesicles (yellow asterisks) and viruses (white arrowheads). Left inset, clusters of virions inside extracellular vesicles indicated by white arrows and individual virions by white arrowheads.
Figure 4.
Figure 4.. Transmission electron microscopy images of thin sections of A. castellanii cells infected by Jyvaskylavirus.
(A) Infected cell containing viruses spread over its cytoplasm marked by C (green) and with intracellular vesicles filled with viruses indicated by white arrows. The nucleus, whose boundary is highlighted in semitransparent cyan, is indicated by the letter N (cyan). (B) One infected cell with a large viral factory (VF, red) in its cytoplasm. (C) View of an intracellular vesicle with icosahedral genome-filled virions as marked by a white arrowhead; membrane-related structures nearby the vesicle interior are marked by dark-yellow triangles. NM (light cyan) and M (yellow) mark the nuclear membrane and the mitochondria, respectively. (D) Enlarged view of the region marked by the black rectangle in (C) showing possible membrane-related structure juxtaposed to or detached from the vesicle interior; black triangles possibly indicated a forming membrane vesicle. (E) Details of virions in different stages of maturation inside the viral factory; DNA-full particles in white arrowheads, empty particles in blue arrowheads. (F) Putative stages of virion assembly (indicated by the black arrows) as derived from the inspection of distinct particles in E and other cellular sections. The white elliptical line highlights a capsid aperture, while the red asterisk indicates an assembling capsid; in the remaining virion images, the capsid appears more assembled.
Figure 5.
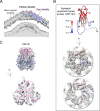
Figure 5.. Jyvaskylavirus cryo-electron microscopy (cryo-EM) reconstruction.
(A) Left, a central slab of the isosurface of the 3D density map, downsampled to a pixel size of 5.36 Å, low-pass filtered to 15 Å, and normalized, showing the interior of the virion color-coded by radius as from key. The white arrowhead marks the membrane bilayer, while the red asterisk highlights the membrane bulging beneath the fivefold vertex. Right, isosurface of half the virion with black arrows indicating the triangulation indices h=7, k=13 (T=309). A threshold level of 0.6 was used in ChimeraX to render both views (Pettersen et al., 2004). (B) Representation of the virion using trisymmetron geometry, with each trisymmetron color-coded differently, and a pentasymmetron marked by a pentagonal black line. (C) A schematic of a virus facet with a trisymmetron marked with a white triangle with three icosahedral asymmetric units (IAU), one of which is marked by a thick black line. The pseudo-hexameric morphology displayed by a capsomer is represented by a hexagon colored in light blue, while the true trimeric state of the major capsid protein (MCP) is depicted as a yellow triangle. To build the IAU (excluding the penton protein), 51 pseudo-hexameric capsomers and one-third of the capsomer located at the threefold symmetry axis are required, resulting in a total of 154 MCPs forming the IAU. The inset shows a cut-through of the density along the threefold axis of a capsomer. (D) AlphaFold3 prediction of the MCP ORF184 shows, with very high confidence, that the fold adopted by the ORF is a vertical double jellyroll. (E) Trimeric model of the capsomers rigid body fitted into the original cryo-EM density and rendered in ChimeraX; left, viewed along the trimer fold axis and on the right, viewed orthogonally to it. The three copies of the MCP are represented in cartoon and colored in green, light magenta, and light blue, while the corresponding density is shown in white transparent surface.
Figure 6.
Figure 6.. Jyvaskylavirus penton and capsomer-cap proteins.
(A) Cut-through view of the virion cryo-electron microscopy (cryo-EM) density (binned twice from original size) at the fivefold axis rendered in gray in ChimeraX, with some regions of the capsid shell colored to highlight the penton density (light brown), the major capsid protein densities (slate-blue) and within the parallel outlined black lines and the cap densities (pink), other regions beneath the major capsid proteins (MCPs) and penton correspond to different minor capsid proteins; the black asterisks mark the peripentonal capsomers. (B) Top, a cartoon representation of the predicted model of the penton protein, with strands labeled BIDG/CHEF and color-coded by confidence level. Center and bottom, penton complex fitted into the density, shown from the top and as a cut-through, respectively. (C) Top, atomic model of the trimeric cap in pink cartoon, composed of three copies of ORF121 with a β-barrel fold inserted on top of the pseudo-hexameric capsomer, shown in slate-blue cartoon. Bottom, cut-through view of the cap model fitted into the original density, Gaussian filtered, and rendered as semitransparent gray in ChimeraX.
Figure 7.
Figure 7.. Jyvaskylavirus pentasymmetron protein components and trisymmetron facet glueing protein.
(A) Top left, view of the cryo-electron microscopy (cryo-EM) density of Jyvaskylavirus (binned four times from the original size and Gaussian filtered) as seen from within the virion along the fivefold icosahedral symmetry axis. The white pentameric line marks the pentasymmetron region from below, while the white circle highlights the density corresponding to some identified proteins. Further densities corresponding to cementing, zippering, and lattice scaffolding proteins are also visible, with one of them colored in dodger-blue (see also B). The enlarged inset (top right and below) shows the spatial organization of the four identified open reading frames (ORFs) and modeled using AlphaFold3, represented as cartoon tubes and colored as per the legend. The penton proteins are colored light brown, while peripentonal capsomers and capsomer-cap proteins are shown as space-filled atoms and colored as slate-blue and pink, respectively. Left bottom, the different protein components fitted into the original 6.3 Å resolution Jyvaskylavirus cryo-EM density (white semitransparent) binned to 2.68 Å/pix and rendered in ChimeraX; major capsid proteins (MCPs) and capsomer-cap proteins have been omitted for clarity (for fitting metric, see Materials and methods). (B) Left, view of the cryo-EM density of Jyvaskylavirus, as shown in the top left panel of (A), but along the threefold icosahedral symmetry axis. A cementing protein, colored red, runs through the capsomers; however, the corresponding ORF has not been identified. Densities colored dodger-blue, which glue the capsomers across two trisymmetrons, correspond to ORF119, as shown in the large inset on the right. In this inset, stereo view of dimers of ORF119 are depicted as dodger-blue cartoons fitted into the original cryo-EM density, Gaussian filtered, and rendered as semitransparent gray in ChimeraX. At the bottom right, a 90 degree stereo view shows the spatial arrangement between two capsomers (navy blue), with the cap protein ORF121 (pink cartoon) positioned on top, and ORF119 fitted into the density at the base of the adjacent MCPs.
Appendix 1—figure 1.
Appendix 1—figure 1.. Details of our preliminary screening for Finnish giant viruses effort.
(A) Non-nutrient agar plate used for amoebal isolation. (B) Amoebal-like cells spreading from a block of agar. (C) Amoebal-like cells growing on top of a non-nutrient agar plate. (D) Control culture from an isolation attempt. (E–F) Cytopathic effect seen in two different samples. (G–K) Viral-like particles seen by electron microscopy.
Appendix 1—figure 2.
Appendix 1—figure 2.. Jyvaskylavirus growth curve, sensitivity to chloroform, and stability.
(A) Growth curve in A. castellanii cells. (B) Jyvaskylavirus sensitivity to chloroform exposure. (C) Jyvaskylavirus stability after storage for 109 days in different temperatures. The original titer at day 0 was 1011 TCID50/ml. Data shown in A and B were titrated in quadruplicates and in C in octuplicates.
Appendix 1—figure 3.
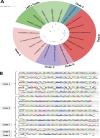
Appendix 1—figure 3.. Jyvaskylavirus phylogeny and genome synteny.
(A) Phylogenetic tree reconstructed using major capsid protein (MCP) amino acid sequences belonging to viruses from Marseilleviridae family. The Jyvaskylavirus sequence is highlighted in bold and indicated by a red circle. The alignment was performed with MUSCLE and the maximum-likelihood tree was reconstructed using IQtree software using ultrafast bootstrap (1000 replicates). The best-fit model selected using ModelFinder (implemented in IQtree) was rtREV+F+G4. Scale bar indicates the number of substitutions per site. (B) Genome synteny scheme showing the MAUVE alignment of complete genome sequences belonging to marseilleviruses from five different lineages (clades A–E). Similar genome blocks are coded by the same color in each sequence. Blocks represented above the x-axis are in the forward strand whereas blocks represented below the x-axis are in the reverse strand.
Appendix 1—figure 4.
Appendix 1—figure 4.. Fourier Shell correlation curve of the whole Jyvaskylavirus reporting a resolution of 6.3 Å at the 0.143 criterion (black line: corrected map); other colored curves indicate the following: blue line, masked maps; red line, phase-randomized masked maps; and green line, unmasked maps.
Appendix 1—figure 5.
Appendix 1—figure 5.. Schematic workflow illustrating the identification of additional open reading frames (ORFs) corresponding to ancillary proteins using an integrative approach combining ModelAngelo, AlphaFold3, and ChimeraX software.
Large, numbered arrows indicate the sequences of key steps in the workflow: the red arrow marks the use of ModelAngelo to build the polypeptide chains in the Melbournevirus maps; the blue arrow indicates the step of predicting the fold of the identified Jyvaskylavirus ORFs; and the orange arrow marks the step in which the sequences of the Jyvaskylavirus proteins were queried against the reference Melbournevirus isolate 1 (NCBI Reference Sequence: NC_025412.1).
Appendix 1—figure 6.
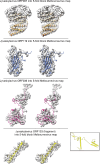
Appendix 1—figure 6.. Stereo-view (cross-eye) of the identified Jyvaskylavirus open reading frames (ORFs) corresponding to the ancillary proteins beneath the capsid shell fitted into the cryo-electron microscopy (cryo-EM) Melbournevirus fivefold block reconstructed density (EMD-37190) shown in semitransparent white; a B-factor of –5 Å2 and resolution cutoff to 4 Å have been applied to the original map for clarity.
ORF097 forms a clear dimer while only a helical fragment of ORF153 has been depicted (the inset shows the full prediction). While the predicted core folds of the individual AlphaFold3 models align reasonably well with the density map, the terminal ends, predicted to be flexible, do not fit within the density.
Appendix 1—figure 7.
Appendix 1—figure 7.. Melbournevirus fivefold block reconstructed density (EMD-37190) in semitransparent white (a B-factor of –5 Å2 and resolution cutoff to 4 Å have been applied to the original map for clarity), with the predicted Jyvaskylavirus 3D models of the major capsid protein (ORF184) fitted into the density, composing the peripentonal pseudo-hexameric capsomers represented as spheres in medium blue and capped at the top by ORF121 trimers (shown as pink spheres); five copies of the penton protein (ORF142), represented as cartoon tubes in light-brown color, plug the vertex.
Below, different pentasymmetron protein components are represented as cartoon tubes, corresponding to a fragment of ORF153 (yellow), ORF97 (as dimer, color-coded in goldenrod and orange), ORF119 (dodger-blue), and ORF36 (hot pink); not all the density below the vertices is accounted for with the fitted models. Boxing the map around the pentameric assembly atomic model and performing rigid-body fitting yielded a CCmask of 57.3%.
Appendix 1—figure 8.
Appendix 1—figure 8.. Top left, view of the twofold block cryo-electron microscopy (cryo-EM) density reconstruction of Melbourne virus (Gaussian filtered for clarity and rendered as a light gray surface) as seen from within the virion along the twofold icosahedral symmetry axis; densities along the edge of two adjacent trisymmetron are colored in dodger-blue, similar to Figure 7A (top left).
Top right, enlarged inset corresponding to the region marked by a white circle on the left; this shows the original density with an applied B-factor of –5 Å2 and a resolution cutoff of 4 Å for clarity, revealing details of the secondary structure elements of different ancillary proteins. Bottom right, stereoview (cross-eye) of the ORF119 fitted into density showing the matching with the map with the exception of the terminal ends. Bottom left, fitting of two copies of capsomers displayed as in Appendix 1—figure 7 and viewed perpendicularly to the direction of the twofold axis showing the spatial organization between the copies of ORF119 and the capsomers.
Appendix 1—figure 9.
Appendix 1—figure 9.. A side-by-side comparison of the predicted Jyvaskylavirus ORF142 with experimentally derived penton proteins of the lipid-containing bacteriophage PRD1 and the archaeal virus Haloarcula californiae icosahedral virus 1, represented as cartoon tube models color-coded from blue to red in a rainbow gradient from the N-terminal to the C-terminal, with the corresponding PDB ID codes in parentheses.
Appendix 1—figure 10.
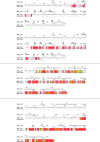
Appendix 1—figure 10.. Sequence alignment of selected Jyvaskylavirus minor capsid protein sequences (ORF036, ORF097, and ORF153) with residues modeled into the Melbournevirus density map at ~3.5 Å resolution using ModelAngelo, visualized with the ESPRIPT software (https://espript.ibcp.fr/ESPript/ESPript/).
Strictly conserved residues are highlighted with red boxes and white characters, while similar residues are marked with yellow boxes and black characters. Secondary structure elements, as predicted by AlphaFold3, are shown above the alignment. Cysteine residues forming disulfide bonds in the predicted structure are indicated by green numbers below the alignment. The chains modeled by ModelAngelo are labeled according to the specific fragments that the software could build within the density regions.

Update of

  • doi: 10.1101/2024.10.16.618641
  • doi: 10.7554/eLife.103492.1
  • doi: 10.7554/eLife.103492.2

Similar articles

Cited by

References

    1. Abrahão J, Silva L, Silva LS, Khalil JYB, Rodrigues R, Arantes T, Assis F, Boratto P, Andrade M, Kroon EG, Ribeiro B, Bergier I, Seligmann H, Ghigo E, Colson P, Levasseur A, Kroemer G, Raoult D, La Scola B. Tailed giant Tupanvirus possesses the most complete translational apparatus of the known virosphere. Nature Communications. 2018;9:749. doi: 10.1038/s41467-018-03168-1. - DOI - PMC - PubMed
    1. Abramson J, Adler J, Dunger J, Evans R, Green T, Pritzel A, Ronneberger O, Willmore L, Ballard AJ, Bambrick J, Bodenstein SW, Evans DA, Hung C-C, O’Neill M, Reiman D, Tunyasuvunakool K, Wu Z, Žemgulytė A, Arvaniti E, Beattie C, Bertolli O, Bridgland A, Cherepanov A, Congreve M, Cowen-Rivers AI, Cowie A, Figurnov M, Fuchs FB, Gladman H, Jain R, Khan YA, Low CMR, Perlin K, Potapenko A, Savy P, Singh S, Stecula A, Thillaisundaram A, Tong C, Yakneen S, Zhong ED, Zielinski M, Žídek A, Bapst V, Kohli P, Jaderberg M, Hassabis D, Jumper JM. Accurate structure prediction of biomolecular interactions with AlphaFold 3. Nature. 2024;630:493–500. doi: 10.1038/s41586-024-07487-w. - DOI - PMC - PubMed
    1. Abrescia NGA, Cockburn JJB, Grimes JM, Sutton GC, Diprose JM, Butcher SJ, Fuller SD, San Martín C, Burnett RM, Stuart DI, Bamford DH, Bamford JKH. Insights into assembly from structural analysis of bacteriophage PRD1. Nature. 2004;432:68–74. doi: 10.1038/nature03056. - DOI - PubMed
    1. Afonine PV, Poon BK, Read RJ, Sobolev OV, Terwilliger TC, Urzhumtsev A, Adams PD. Real-space refinement in PHENIX for cryo-EM and crystallography. Acta Crystallographica. Section D, Structural Biology. 2018;74:531–544. doi: 10.1107/S2059798318006551. - DOI - PMC - PubMed
    1. Aherfi S, Colson P, La Scola B, Raoult D. GIant viruses of amoebas: An update. Frontiers in Microbiology. 2016;7:349. doi: 10.3389/fmicb.2016.00349. - DOI - PMC - PubMed

Substances

LinkOut - more resources