. 2025 Mar 25;10(9):e191098.
doi: 10.1172/jci.insight.191098. eCollection 2025 May 8.

CFTR negatively reprograms Th2 cell responses, and CFTR potentiation restrains allergic airway inflammation

Affiliations

CFTR negatively reprograms Th2 cell responses, and CFTR potentiation restrains allergic airway inflammation

Mark Rusznak et al. JCI Insight. .

Abstract

Type 2 inflammatory diseases, including asthma, sinusitis, and allergic bronchopulmonary aspergillosis, are common in cystic fibrosis (CF). CD4+ Th2 cells promote these diseases through secretion of IL-4, IL-5, and IL-13. Whether the CF transmembrane conductance regulator (CFTR), the mutated protein in CF, has a direct effect on Th2 development is unknown. Using murine models of CFTR deficiency and human CD4+ T cells, we show that CD4+ T cells expressed Cftr transcript and CFTR protein following activation. Loss of T cell CFTR expression increased Th2 cytokine production compared with control cells. Mice with CFTR-deficient T cells developed increased allergic airway disease to Alternaria alternata extract compared with control mice. Culture of CFTR-deficient Th2 cells demonstrated increased IL-4Rα expression and increased sensitivity to IL-4 with greater induction of GATA3 and IL-13 compared with control Th2 cell cultures. The CFTR potentiator ivacaftor reduced allergic inflammation and type 2 cytokine secretion in bronchoalveolar lavage of humanized CFTR mice following Alternaria alternata extract challenge and decreased Th2 development in human T cell culture. These data support a direct role of CFTR in regulating T cell sensitivity to IL-4 and demonstrate a potential CFTR-specific therapeutic strategy for Th2 cell-mediated allergic disease.

Keywords: Adaptive immunity; Immunology; Inflammation; Pulmonology; T cell development; Th2 response.


Conflict of interest statement

Conflict of interest: The authors have declared that no conflict of interest exists.

Figures

Figure 1
Figure 1. CFTR is expressed in CD4+ T cells, induced with CD4+ T cell polarization, and upregulated with Th2 cell reactivation.
(A) Reverse transcriptase PCR gel for CFTR mRNA (predicted size of 125 bp; arrow) in Cftr+/+ and Cftr−/− mouse CD4+ T cells. Lane 1 is a 100 bp ladder. (B) qPCR analysis of Cftr expression in Cftr+/+ and Cftr−/− mouse CD4+ T cells at 0 and 24 hours following TCR ligation with anti-CD3 and anti-CD28 mAbs (n = 4 per genotype and time point). (C) Immunostaining of CFTR (green), plasma membrane lectin (red), and nuclei (blue) in 24-hour–cultured mouse CD4+ cells (3 different biologic replicates per genotype, Cftr+/+ and Cftr−/−). Scale bar: 10 μm. (D) Immunoprecipitated CFTR protein in immortalized human CD4+ T cells (Jurkat) using UNC-450 anti-CFTR monoclonal antibody (mAb) for pulldown and UNC-596 anti-CFTR mAb for detection compared with immunoprecipitation isotype control. (EH) qPCR analysis of Cftr expression in Cftr+/+ and Cftr−/− cultured mouse CD4+ T cells at 0, 6, 18, 48, 72, and 78 hours in Th2 (E), Th1 (F), Th17 (G), and Tregs (H) (n = 3 per genotype per time point). Dotted lines represent TCR ligation with anti-CD3 (1 μg/mL) and anti-CD28 (0.5 μg/mL) mAbs and (a) anti–IFN-γ (10 μg/mL) and mouse IL-4 (10 ng/mL) for Th2 cells, (b) anti–IL-4 (10 μg/mL) and mouse IL-12 (10 ng/mL) for Th1 cells, and (c) human TGF-β (0.5 ng/mL), mouse IL-23 (10 ng/mL), mouse IL-6 (40 ng/mL), mouse IL-1b (10 ng/mL), anti–IL-4 (10 μg/mL), and anti–IFN-γ (10 μg/mL) for Th17 cells. Tregs were polarized and restimulated with anti-CD3 (1 μg/mL), human IL-2 (100 IU/mL), and recombinant human TGF-β (1ng/mL). Data are shown as mean ± SD. Statistical analysis were done in B and EH by 1-way ANOVA followed by Tukey’s honestly significant difference (HSD) post hoc test for multiple comparisons. *P < 0.05, **P < 0.01, ***P < 0.001, and ****P < 0.0001.
Figure 2
Figure 2. Loss of CFTR increases Th2 polarization and effector function.
(A) Schematic diagram showing isolation and stimulation of naive CD4+ T cells. (B and C) IL-5 and IL-13 by ELISA in cellular supernatant from Cftr+/+ and Cftr−/− CD4+ T cells grown in culture stimulated with mouse IL-4 (n = 5 mice per genotype). (D) Representative gating strategy for IL-13 expression in cultured Cftr+/+ and Cftr−/− CD4+ T cell populations gated on live lymphoid cells. (E) IL-13 median fluorescence intensity (MFI) of cultured Cftr+/+ and Cftr−/− CD4+ T cells (n = 5 mice per genotype). (F) IL-13 by ELISA in cellular supernatant from Cftr+/+ CD4+ T cells grown in culture with the CFTR inhibitor, GlyH-101, or control vehicle (DMSO) stimulated with mouse IL-4. (G and H) IL-5 and IL-13 by ELISA in cellular supernatant from mouse CD4+ T cells expressing either wild-type human CFTR or hCFTRΔF508 grown in culture with Elexacaftor/Tezacaftor/ Ivacaftor (ETI) or DMSO control (n = 5 mice per genotype per condition). Data are shown as mean ± SD. Statistical analysis were performed using unpaired Student’s t test (B, C, E, and F) and by 1-way ANOVA (G and H) followed by Tukey’s honestly significant difference (HSD) post hoc test for multiple comparisons. *P < 0.05, **P < 0.01, and ****P < 0.0001.
Figure 3
Figure 3. CD4+ T cell–specific CFTR deficiency increases Alternaria extract–induced (AE-induced) allergic inflammation.
(A) Schematic diagram showing adaptive model of intranasal AE-induced airway inflammation in CD4Cre−Cftrfl/fl and CD4Cre+Cftrfl/fl mice. (B) IgE concentrations by ELISA in serum from treated mice (n = 4–5 depending on genotype and condition). (CF) The number of macrophages (C), neutrophils (D), eosinophils (E), and lymphocytes (F) in the BALF of PBS- or AE-challenged mice (n = 4–5 per genotype and condition). (G and H) IL-5 and IL-13 by ELISA in BAL from CD4Cre−Cftrfl/fl and CD4Cre+Cftrfl/fl mice treated with either AE or PBS control (n = 4–5 per genotype and condition). Open circles represent AE sensitized and challenged mice, and closed circles denote PBS control mice. Black circles denote CD4Cre−Cftrfl/fl and red circles indicate CD4Cre+Cftrfl/fl mice. Statistical analysis in BH were done by 1-way ANOVA followed by Tukey’s honestly significant difference (HSD) post hoc test for multiple comparisons. *P < 0.05, **P < 0.01, ***P < 0.001, and ****P < 0.0001.
Figure 4
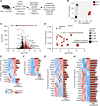
Figure 4. Loss of CFTR in Th2 cells increases whole transcriptome type 2 immune–specific gene expression.
(A) Schematic diagram showing isolation and polarization of naive CD4+ T cells to Th2 cells for whole transcriptome analysis. (B) PCA plot of gene expression data for 3 biological replicates used for bulk RNA-Seq of Cftr+/+ (black dots) and Cftr−/− (red dots) Th2 cells. (C) Volcano plot depicting DESeq2 analysis of differentially expressed genes in Cftr+/+ and Cftr−/− Th2 cells. Red dots represent genes expressed at higher levels in Cftr−/− Th2 cells, while black dots represent genes with higher expression levels in Cftr+/+ Th2 cells. The y axis denotes −log10 FDR values while the x axis shows log2 fold change values. Select genes indicated. (D) Advanced bubble plot showing KEGG pathways enriched in Cftr−/− Th2 cells. The y axis denotes enrichment score, and −log10 FDR values are shown on the x axis. The size of the bubble represents the number of genes enriched in each pathway. Select pathways indicated. (EH) Heatmaps showing the differential gene expression profile of core Th2 associated genes including surface markers (E), cytokines (F), transcription factors (G), and CD4+ pan markers (H) in Cftr−/− versus Cftr+/+ Th2 cells. Normalized log2 gene expression determined by RNA-Seq shown to the right of each heatmap with statistically significant DEGs denoted (*) in Cftr+/+ (gray bars) and Cftr−/− (red bars) Th2 cells. RNA-Seq data were generated in biological triplicates from 3 mice and analyzed via DESeq2. KEGG was used for pathway analysis.
Figure 5
Figure 5. CFTR deficiency enhances IL-4 sensitivity and GATA3 expression in Th2 cells.
(A) Schematic diagram showing isolation and polarization conditions of naive CD4+ T cells to Th2 cells for IL-4 studies. (B) Representative flow cytometry histogram showing the median fluorescence intensity (MFI) of IL-4Rα at 72 hours for Cftr+/+ and Cftr−/− Th2 cells. (C) The quantified MFI of IL-4Rα in Cftr+/+ and Cftr−/− Th2 cells at 72 hours (n = 5 mice per genotype). (D) Representative flow cytometry histogram showing the MFI of GATA3 at 72 hours for Cftr+/+ and Cftr−/− Th2 cells. (E) The quantified MFI of GATA3 in Cftr+/+ and Cftr−/− Th2 cells at 72 hours (n = 5 mice per genotype). (F) Representative CD4+ populations showing the MFI of GATA3 at 72 hours in the presence of increasing doses of polarizing IL-4 (0–40 ng/mL) for Cftr+/+ and Cftr−/− Th2 cells. (G and H) GATA3 MFI and secreted IL-13 from cellular supernatant in cultured Cftr+/+ (black) and Cftr−/− (red) Th2 cells in the presence of increasing doses of IL-4 (0–40 ng/mL). (C and E) Data are shown as mean ± SD. Statistical analysis in C and E were performed using unpaired Student’s t test and, in G and H, by 4-parameter logistic regression algorithm (sigmoidal curve fit) to fit. For G and H, data are shown as mean values with the accompanying curve fit (solid line), the 95% CI displayed as a band as well as mean data points for each genotype and concentration. **P < 0.01 and ****P < 0.0001.
Figure 6
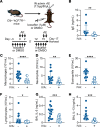
Figure 6. Increased CFTR function with ivacaftor decreases allergic inflammation in a humanized CFTR mouse model.
(A) Schematic diagram showing an adaptive model of intranasal AE-induced inflammation and i.p. ivacaftor (IVA, 1 μM) or DMSO administration schedule in Cftr−/−hCFTR+/+ mice. (B) IgE concentrations by ELISA in serum from sensitized/challenged mice treated with IVA (n = 17) or DMSO (n = 16). (CF) The number of macrophages (C), neutrophils (D), eosinophils (E), and lymphocytes (F), in the BALF of AE-challenged mice treated with either IVA (n = 17) or DMSO (n = 16). (G and H) IL-5 and IL-13 by ELISA in BALF from AE-sensitized and challenged mice treated with either IVA (n = 17) or DMSO control (n = 16). Open circles represent IVA treated mice, and closed circles denote DMSO-treated control mice. Statistical analysis in BH performed using unpaired Student’s t test. *P < 0.05, **P < 0.01, ***P < 0.001, and ****P < 0.0001.
Figure 7
Figure 7. CFTR potentiation decreases Th2 GATA3 expression and IL-13 production.
(A) Schematic diagram detailing the isolation and Th2 polarization of naive human CD4+ T cells used for flow cytometry and cytokine analysis. (B) Viability of ivacaftor (IVA) or DMSO (control) cultured human Th2 cells at 7 days. (C) Representative flow cytometry histogram showing the median fluorescence intensity (MFI) of GATA3 at 7 days for DMSO- and IVA-treated Th2 cells. (D) The quantified MFI of GATA3 in DMSO- and IVA-treated Th2 cells at 72 hours (n = 6 paired human samples). (E) Representative flow cytometry histogram showing the median fluorescence intensity (MFI) of IL-13 at 7 days for DMSO- and IVA-treated Th2 cells. (F) The quantified MFI of IL-13 in DMSO- and IVA-treated Th2 cells at 72 hours (n = 6 paired human samples). (G) IL-13 by ELISA in cellular supernatant from cultured DMSO- and IVA-treated Th2 cells. Statistical analysis in B, D, F, and G was performed using paired Student’s t test. *P < 0.05.

References

    1. Bojanowski CM, et al. Mucosal immunity in cystic fibrosis. J Immunol. 2021;207(12):2901–2912. doi: 10.4049/jimmunol.2100424. - DOI - PMC - PubMed
    1. Skov M, et al. Increased antigen-specific Th-2 response in allergic bronchopulmonary aspergillosis (ABPA) in patients with cystic fibrosis. Pediatr Pulmonol. 1999;27(2):74–79. doi: 10.1002/(SICI)1099-0496(199902)27:2<74::AID-PPUL2>3.0.CO;2-L. - DOI - PubMed
    1. Cook DP, et al. Type 2 inflammation in cystic fibrosis is a predictor of mortality and targeted with CFTR modulator therapy. Allergy. 2024;79(12):3528–3533. doi: 10.1111/all.16198. - DOI - PMC - PubMed
    1. Albon D, et al. Association between cystic fibrosis exacerbations, lung function, T2 inflammation and microbiological colonization. Allergy Asthma Clin Immunol. 2023;19(1):15. doi: 10.1186/s13223-023-00760-z. - DOI - PMC - PubMed
    1. Shanthikumar S, et al. Inflammation in preschool cystic fibrosis is of mixed phenotype, extends beyond the lung and is differentially modified by CFTR modulators [preprint]. https://10.1136/thorax-2024-221634 Posted on Thorax February 10, 2025. - DOI - PubMed

MeSH terms

Supplementary concepts