. 2025 Mar 25;10(9):e183706.
doi: 10.1172/jci.insight.183706. eCollection 2025 May 8.

Vitamin A retinoic acid contributes to muscle stem cell and mitochondrial function loss in old age

Affiliations

Vitamin A retinoic acid contributes to muscle stem cell and mitochondrial function loss in old age

Paula M Fraczek et al. JCI Insight. .

Abstract

Adult stem cells decline in number and function in old age, and identifying factors that can delay or revert age-associated adult stem cell dysfunction are vital for maintaining a healthy lifespan. Here we show that vitamin A, a micronutrient that is derived from diet and metabolized into retinoic acid, acts as an antioxidant and transcriptional regulator in muscle stem cells. We first show that obstruction of dietary vitamin A in young animals drives mitochondrial and cell cycle dysfunction in muscle stem cells that mimics old age. Next, we pharmacologically targeted retinoic acid signaling in myoblasts and aged muscle stem cells ex vivo and in vivo and observed reductions in oxidative damage, enhanced mitochondrial function, and improved maintenance of quiescence through fatty acid oxidation. We next detected that the receptor for vitamin A-derived retinol, stimulated by retinoic acid 6 or Stra6, was diminished with muscle stem cell activation and in old age. To understand the relevance of Stra6 loss, we knocked down Stra6 and observed an accumulation of mitochondrial reactive oxygen species, as well as changes in mitochondrial morphology and respiration. These results demonstrate that vitamin A regulates mitochondria and metabolism in muscle stem cells and highlight a unique mechanism connecting stem cell function with vitamin intake.

Keywords: Adult stem cells; Aging; Muscle; Muscle biology; Stem cells.


Conflict of interest statement

Conflict of interest: The authors have declared that no conflict of interest exists.

Figures

Figure 1
Figure 1. Dietary depletion of vitamin A induces premature activation and oxidative damage in muscle stem cells.
(A) Experiment schematic whereby young mice were fed either a vitamin A–deficient or control diet for a total of 8 weeks, after which muscle stem cells were isolated and profiled. (B) Representative images of Pax7-nGFP and MyoD fluorescence of freshly isolated and fixed MuSCs from CTRL diet (top row) and VA-deficient diet (bottom row). DAPI, blue; Pax7, green; MyoD, red. Scale bar: 20 μm. (C and D) Quantification of mean fluorescence intensity of Pax7-nGFP and MyoD, respectively. Comparisons made via t test with n = 3–4 wells per diet. (E and F) Quantification of Ki67 and MitoTracker Deep Red, respectively, in MuSCs fixed immediately after isolation from mice receiving CTRL diet (red) or VA-free diet (blue). Comparisons made via t test with n = 3–4 wells per diet. (G) Proportion of colony-forming single MuSCs isolated from mice receiving CTRL diet (red) or VA-free diet (blue) after 5 days in growth conditions. Comparisons made via t test with n = 4 mice (60 wells per mouse) for the control diet, and n = 3 mice (95 wells per mouse) for VA-free diet. (H) Representative images of 8-OHdG fluorescence of freshly isolated and fixed MuSCs from CTRL diet (top row) and VA-free diet (bottom row). DAPI, blue; 8-OHdG, red. Scale bar: 20 μm. (I) Quantification of mean fluorescence intensity of 8-OHdG in MuSCs fixed immediately after isolation from mice receiving CTRL diet (red) or VA-free diet (blue). n = 6 image fields (across 2 mice) per diet. Data are shown as mean ± SEM (*P < 0.05, **P < 0.01, ***P < 0.001, ****P < 0.0001 for all comparisons).
Figure 2
Figure 2. Vitamin A depletion disrupts muscle stem cell metabolism, mitochondria, and cell cycle regulation.
(A) Experiment schematic: young mice were fed either a vitamin A–deficient or control diet for a total of 8 weeks, after which muscle stem cells were isolated via FACS and RNA was extracted for RNA-Seq, followed by differential gene expression, GO term enrichment, and metabolic flux model analyses. (B) Heatmap of z scores for all differentially expressed genes with Padj < 0.05 from muscle stem cells isolated from control and vitamin A–free diet-fed young mice. (C) Bar plots of selected differentially expressed genes related to vitamin A metabolism and RA signaling. Data are shown as mean ± SEM. (D) Bubble plots of selected overrepresented GO terms across differentially expressed genes. (E) Bubble plot of selected underrepresented GO terms across differentially expressed genes. (F) Escher map of statistically significant metabolic fluxes predicted by metabolic flux model. Red, enriched fluxes in vitamin A–free diet; blue, enriched fluxes in control diet.
Figure 3
Figure 3. Small molecule agonists targeting retinoic acid signaling improves mitochondrial function and reduces reactive oxygen species.
(A) Schematic depicting strategy to upregulate RA signaling by using Rarγ and Rxrα agonists (CD3254, BMS961) and ATRA as a ligand (each 100 nM). (B) Line graphs of oxygen consumption rate (OCR) measured via Seahorse XFe96 Mito Stress Test in C2C12s treated with ATRA and agonists (red, n = 12 wells) and DMSO vehicle control (blue, n = 12 wells) after injections of oligomycin, FCCP, and rotenone/antimycin A. (C and D) Quantification of proton leak and OCR/ECAR ratio, respectively, in C2C12s treated with ATRA and agonists (red) and DMSO vehicle control (blue). Comparisons of Seahorse Mito Stress parameters were made via t test. (E) A 3D projection and 3D reconstruction of single MuSCs from Pax7CreERT2-Rosa26CAG–LSL–EGFP–3xHA–OMM mice showing individual mitochondria after cellular treatment with DMSO control (top) or ATRA and agonists (bottom). Scale bar: 2 μm. (F) Quantification of 3-dimensional Feret diameter between MuSCs treated with DMSO control and ATRA and agonists groups. Comparison made via Mann-Whitney U test for nonparametric distributed data with n = 4 wells per treatment. Data represented as median with interquartile range. (G) Quantification of cellular density of EdU+ MuSCs between MuSCs treated with DMSO vehicle control (blue) or agonists and ATRA (red). Comparison made via t test with n = 6 wells per treatment.
Figure 4
Figure 4. Repletion of retinoic acid signaling reduces oxidative stress and promotes metabolism supportive of quiescence in muscle stem cells.
(A) Representative images of mitochondrial ROS labeled with MitoTracker Orange CM-H2TMRos (yellow) and total mitochondria labeled with MitoTracker Deep Red (magenta) in aged MuSCs treated with DMSO vehicle control (top) or 100 nM agonists and ATRA (bottom). DAPI counterstain is shown in blue. Scale bar: 50 μm. (BD) Quantification of MitoTracker Orange CM-H2TMRos, MitoTracker Deep Red, and 8-OHdG mean fluorescence intensity between aged MuSCs treated with DMSO vehicle control or agonists and ATRA. Data are shown as mean ± SEM. (E) Schematic depicting strategy to upregulate RA signaling in aged mice through intramuscular injections of CD3254, BMS961, and ATRA, followed by scRNA-Seq of muscle cell suspensions and genome-scale metabolic flux balance analysis of single-cell transcriptomes. (F) Annotated UMAP of cell clusters obtained in the merged scRNA-Seq dataset of treated and untreated aged cells. (G) Subclustering of the MuSC subset in the treated (right) and untreated (left) samples. (H) Violin plots of selected differentially expressed genes found via DESeq2 (P < 0.1 and |log2FC| > 0.15). Top row: Pax7, Id1, Sirt2. Bottom row: Rock2, Mt1, Mt2. (I) Volcano plot of differentially expressed metabolic fluxes in the fatty acid oxidation and NAD metabolism subsystems determined by Compass analysis. Data are shown as mean ± SEM. Statistical comparisons were made via paired t test (*P < 0.05, **P < 0.01).
Figure 5
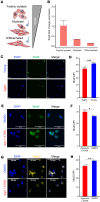
Figure 5. The vitamin A receptor Stra6 is attenuated with stem cell activation and aging.
(A) Schematic depicting how Stra6 expression decreases with muscle stem cell activation and differentiation. (B) Quantification of Stra6 expression fold change (relative to Gapdh) in freshly isolated MuSCs, activated myoblasts (72 hours in culture with growth medium), and differentiated myotubes (an additional 72 hours in culture with differentiation medium). qPCR was run using 2 biological replicates and 2 technical replicates per time point. (C) Representative immunofluorescence images of Stra6 from muscle stem cells isolated from freshly isolated young (3–4 months) and aged mice (22 months). Tissues from 2 biological replicates (C57BL/6 females) were used per age group and pooled during MACS isolation before seeding into a 96-well plate, fixing, and labeling for Stra6. (D) Quantification of Stra6 mean fluorescence intensity comparing age groups using a t test. n = 8 wells were imaged per age group. (E) Representative images of Stra6 immunofluorescence staining in old-aged MuSCs (pooled from n = two 24-month-old female C57BL/6 mice) treated with DMSO vehicle control (top) or agonists and ATRA (bottom) for 3 days. Stra6, green; DAPI, blue. Scale bar: 50 μm. (F) Quantification of Stra6 mean fluorescence intensity between old-aged MuSCs treated with DMSO vehicle control (blue) or agonists and ATRA (red). Comparison made via t test with n = 4 wells per treatment. (G) Representative images of MyoD immunofluorescence staining in old-aged MuSCs treated with DMSO vehicle control (top) or agonists and ATRA (bottom). MyoD, yellow; DAPI, blue. Scale bar: 50 μm. (H) Quantification of MyoD mean fluorescence intensity between aged MuSCs treated with DMSO vehicle control or agonists and ATRA. Comparison made via t test with n = 4 wells per treatment.
Figure 6
Figure 6. Stra6 loss induces mitochondrial dysfunction.
(A) Representative image of mitochondrial membrane depolarization via JC-1 labeling (represented as ratio of red/green fluorescence) and representative images of red JC-1 aggregates indicating healthy, polarized mitochondria and Hoechst-counterstained nuclei (scale bars = 100 µm; Stra6-knockdown cells on the right and negative control siRNA cells on the left). (B) Quantification of JC-1 Red/Green ratio for knockdown and control, n = 3 wells per condition. Comparisons made via t test. Data are represented as averages across samples showing mean ± SEM. (C) Quantification of mitochondrial ROS using MitoTracker Orange CM-H2TMRos normalized to total mitochondrial stained by MitoTracker Deep Red (n = 3 wells per condition). (D) Quantification of Ki67 mean fluorescence intensity (n = 6 image fields across 2 wells per condition) after siRNA knockdown of Stra6 (blue) or negative control (red). (E) Line graphs of oxygen consumption rate (OCR) measured via Seahorse XFe96 Mito Stress Test in Stra6-knockdown cells (blue line, n = 11 wells) and negative control cells (red line, n = 12 wells) after injections of oligomycin, FCCP, and rotenone/antimycin A. (FI) Quantification of OCR during basal cell respiration (F), change in OCR related to ATP production (G), proton leak (H), and OCR/ECAR ratio (I) in Stra6-knockdown cells and negative control cells. Comparisons of Seahorse Mito Stress parameters were made via t test. *P < 0.05, **P < 0.01, ***P < 0.001.

References

    1. Sousa-Victor P, et al. Control of satellite cell function in muscle regeneration and its disruption in ageing. Nat Rev Mol Cell Biol. 2022;23(3):204–226. doi: 10.1038/s41580-021-00421-2. - DOI - PubMed
    1. Abou-Khalil R, et al. Role of muscle stem cells during skeletal regeneration. Stem Cells. 2015;33(5):1501–1511. doi: 10.1002/stem.1945. - DOI - PubMed
    1. Ryall JG, et al. The NAD(+)-dependent SIRT1 deacetylase translates a metabolic switch into regulatory epigenetics in skeletal muscle stem cells. Cell Stem Cell. 2015;16(2):171–183. doi: 10.1016/j.stem.2014.12.004. - DOI - PMC - PubMed
    1. Hong X, et al. Mitochondrial dynamics maintain muscle stem cell regenerative competence throughout adult life by regulating metabolism and mitophagy. Cell Stem Cell. 2022;29(9):1298–1314. doi: 10.1016/j.stem.2022.07.009. - DOI - PubMed
    1. Sun N, et al. The mitochondrial basis of aging. Mol Cell. 2016;61(5):654–666. doi: 10.1016/j.molcel.2016.01.028. - DOI - PMC - PubMed