. 2025 Mar 25;25(1):96.
doi: 10.1007/s10238-025-01603-4.

Phenotypic and functional dysregulations of CD8 + T Cells in myasthenia gravis

Affiliations

Phenotypic and functional dysregulations of CD8 + T Cells in myasthenia gravis

Chang Liu et al. Clin Exp Med. .

Abstract

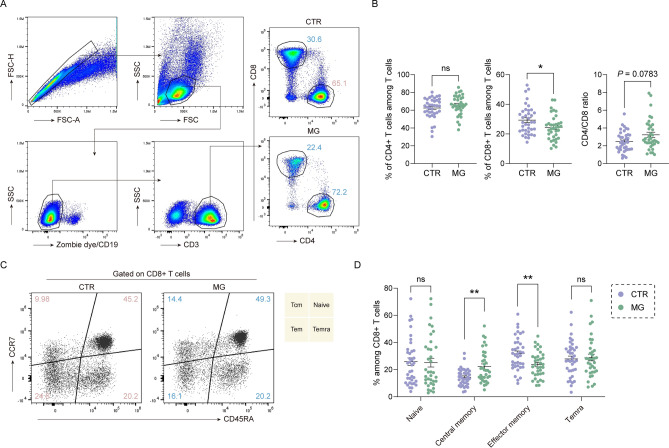
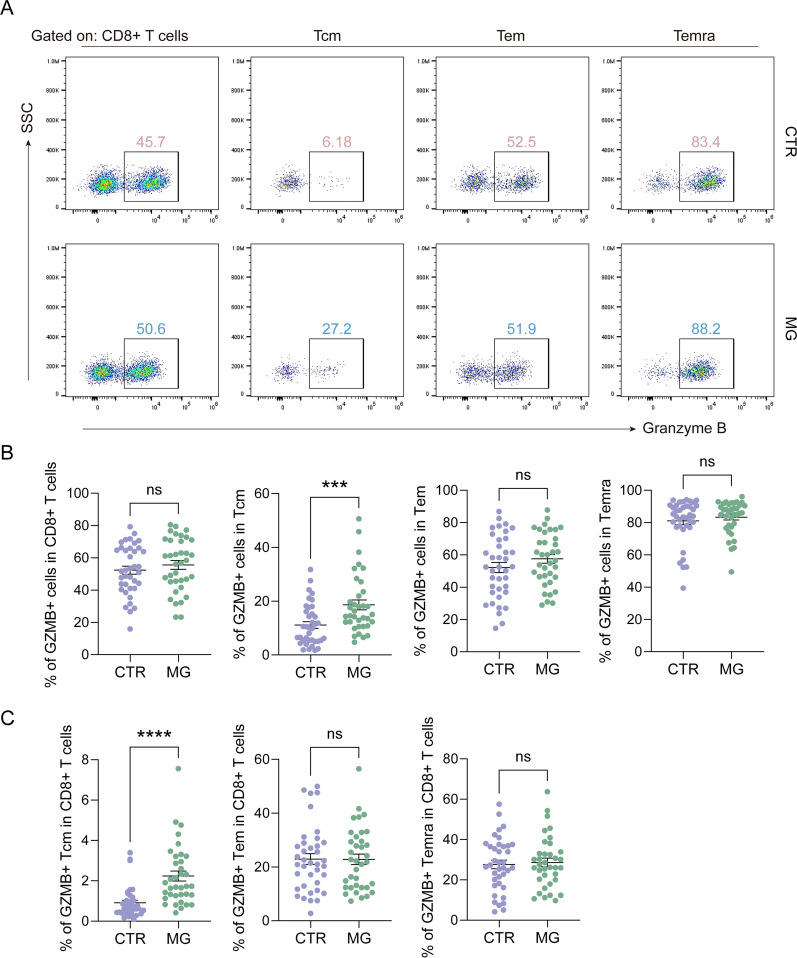
Myasthenia Gravis (MG) is a heterogeneous autoimmune disorder characterized by fluctuating muscle weakness caused by autoantibodies targeting neuromuscular junction components. While the role of CD4 + T cells in MG is well established, the contribution of CD8 + T cells remains poorly understood. In this study, we analyze CD8 + T cells in 36 MG patients and 38 age- and gender-matched controls using flow cytometry to evaluate subset distribution, granzyme expression, and cytokine production. MG patients exhibit an altered CD4 + /CD8 + T cell ratio and significant changes in CD8 + T cell subsets, including increased central memory CD8 + T cell (Tcm) proportions and decreased effector memory CD8 + T cell (Tem) proportions. Granzyme B expression in Tcm cells is significantly elevated in MG patients, whereas no significant changes are observed in other subsets or GZMK expression. Cytokine analysis reveals increased IL-21, GM-CSF, and IL-17A production by CD8 + T cells in MG patients. These phenotypic and functional alterations of CD8 + T cells persist during the acute phase of the disease, regardless of immunotherapy usage, and vary between ocular and generalized MG. Subgroup and correlation analyses further identify age-dependent and age-independent dysregulations of CD8 + T cells, indicating complex and subtype-specific roles of CD8 + T cells in the immunopathological processes underlying MG. Our findings provide novel insights into the involvement of CD8 + T cells in MG pathogenesis, laying a foundation for future research and potential therapeutic strategies targeting CD8 + T cells.

Keywords: CD8 + T cells; GM-CSF; Granzyme B; IL-21; Myasthenia gravis; Pathogenesis.


Conflict of interest statement

Declarations. Ethics approval and consent to participate: All experiments were performed in accordance with the Declaration of Helsinki. The research received approval from the Research Ethics Committee of The First Affiliated Hospital of Shandong First Medical University and all participants provided written informed consent. Conflicts of interest: The authors declare no competing interests.

Figures

Fig. 1
Fig. 1
Altered frequencies and subset distribution of CD8 + T cells in MG patients. (A) Representative flow cytometry plots showing the gating strategy for identifying CD4 + and CD8 + T cells among total T cells in MG and control group. (B) Quantification of CD4 + and CD8 + T cell frequencies among total T cells and the CD4/CD8 ratio in MG patients (n = 36) and controls (n = 38). (C) Representative flow cytometry plots demonstrating the classification of CD8 + T cell subsets based on CCR7 and CD45RA expression in MG and control group. (D) Quantification of naïve, central memory (Tcm), effector memory (Tem), and terminally differentiated effector memory (Temra) CD8 + T cell subsets in MG patients and controls. Data are presented as means ± SEM. Statistical significance was determined using Student’s t-test for normally distributed data and Mann–Whitney test for not normally distributed data (ns, not significant; *P < 0.05, **P < 0.01)
Fig. 2
Fig. 2
Expression of GZMB in CD8 + T cells from MG patients and controls. (A) Representative flow cytometry plots showing GZMB expression in CD8 + T cells and their subsets from controls and MG patients. (B) Quantification of GZMB expression in total CD8 + T cells and across Tcm, Tem, and Temra subsets from MG patients (n = 36) and controls (n = 38). (C) Proportions of GZMB + Tcm, Tem, and Temra cells within total CD8 + T cells in MG patients and controls. Data are presented as means ± SEM. Statistical significance was determined using Student’s t-test for normally distributed data and Mann–Whitney test for not normally distributed data (ns, not significant; ***P < 0.001, ****P < 0.0001)
Fig. 3
Fig. 3
Increased production of IL-21, GM-CSF, and IL-17A by CD8 + T cells from MG patients. (A) Representative flow cytometry plots showing the expression of IFN-γ and IL-21 in CD8 + T cells from controls and MG patients. (B) Quantification of IFN-γ, IL-21, and dual IFN-γ/IL-21-producing CD8 + T cells in MG patients (n = 36) and controls (n = 38). (C) Representative flow cytometry plots showing the expression of GM-CSF and IL-17A in CD8 + T cells from controls and MG patients. (D) Quantification of GM-CSF, IL-17A, and dual GM-CSF/IL-17A-producing CD8 + T cells in MG patients and controls. Data are presented as means ± SEM. Statistical significance was determined using Student’s t-test for normally distributed data and Mann–Whitney test for not normally distributed data (ns, not significant; *P < 0.05, **P < 0.01, ****P < 0.0001)
Fig. 4
Fig. 4
Subgroup analysis of CD8 + T cells based on immunotherapy status in MG patients. (A) Quantification of the proportion of CD8 + T cells, the CD4/CD8 ratio, and the distribution of CD8 + T cell subsets (naïve T, Tcm, Tem, and Temra) in immunotherapy-naïve (n = 19) and immunotherapy-treated (n = 17) MG patients. (B) Comparison of GZMB expression within CD8 + T cell subsets between immunotherapy-naïve and immunotherapy-treated MG patients. (C) Comparison of GZMK expression within CD8 + T cell subsets between the two patient groups. (D) Quantification of IFN-γ and IL-21 production by CD8 + T cells in immunotherapy-naïve and immunotherapy-treated MG patients. (E) Quantification of GM-CSF and IL-17A production by CD8 + T cells in the two patient groups. Data are presented as means ± SEM. Statistical significance was determined using Student’s t-test for normally distributed data and Mann–Whitney test for not normally distributed data (ns, not significant)
Fig. 5
Fig. 5
Comparison of CD8 + T cells between OMG and GMG patients. (A) Quantification of the proportion of CD8 + T cells, the CD4/CD8 ratio, and the distribution of CD8 + T cell subsets (naïve T, Tcm, Tem, and Temra) in OMG (n = 13) and GMG (n = 23) patients. (B) Comparison of GZMB expression within CD8 + T cell subsets between OMG and GMG patients. (C) Comparison of GZMK expression within CD8 + T cell subsets in the two patient groups. (D) Quantification of IFN-γ and IL-21 production by CD8 + T cells in OMG and GMG patients. (E) Quantification of GM-CSF and IL-17A production by CD8 + T cells in OMG and GMG patients. Data are presented as means ± SEM. Statistical significance was determined using Student’s t-test for normally distributed data and Mann–Whitney test for not normally distributed data (ns, not significant; *P < 0.05, **P < 0.01)
Fig. 6
Fig. 6
Different phenotypic and functional characteristics of CD8 + T Cells in EOMG and LOMG. (A) Quantification of CD8 + T cell subsets (naïve T, Tcm, Tem, and Temra) in EOMG (n = 9) and LOMG (n = 27) patients compared to their respective age-matched controls (n = 9 for controls under 50 years and n = 29 for controls over 50 years). (B) Comparison of GZMB expression in Tcm, Tem, and Temra subsets between MG patients and age-matched controls. (C) Comparison of GZMK expression across CD8 + T cell subsets from MG patients and age-matched controls. (D) Quantification of IFN-γ and IL-21 production by CD8 + T cells from MG patients and age-matched controls. (E) Quantification of GM-CSF and IL-17A production by CD8 + T cells from MG patients and age-matched controls. (F) Correlation analysis between age and the proportion of naïve T cells as well as Tcm cells in MG patients and controls. (G) Correlation analysis between age and cytokine production (IFN-γ and IL-21) by CD8 + T cells in MG patients and controls. Data are presented as means ± SEM. Statistical significance in multiple comparsions (A-E) was determined by Šidák test for equal variances and Dunnett’s T3 test for unequal variances, or by Dunn’s test for not normally distributed data. (ns, not significant; *P < 0.05, **P < 0.01, ***P < 0.001). Correlation analysis (F-G) was performed using Spearman’s rank correlation coefficient

References

    1. Gilhus NE. Myasthenia Gravis. N Engl J Med. 2016;375(26):2570–81. - PubMed
    1. Gilhus NE, Tzartos S, Evoli A, Palace J, Burns TM, Verschuuren J. Myasthenia gravis. Nat Rev Dis Primers. 2019;5(1):30. - PubMed
    1. Yu D, Walker LSK, Liu Z, Linterman MA, Li Z. Targeting T(FH) cells in human diseases and vaccination: rationale and practice. Nat Immunol. 2022;23(8):1157–68. - PubMed
    1. Ashida S, Ochi H, Hamatani M, Fujii C, Kimura K, Okada Y, Hashi Y, Kawamura K, Ueno H, Takahashi R, et al. Immune Skew of Circulating follicular helper T cells associates with myasthenia gravis severity. Neurol Neuroimmunol Neuroinflamm. 2021;8(2):214. - PMC - PubMed
    1. Zhang CJ, Gong Y, Zhu W, Qi Y, Yang CS, Fu Y, Chang G, Li Y, Shi S, Wood K, et al. Augmentation of circulating follicular helper T cells and their impact on autoreactive B cells in myasthenia gravis. J Immunol. 2016;197(7):2610–7. - PubMed