

Systemic inflammatory response markers improve the discrimination for prognostic model in hepatocellular carcinoma
- PMID: 40131621
- PMCID: PMC12287231
- DOI: 10.1007/s12072-025-10806-6
Systemic inflammatory response markers improve the discrimination for prognostic model in hepatocellular carcinoma
Abstract
Background/purpose of the study: We aimed to evaluate the performance of neutrophil-to-lymphocyte ratio (NLR), platelet-to-lymphocyte ratio (PLR), and their combination (combined NLR-PLR, CNP) in predicting overall survival (OS) and recurrence-free survival (RFS) in a large cohort of unselected hepatocellular carcinoma (HCC) patients.
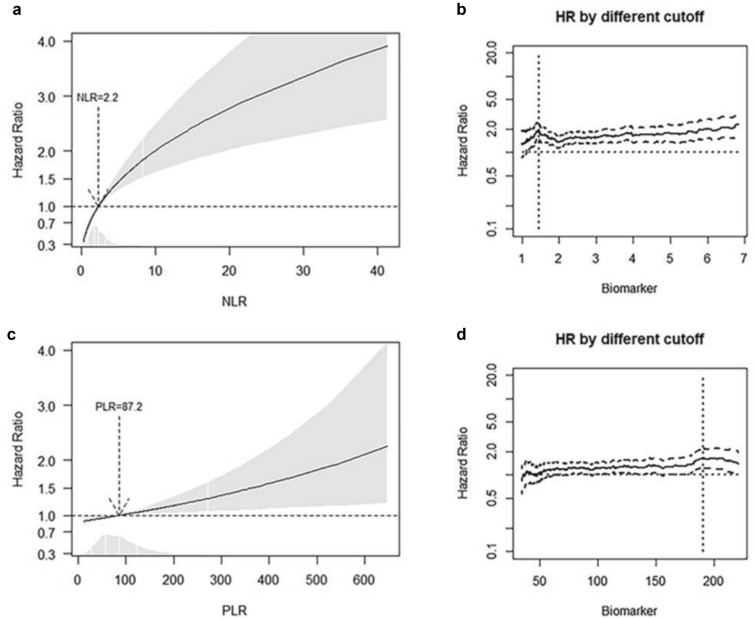
Methods: Training and validation cohort data were retrieved from the Italian Liver Cancer (ITA.LI.CA) database. The optimal cut-offs of NLR and PLR were calculated according to the multivariable fractional polynomial and the minimum p value method. The continuous effect and best cut-off categories of NLR and PLR were analyzed using multivariable Cox regression analysis. A shrinkage procedure adjusted over-fitting hazard ratio (HR) estimates of best cut-off categories. C-statistic and integrated discrimination improvement (IDI) were calculated to evaluate the discrimination properties of the biomarkers when added to clinical survival models.
Results: 2,286 patients were split into training (n = 1,043) and validation (n = 1,243) cohorts. The optimal cut-offs for NLR and PLR were 1.45 and 188, respectively. NLR (HR 1.58, 95% CI 1.11-2.28, p = 0.014) and PLR (HR 1.79, 95% CI 1.11-2.90, p = 0.018) were independent predictors of OS. When incorporated into a clinical prognostic model that includes age, alpha-fetoprotein (AFP), the CHILD-Pugh score, and the Barcelona Clinic Liver Cancer (BCLC) staging system, CNP had a significant incremental value in predicting OS (IDI 1.3%, p = 0.04). Data were confirmed in the validation cohort. Neither NLR nor PLR significantly predicted RFS in the training cohort.
Conclusions: NLR, PLR, and CNP independently predicted shorter OS in HCC patients. The addition of CNP to the survival prediction model significantly improved the model's accuracy in predicting OS.
Keywords: Free survival; Hepatocellular carcinoma; Lymphocyte ratio; Neutrophil; Platelet; Prognosis; Recurrence; Survival; To.
© 2025. The Author(s).
Conflict of interest statement
Declarations. Conflict of interest: The authors have no relevant conflicts of interest. Human and animal rights: The ITA.LI.CA database management conforms to the past and current Italian legislation regarding privacy, and the present study conforms to the ethical guidelines of the Declaration of Helsinki. The study was approved by the Institutional Review Board of the ITA.LI.CA coordinating centre, Alma Mater Studiorum University of Bologna, on 15th May 2012 (approval number 99/2012/O/Oss). Informed consent: Written informed consent was obtained from all participants.
Figures


Comment in
-
Systemic inflammation and prognosis in HCC: a closer look.Hepatol Int. 2025 Dec;19(6):1495-1496. doi: 10.1007/s12072-025-10876-6. Epub 2025 Jul 24. Hepatol Int. 2025. PMID: 40705227 No abstract available.
-
Enhancing the prognostic value of inflammatory markers in hepatocellular carcinoma: a thoughtful discussion.Hepatol Int. 2025 Sep 16. doi: 10.1007/s12072-025-10910-7. Online ahead of print. Hepatol Int. 2025. PMID: 40954427 No abstract available.
References
-
- Sung H, Ferlay J, Siegel RL, Laversanne M, Soerjomataram I, Jemal A, et al. Global cancer statistics 2020: GLOBOCAN estimates of incidence and mortality worldwide for 36 cancers in 185 countries. CA Cancer J Clin. 2021;71:209–249 - PubMed
-
- Galle PR, Forner A, Llovet JM, Mazzaferro V, Piscaglia F, Raoul JL, et al. EASL clinical practice guidelines: management of hepatocellular carcinoma. J Hepatol. 2018;69:182–236 - PubMed
-
- Vitale A, Farinati F, Finotti M, Di Renzo C, Brancaccio G, Piscaglia F, et al. (2021) Overview of Prognostic Systems for Hepatocellular Carcinoma and ITA.LI.CA External Validation of MESH and CNLC Classifications. Cancers (Basel). 13:1673. Available from: https://www.mdpi.com/2072-6694/13/7/1673 - PMC - PubMed
-
- Galle PR, Foerster F, Kudo M, Chan SL, Llovet JM, Qin S, et al. (2019) Biology and significance of alpha‐fetoprotein in hepatocellular carcinoma. Liver Int. 39:2214–29. Available from: https://onlinelibrary.wiley.com/doi/10.1111/liv.14223 - PubMed
-
- Hanahan D, Weinberg RA (2011) Hallmarks of cancer: the next generation. Cell. 144:646–74. Available from: http://www.ncbi.nlm.nih.gov/pubmed/21376230 - PubMed
MeSH terms
Substances
LinkOut - more resources
Full Text Sources
Medical
Research Materials
