. 2025 Apr 2;37(4):koaf063.
doi: 10.1093/plcell/koaf063.

A deficient CP24 allele defines variation for dynamic nonphotochemical quenching and photosystem II efficiency in maize

Affiliations

A deficient CP24 allele defines variation for dynamic nonphotochemical quenching and photosystem II efficiency in maize

John N Ferguson et al. Plant Cell. .

Erratum in

Abstract

Maize (Zea mays L.) is a global crop species in which CO2 assimilation occurs via the C4 pathway. C4 photosynthesis is typically more efficient than C3 photosynthesis under warm and dry conditions; however, despite this inherent advantage, considerable variation remains in photosynthetic efficiency for C4 species that could be leveraged to benefit crop performance. Here, we investigate the genetic architecture of nonphotochemical quenching (NPQ) and photosystem II (PSII) efficiency using a combination of high-throughput phenotyping and quantitative trait loci (QTL) mapping in a field-grown Multi-parent Advanced Generation Inter-Cross (MAGIC) mapping population. QTL mapping was followed by the identification of putative candidate genes using a combination of genomics, transcriptomics, protein biochemistry, and targeted physiological phenotyping. We identified four genes with a putative causal role in the observed QTL effects. The highest confidence causal gene was found for a large effect QTL for photosynthetic efficiency on chromosome 10, which was underpinned by allelic variation in the expression of the minor PSII antenna protein light harvesting complex photosystem II subunit (LHCB6 or CP24), mainly driven by poor expression associated with the haplotype of the F7 founder line. The historical role of this line in breeding for early flowering time may suggest that the presence of this deficient allele could be enriched in temperate maize germplasm. These findings advance our understanding of the genetic basis of NPQ and PSII efficiency in C4 plants and highlight the potential for breeding strategies aimed at optimizing photosynthetic efficiency in maize.


Conflict of interest statement

Conflict of interest statement. None declared.

Figures
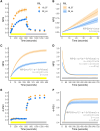
Figure 1.
Figure 1.
Example of models used to fit the dynamic NPQ and operating PSII efficiency (ΦPSII) data based on 2 distinct RILs (SSA_00157 and SSA_00376). Data shown are from N = 6 biological replicates of each RIL. A) NPQ throughout the measurement protocol. Circles represent the mean value, and the bars represent the standard error of the mean. B) Initial NPQ induction modeled via a linear regression. The solid line represents the mean of the predicted NPQ according to the linear regression fit and the ribbon represents the standard error of the predicted fit. C) NPQ induction modeled via an exponential equation. D) NPQ relaxation modeled via an exponential model. E) ΦPSII through the measurement protocol. F) ΦPSII recovery modeled via an exponential model.
Figure 2.
Figure 2.
Comparison of selected parameters across the 2 experimental years. A to E) Boxplots demonstrating population wide variation across both experimental years for maximum efficiency of photosystem II (Fv/Fm), NPQ induction rate, maximum NPQ, NPQ relaxation rate, and operating PSII efficiency(ΦPSII) recovery rate. The boxes of the boxplots denote the median and interquartile range. The whiskers show the minimum and maximum range, with RILs falling away from that range being shown as individual circles (2021: N = 316; 2022: N = 312). F to H) Scatter plots demonstrating associations between the same traits across each experimental year. Correlations were statistically tested via linear models, with the associated regression line and standard error being denoted as the fit and associated shaded area respectively (N = 301). Significant differences and correlations are denoted at the following P-value levels: * 0.05, ** 0.01, *** 0.001, **** 0.0001, where ns, nonsignificant (i.e. P > 0.05).
Figure 3.
Figure 3.
QTL mapping of NPQ at different timepoints within the induction (light) and relaxation (dark) phases. Mapping is performed using the predicted means derived from the joint-year linear mixed effect models. A) QTL for NPQ 20 s after the actinic light is switched on. B) QTL for NPQ 60 s after the actinic light is switched on. C) QTL for NPQ 420 s after the actinic light is switched on. D) QTL for NPQ 20 s after the actinic light is switched off. E) QTL for NPQ 60 s after the actinic light is switched off. F) QTL for NPQ 120 s after the actinic light is switched off. G) Broad-sense heritability (HB2) for NPQ over time.
Figure 4.
Figure 4.
Key QTL identified for NPQ and Fv/Fm. A, C, E, G) Main effect QTL for selected traits; B, D, F, H) Founder effects associated with each QTL. NPQ, non-photochemical quenching; Fv/Fm, maximum efficiency of photosystem II.
Figure 5.
Figure 5.
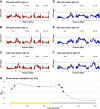
Identification of a putative chloroplastic protein kinase as a candidate gene regulating NPQ induction rate A) LOD score plot of NPQ induction rate on Chromosome 9 QTL, the horizontal dotted line represents the threshold of significance. B) top panel: SNP association mapping within a 4 Mbp region, centered on NPQ induction rate QTL on chromosome 9. Bottom panel: Zoomed in view of the same region (± 0.25 Mbp, centered on QTL), showing a putatively associated SNP falling within the coding region of Zm0001d048314. In this panel all 36 gene models annotated in this zoomed-in region are shown. In both panels, SNPs having LOD scores > 99th percentile are highlighted in red.
Figure 6.
Figure 6.
Differences in CP24-related phenotypes between B73 and F7 founder lines. A) Expression of CP24 (t-test, P = 1.3e−6, N = 12). B) Maximum efficiency of photosystem II (Fv/Fm) (t-test, P = 1.6e−10, N = 8) C) fluorescence rise time. (t-test, P = 3.6e−8, N = 8) D) Western blot of B73 and F7 thylakoid membrane protein samples using a CP24-specific antibody. E) Blue native gel electrophoresis (BN-PAGE) of thylakoid membrane complexes of B73 and F7. Red bracket indicates size of supercomplexes perturbed by absence of CP24 in F7 (F) Coding region analysis of the CP24 gene (Zm00001d026599) ± 1000 bp. The barplot illustrates regions of accessible chromatin identified through ATAC-seq data generated from the fourth leaf by Ricci et al. (2019). Gray dots are positioned along the x-axis according to the physical position of predicted transcription factor binding site (TFBS) motifs relative to the B73 reference genome (V4; y-axis P-values represent the likelihood of a TFBS motif matching the sequence by random chance). Vertical blue dotted lines mark the positions of 4 unique variants within the F7 haplotype. The horizontal schematic shows the CP24 gene structure: light blue segments represent the 5′ and 3′ untranslated regions (UTRs), yellow segments denote exons, and the black line indicates the intron.

Similar articles

Cited by

References

    1. Andrews S. FastQC: a quality control tool for high throughput sequence data. v0.12.1 [2010]. https://www.bioinformatics.babraham.ac.uk/projects/fastqc/.
    1. Aranda Sicilia MN, Aboukila A, Armbruster U, Cagnac O, Schumann T, Kunz HH, Jahns P, Rodríguez-Rosales MP, Sze H, Venema K. Envelope K+/H+ antiporters AtKEA1 and AtKEA2 function in plastid development. Plant Physiol. 2016:172(1):441–449. 10.1104/pp.16.00995 - DOI - PMC - PubMed
    1. Aranda Sicilia MN, Romero MES, Rodríguez-Rosales MP, Venema K. Plastidial transporters KEA1 and KEA2 at the inner envelope membrane adjust stromal pH in the dark. New Phytol. 2021:229(4):2080–2090. 10.1111/nph.17042 - DOI - PubMed
    1. Armbruster U, Ruby Carrillo L, Venema K, Pavlovic L, Schmidtmann E, Kornfeld A, Jahns P, Berry JA, Kramer DM, Jonikas MC. Ion antiport accelerates photosynthetic acclimation in fluctuating light environments. Nat Commun. 2014:5(1):5439. 10.1038/ncomms6439 - DOI - PMC - PubMed
    1. Aro EM, Virgin I, Andersson B. Photoinhibition of Photosystem II. Inactivation, protein damage and turnover. Biochim Biophys Acta. 1993:1143(2):113–134. 10.1016/0005-2728(93)90134-2 - DOI - PubMed

Substances

LinkOut - more resources