. 2025 Apr 1;133(4):1329-1340.
doi: 10.1152/jn.00052.2025. Epub 2025 Mar 25.

Distinct firing responses to synthetic synaptic currents in the adult murine reticular and relay thalamus

Affiliations

Distinct firing responses to synthetic synaptic currents in the adult murine reticular and relay thalamus

Isaac Y M Chang et al. J Neurophysiol. .

Abstract

Numerous cortical and subcortical inputs innervate the thalamus and robustly control thalamic activity. These synaptic inputs differ in shape and undergo dynamic changes throughout development and disease conditions. How the shape of postsynaptic currents regulates thalamic neuronal firing has been studied mainly in young rodents with immature neural development and function. Here, we use adult mice with mature intrinsic excitability to address this question in two compartments of the thalamus-the nucleus reticularis thalami (nRT) and thalamocortical (TC) relay nuclei. Using whole cell patch-clamp electrophysiology, we simulated synthetic inhibitory (IPSCs) and synthetic excitatory postsynaptic currents (EPSCs), injected them in nRT and TC neurons, and examined how changes in their shape parameters regulated neuronal firing in different electrical states. We found that in response to synthetic IPSCs, TC neurons initiate low-threshold spikes (LTSs) earlier than nRT neurons, and the amplitude of IPSCs regulates the probability of initiating an LTS while the duration of IPSCs regulates the timing at which the LTS initiates. These results show that in the adult thalamus, LTS is regulated by IPSCs similarly to what has been reported for the immature thalamus. In addition, sharp driver-like EPSCs evoke more firing when nRT and TC neurons are silent; whereas slow modulator-like EPSCs evoke more firing when nRT and TC neurons are active. Critically, we have generated a quantitative map of how features of synaptic currents shape neuronal firing in relationship with activity states.NEW & NOTEWORTHY We provide a systematic overview of how the shape parameters (i.e., amplitude, duration, and charge) of synthetic inhibitory and excitatory synaptic currents regulate neuronal firing in the adult murine thalamus across cell types (nRT vs. TC neurons) and electrical states (active vs. silent).

Keywords: circuits; electrophysiology; patch clamp; thalamus.


Conflict of interest statement

DISCLOSURES

No conflicts of interest, financial or otherwise, are declared by the authors.

Figures

Figure 1.
Figure 1.
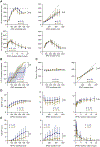
Firing inhibition by synthetic IPSCs during ongoing activity. A, top: current injection protocol and recording configuration. Middle: representative traces of nRT (green) and TC (orange) neurons in response to synthetic IPSCs of increasing amplitude and charge, with the duration held constant at 400 ms. *Traces selected for D. Bottom: instantaneous firing rate plots. B, top: current injection protocol. Middle: representative traces of nRT neurons in response to synthetic IPSCs of increasing duration and charge, with the amplitude held constant at 50 pA. Bottom: instantaneous firing rate plots. C, top: current injection protocol. Middle: representative traces of nRT neurons in response to synthetic IPSCs of increasing amplitude and decreasing duration, with the charge held constant at 22,500 fC. Bottom: instantaneous firing rate plots. D: zoomed-in traces showing responses to synthetic IPSCs. Dashed lines indicate the start and end of synthetic IPSCs. Arrows indicate the time to LTS. E: summary data for results shown in B (left), C (middle), and D (right). Dashed lines indicate the duration of synthetic IPSCs used in the protocols. Two-way RM ANOVA comparing the mean action potential resumption time between nRT (green) and TC (orange) neurons while varying different IPSC shape parameters. IPSC amplitude (left) (nRT: n = 18 cells, TC: n = 17 cells, P = 1.30 × 10⁻⁴); IPSC duration (middle) (nRT: n = 17 cells, TC: n = 15 cells, P = 1.58 × 10⁻⁴); IPSC duration/amplitude ratio (right) (nRT: n = 16 cells, TC: n = 16 cells, P = 1.48 × 10⁻²). IPSCs, inhibitory postsynaptic currents; LTS, low-threshold spike; nRT, nucleus reticularis thalami; TC, thalamocortical nuclei. Statistical thresholds used were as follows: *P < 0.05; ***P < 0.001.
Figure 2.
Figure 2.
LTS evoked by synthetic IPSCs from rest. A, top: current injection protocol. Middle: representative traces of nRT (green) and TC (orange) neurons in response to synthetic IPSCs of increasing amplitude and charge, with the duration held constant at 400 ms. Bottom: traces overlaid. Dashed lines indicate the start and end of synthetic IPSCs. B, top: current injection protocol. Middle: representative traces of nRT (green) and TC (orange) neurons in response to synthetic IPSCs of increasing duration and charge, with the amplitude set at the threshold current, which is defined as the current that evokes LTS at all steps. Bottom: traces overlaid. C: cumulative probability of evoking LTS with increasing synthetic IPSC amplitude. Two-way RM ANOVA comparing the two cumulative probability curves between nRT (green) and TC (orange) neurons (nRT: n = 20 cells, TC: n = 18 cells, P = 6.57 × 10⁻¹). D: summary data for results shown in A and B. Dashed lines indicate the duration of synthetic IPSCs used in the protocols. Two-way RM ANOVA comparing the mean time to LTS from the start of synthetic IPSC between nRT (green) and TC (orange) neurons while varying different IPSC shape parameters. IPSC amplitude (left) (nRT: n = 20 cells, TC: n = 18 cells, P = 4.42 × 10⁻³); IPSC duration (right) (nRT: n = 16 cells, TC: n = 18 cells, P = 6.23 ×10⁻⁶). IPSCs, inhibitory postsynaptic currents; LTS, low-threshold spike; nRT, nucleus reticularis thalami; NS, not significant; TC, thalamocortical nuclei. Statistical thresholds used were as follows: **P < 0.01; ****P < 0.0001.
Figure 3.
Figure 3.
Firing evoked by synthetic EPSCs during ongoing activity. A, top: current injection protocol. Middle: representative traces of nRT neurons in response to synthetic EPSCs of increasing amplitude and charge, with the duration held constant at 400 ms. Bottom: instantaneous firing rate plots. B, top: current injection protocol. Middle: representative traces of nRT neurons in response to synthetic EPSCs of increasing duration and charge, with the amplitude held constant at 50 pA. Bottom: instantaneous firing rate plots. C, top: current injection protocol. Middle: representative traces of nRT neurons in response to synthetic EPSCs of increasing amplitude and decreasing duration, with the charge held constant at 22,500 fC. Bottom: instantaneous firing rate plots. D: summary data for results shown in A (left), B (middle), and C (right). Two-way RM ANOVA comparing the mean number of action potentials evoked between nRT (green) and TC (orange) neurons while varying different EPSC shape parameters. The total count of action potentials evoked from the start of the synthetic EPSC to 500 ms after is shown. The start of a synthetic EPSC is 1 s after the start of the depolarizing current injection. EPSC amplitude (left) (nRT: n = 16 cells, TC: n = 15 cells, P = 2.75 × 10⁻⁵); EPSC duration (middle) (nRT: n = 19 cells, TC: n = 14 cells, P = 4.34 × 10⁻³); EPSC duration/amplitude ratio (right) (nRT: n = 18 cells, TC: n = 19 cells, P = 2.62 × 10⁻⁵). EPSCs, excitatory postsynaptic currents; LTS, low-threshold spike; nRT, nucleus reticularis thalami; TC, thalamocortical nuclei. Statistical thresholds used were as follows: ***P < 0.001; ****P < 0.0001.
Figure 4.
Figure 4.
Firing evoked by synthetic EPSCs from rest. A: top: current injection protocol. Middle: representative traces of nRT neurons in response to synthetic EPSCs of increasing amplitude and charge, with the duration held constant at 400 ms. Bottom, instantaneous firing rate plots. B, top: current injection protocol. Middle: representative traces of nRT neurons in response to synthetic EPSCs of increasing duration and charge, with the amplitude held constant at 150 pA. Bottom: instantaneous firing rate plots. C, top: current injection protocol. Middle: representative traces of nRT neurons in response to synthetic EPSCs of increasing amplitude and decreasing duration, with the charge held constant at 22,500 pA·ms. Bottom: instantaneous firing rate plots. D: summary data for results shown in A (left), B (middle), and C (right). Two-way RM ANOVA comparing the mean number of action potentials evoked between nRT (green) and TC (orange) neurons while varying different EPSC shape parameters. EPSC amplitude (left) (nRT: n = 17 cells, TC: n = 15 cells, P = 7.95 × 10⁻⁸); EPSC duration (middle) (nRT: n = 19 cells, TC: n = 16 cells, P = 4.39 × 10⁻⁵); EPSC duration/amplitude ratio (right) (nRT: n = 19 cells, TC: n = 16 cells, P = 2.75 × 10⁻⁴). EPSCs, excitatory postsynaptic currents; LTS, low-threshold spike; nRT, nucleus reticularis thalami; TC, thalamocortical nuclei. Statistical thresholds used were as follows: ***P < 0.001; ****P < 0.0001.
Figure 5.
Figure 5.
No difference in firing response to synthetic currents between VB and VL neurons. A: summary data for results shown in Fig. 1D with TC data split into VB and VL groups. Dashed lines indicate the duration of synthetic IPSCs used in the protocols. Two-way RM ANOVA comparing the mean action potential resumption time between VB (copper) and VL (blue) neurons while varying different IPSC shape parameters. IPSC amplitude (top left) (VB: n = 6 cells, VL: n = 8 cells, P = 0.17); IPSC duration (top right) (VB: n = 4 cells, VL: n = 7 cells, P = 0.75); IPSC duration/amplitude ratio (bottom) (VB: n = 3 cells, VL: n = 10 cells, P = 0.89). B: summary data for results shown in Fig. 2C with TC data split into VB and VL groups. Two-way RM ANOVA comparing the two cumulative probability curves between VB (copper) and VL (blue) neurons (VB: n = 8 cells, VL: n = 4 cells, P = 0.41). C: summary data for results shown in Fig. 2D with TC data split into VB and VL groups. Dashed lines indicate the duration of synthetic IPSCs used in the protocols. Two-way RM ANOVA comparing the mean time to LTS from the start of synthetic IPSC between VB (copper) and VL (blue) neurons while varying different IPSC shape parameters. IPSC amplitude (left) (VB: n = 8 cells, VL: n = 4 cells, P = 0.97); IPSC duration (right) (VB: n = 6 cells, VL: n = 6 cells, P = 0.53). D: summary data for results shown in Fig. 3D with TC data split into VB and VL groups. Two-way RM ANOVA comparing the mean number of action potentials evoked between VB (copper) and VL (blue) neurons while varying different EPSC shape parameters. EPSC amplitude (left) (VB: n = 6 cells, VL: n = 8 cells, P = 0.15); EPSC duration (middle) (VB: n = 6 cells, VL: n = 7 cells, P = 0.51); EPSC duration/amplitude ratio (right) (VB: n = 7 cells, VL: n = 9 cells, P = 0.65). E: summary data for results shown in Fig. 4D with TC data split into VB and VL groups. Two-way RM ANOVA comparing the mean number of action potentials evoked between VB (copper) and VL (blue) neurons while varying different EPSC shape parameters. EPSC amplitude (left) (VB: n = 8 cells, VL: n = 5 cells, P =0.23); EPSC duration (middle) (VB: n = 9 cells, VL: n = 5 cells, P = 0.30); EPSC duration/amplitude ratio (right) (VB: n = 8 cells, VL: n = 6 cells, P = 0.74). EPSCs, excitatory postsynaptic currents; IPSCs, reticularis thalami; NS, not significant; TC, thalamocortical nuclei; EPSCs, inhibitory postsynaptic currents; LTS, low-threshold spike; nRT, nucleus reticularis thalami; NS, not significant; TC, thalamocortical nuclei; VB, ventrobasal nucleus; VL, ventrolateral nucleus.

References

    1. Crick F Function of the thalamic reticular complex: the searchlight hypothesis. Proc Natl Acad Sci USA 81: 4586–4590, 1984. doi: 10.1073/pnas.81.14.4586. - DOI - PMC - PubMed
    1. Houser CR, Vaughn JE, Barber RP, Roberts E. GABA neurons are the major cell type of the nucleus reticularis thalami. Brain Res 200: 341–354, 1980. doi: 10.1016/0006-8993(80)90925-7. - DOI - PubMed
    1. Gentet LJ, Ulrich D. Strong, reliable and precise synaptic connections between thalamic relay cells and neurones of the nucleus reticularis in juvenile rats. J Physiol 546: 801–811, 2003. doi: 10.1113/jphysiol.2002.032730. - DOI - PMC - PubMed
    1. Clemente-Perez A, Makinson SR, Higashikubo B, Brovarney S, Cho FS, Urry A, Holden SS, Wimer M, Dávid C, Fenno LE, Acsády L, Deisseroth K, Paz JT. Distinct thalamic reticular cell types differentially modulate normal and pathological cortical rhythms. Cell Rep 19: 2130–2142, 2017. doi: 10.1016/j.celrep.2017.05.044. - DOI - PMC - PubMed
    1. Paré D, Hazrati LN, Parent A, Steriade M. Substantia nigra pars reticulata projects to the reticular thalamic nucleus of the cat: a morphological and electrophysiological study. Brain Res 535: 139–146, 1990. doi: 10.1016/0006-8993(90)91832-2. - DOI - PubMed

LinkOut - more resources