. 2025 Mar 25;8(6):e202403114.
doi: 10.26508/lsa.202403114. Print 2025 Jun.

Rapid ER remodeling induced by a peptide-lipid complex in dying tumor cells

Affiliations

Rapid ER remodeling induced by a peptide-lipid complex in dying tumor cells

Samudra Sabari et al. Life Sci Alliance. .

Abstract

The membranous ER spans the entire cell, creating a network for the biosynthesis of proteins and lipids, cell-wide communication, and nuclear delivery of molecules, including therapeutic agents. Here, we identify a novel ER response triggered by the tumoricidal complex alpha1-oleate, defined by a loss of peripheral ER structure, extensive ER vesiculation. Alpha1-oleate was present in the ER-derived vesicle membranes, also decorated by ER-resident and ER-interacting proteins, calnexin and ORP3, and in their lumen, also enriched for KDEL, confirming their ER origin distinct from lipid droplets. Rapid nuclear uptake of the complex constituents resulted in diffuse nuclear staining, and the asymmetrical perinuclear enrichment of the collapsing ER with its content of alpha1-oleate created large invaginations lined by the ER, inner nuclear membrane markers, and lamin nucleoskeleton. In parallel, a change in nuclear shape resulted in a volcano-like structure. This newly discovered, potent ER response to alpha1-oleate may have evolved to package ER-associated cellular contents in the nuclei of dying tumor cells, thus sequestering toxic cell debris associated with apoptotic cell death.


Conflict of interest statement

C Svanborg and I Ambite hold shares in HAMLET BioPharma, as a representative of scientists in the HAMLET group. Patents protecting the use of the alpha1-oleate complex have been granted. Other authors declare no conflict of interest.

Figures
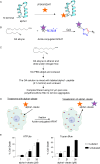
Figure S1.
Figure S1.. Technology used for labeling of the alpha1-oleate.
(A) Schematic representation of the N-terminal labeling of the alpha1-peptide with photostable dyes JF549 or AZ647 (orange star). (B) Oleic acid (OA) alkyne reacts with copper-catalyzed azide-conjugated dyes through cycloaddition. This allows the visualization of the lipid in treated cells post-fixation using AF647 (purple star). (C) Method for preparing the alpha1-oleate from its labeled peptide and OA-alkyne constituents. (D) Schematic representation of the uptake of the labeled peptide and clicked oleate in tumor cells followed by the addition of fluorescently labeled clicked partner for visualization using microscopy. (E) Biological activity of the labeled and unlabeled alpha1-oleate. Tumoricidal effect of the labeled alpha1-oleate quantified in A549 cells by measuring ATP levels to quantify cell death (left panel) or trypan blue exclusion (right panel) with 60-min treatment. The tumoricidal activity of the labeled alpha1-oleate was reduced, compared with unlabeled alpha1-oleate. The individual JF549 alpha1-peptide or OA-alkyne constituents of the alpha1-oleate complex did not affect cell viability. Data represent the mean ± SEM of three independent experiments. In subsequent experiments, three different preparations of alpha1-oleate were used: labeled alpha1-oleate (35 μM), unlabeled alpha1-oleate (21 μM), or mixtures 1:1 vol/vol of labeled alpha1-oleate (35 μM) and unlabeled alpha1-oleate (21 μM).
Figure 1.
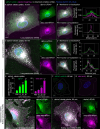
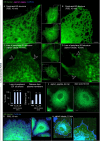
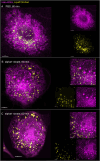
Figure 1.. Rapid internalization of the alpha1-oleate complex by tumor cells.
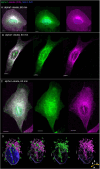
(A) A549 cells were exposed to the alpha1-oleate complex formed by JF549-labeled alpha1-peptide (green) and the AF647 click–labeled oleic acid (magenta). Airyscan images of cells exposed to the labeled complex (35 μM) for 10 min, showing diffuse staining throughout the cytoplasm, intense staining in the perinuclear region, and staining inside the nuclei. Merged images and single channels are shown. In fixed cells, nuclei are visualized by lamin A/C (blue) immunostaining with anti-mouse AF405 secondary antibodies. (B) Line scans quantifying the alpha1-peptide and oleic acid signals in the cytoplasm, perinuclear, and nuclear areas after 10 min. (C) Distribution of JF549-labeled alpha1-peptide and AF647 click–labeled oleic acid in A549 cells after 60 min of exposure. Airyscan images showing diffuse and punctate staining throughout the cytoplasm, intense staining in the perinuclear region, and staining inside the nuclei. Merged images and single channels are shown. (D) Line scans quantifying the alpha1-peptide and oleic acid signals in the cytoplasm, perinuclear, and nuclear areas after 60 min. Further line scans supporting the co-localization are shown in Figs S4 and S5. (E) Quantification of the complex constituents in whole cells. Data are expressed as the mean ± SEM from maximum intensity projections collected using z-stacks (n = 15 cells per time point) obtained from one typical experiment. Statistical significance was determined by one-way ANOVA with Šidák’s multiple comparison test. ***P < 0.001, **P = 0.004. (F, G) Control experiment in A549 cells exposed to JF549-labeled alpha1-peptide or the AF647 click–labeled oleic acid. No evidence of uptake of the individual labeled complex constituents after 60 min. The white dotted line marks the cell periphery. (H, I) U251 glioblastoma cells and (I) A498 kidney carcinoma cells exposed to the alpha1-oleate complex formed by JF549-labeled alpha1-peptide and the AF647 click–labeled oleic acid. Airyscan images of cells exposed to the labeled complex (35 μM) for 10 min, showing diffuse and punctate staining throughout the cytoplasm, intense staining in the perinuclear region, and staining inside the nuclei. Merged images and single channels are shown. Scale bar, 5 μm (A, B, C, D, F, G, H); 7 μm (I).
Figure S2.
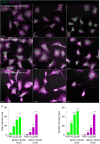
Figure S2.. Time-dependent uptake of alpha1-oleate in A549 lung carcinoma cells (supporting images for Fig 1A and C).
(A, B, C) A549 cells were exposed to the alpha1-oleate complex formed by JF549-labeled alpha1-peptide (green) and the AF647 click–labeled oleic acid (magenta). Large fields of view of alpha1-oleate uptake. (A, B, C) Three large field-of-view confocal images show the uptake of the labeled alpha1-oleate (35 μM) after 10 (A), 20 (B), and 60 (C) min of exposure. Images shown with the same gain. In fixed cells, nuclei are visualized by lamin A/C (blue) immunostaining with anti-mouse AF405 secondary antibody. Merged images and single channels are shown. (A, B, C, D) Quantification of the total and nuclear uptake of alpha1-oleate in (A, B, C). Data are expressed as the mean ± SEM. Statistical significance was determined by the Kruskal–Wallis test with Dunn’s multiple comparisons, n = 60 cells per time point. ***P < 0.001. Scale bar, 20 μm.
Figure S3.
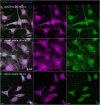
Figure S3.. Time-dependent uptake and distribution of alpha1-oleate in A549 lung carcinoma cells (supporting images for quantification shown in Fig 1E).
(A, B, C) A549 cells were exposed to the alpha1-oleate complex formed by JF549-labeled alpha1-peptide (green) and the AF647 click–labeled oleic acid (magenta). (A, B, C) Maximum intensity projection of the z-stacks obtained by confocal imaging shows the uptake of the labeled alpha1-oleate (35 μM) after 10 (A), 20 (B), and 60 (C) min of exposure. Images shown with the same gain. In fixed cells, nuclei are visualized by lamin A/C (blue) immunostaining with anti-mouse AF405 secondary antibody. Merged images and single channels are shown. Scale bar, 10 μm.
Figure S4.
Figure S4.. Co-localization of alpha1 and oleic acid in different cellular compartments after 10 min.
(A, B, C) A549 cells were exposed to the alpha1-oleate complex formed by JF549-labeled alpha1-peptide (green) and the AF647 click–labeled oleic acid (red). Airyscan images showing the distribution of the labeled alpha1-oleate (35 μM) constituents in different cellular compartments. (A, B, C, D, E, F) Line scans (white lines) quantifying the alpha1-peptide and oleic acid signals in the plasma membrane (A), perinuclear region (B), and nucleus (C) after 10 min of treatment. Baseline intensities (outside the cell) are indicated by the horizontal dotted line. The boxes indicate the respective compartments. Line scans through the cell periphery showed significant co-localization of alpha1 and oleic acid with enrichment in certain membrane areas. Line scans through the perinuclear region showed a distinct pattern of enhanced accumulation of both complex constituents compared to the outside of the cell with higher abundance of oleic acid. Line scans through the nuclei showed significant co-localization of the alpha1-peptide and oleic acid, with higher abundance of peptide over oleic acid. The alpha1-oleate complex stoichiometry of 1 peptide to 3–5 oleic acid residues (Brisuda et al, 2021) predicts higher abundance of oleic acid in the cellular compartments, which is seen in the perinuclear compartment. Scale bar, 10 μm.
Figure S5.
Figure S5.. Co-localization of alpha1 and oleic acid in different cellular compartments after 60 min.
(A, B, C) A549 cells were exposed to the alpha1-oleate complex formed by JF549-labeled alpha1-peptide (green) and the AF647 click–labeled oleic acid (red). Airyscan images showing the distribution of the labeled alpha1-oleate (35 μM) constituents in different cellular compartments. (A, B, C, D, E, F) Line scans (white lines) quantifying the alpha1-peptide and oleic acid signals in the plasma membrane (A), perinuclear region (B), and nucleus (C) after 60 min of treatment. The distinct pattern of perinuclear and nuclear accumulation seen after 10 min of treatment was further accentuated after 60 min. The boxes indicate the respective compartments. Baseline intensities (outside the cell) are indicated by the horizontal dotted line. Scale bar, 10 μm.
Figure S6.
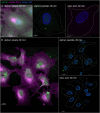
Figure S6.. Uptake of alpha1-oleate in different tumor cell lines after 60 min (supporting images for Fig 1H and I).
(A, B, C) U251 glioblastoma cells, A498 kidney carcinoma cells, and HTB9 bladder carcinoma cells were exposed to the alpha1-oleate complex formed by JF549-labeled alpha1-peptide (green) and the AF647 click–labeled oleic acid (magenta). Large field-of-view confocal images show the uptake of the labeled alpha1-oleate (35 μM) in the three different cancer cell lines after 60 min. In fixed cells, nuclei are visualized by lamin A/C (blue) immunostaining with anti-mouse AF405 secondary antibody. Merged images and single channels are shown. Scale bar, 10 μm.
Figure S7.
Figure S7.. Absence of significant uptake of alpha1-peptide and oleic acid in A549 cells (supporting images for Fig 1F and G).
(A) Control experiments in A549 cells exposed to JF549-labeled alpha1-peptide (35 μM) or the AF647 click–labeled oleic acid (175 μM) show no significant uptake of the individual labeled complex constituents after 60 min in contrast to treatment with labeled alpha1-oleate (35 μM) in the single-cell confocal images. (B) Large field-of-view confocal images for the control experiments are provided. The white dotted line marks the cell periphery. All images were captured with the same gain. In fixed cells, nuclei are visualized by lamin A/C (blue) immunostaining with anti-mouse AF405 secondary antibody. Scale bar, 5 μm (A); 10 μm (B).
Figure 2.
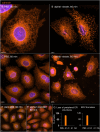
Figure 2.. Peripheral ER response induced by the alpha1-oleate complex.
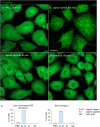
(A, B) Live-cell confocal images of A549 cells stained with the BODIPY-based ER-Tracker showing the ER network (green) extending from the cellular periphery to the perinuclear region in cells treated with PBS. (C, D) Rapid loss of peripheral ER structure in response to alpha1-oleate (unlabeled, 21 μM) treatment shown after 10 min of exposure. Loss of peripheral tubules and sheets in the retracting ER is indicated by arrows. (E) Quantification of the loss of peripheral ER structure and distance of the remaining ER from the cell periphery. Data are expressed as the mean ± SEM of three independent experiments, n = 50 cells per experiment. Statistical significance was determined by one-way ANOVA with Šidák’s multiple comparison test for loss of peripheral ER structure and the Kruskal–Wallis test with Dunn’s multiple comparison test for distance of ER from periphery. ***P < 0.001. (F) Control experiments in A549 cells exposed to alpha1-peptide (21 μM) or oleic acid (105 μM) show no change in peripheral ER structure. (G, H) Membrane marker CellBrite (blue) was used to visualize the change in membrane staining at the cell periphery of alpha1-oleate–treated cells. Scale bar, 3 μm ((A, B, C, D, G, H): cell periphery), 5 μm ((A, B, C, D, F, G): whole cell, (H): whole cell).
Figure S8.
Figure S8.. Loss of periphery and EDV formation triggered by alpha1-oleate, but not the individual constituents in A549 cells.
(A) Live-cell confocal images showing the ER network (green) extending from the cellular periphery to the perinuclear region in control cells (PBS) using BODIPY-based ER-Tracker staining in a large field of view. (B) ER response characterized by loss of peripheral structures (arrow) and formation of ER-derived vesicles (EDVs, arrow) visualized in alpha1-oleate (unlabeled, 21 μM)–treated cells after 60 min. (C, D) Control experiments in A549 cells exposed to alpha1-peptide (unlabeled, 21 μM) or oleic acid (unlabeled, 105 μM) show no loss of peripheral ER structures or EDV formation. Representative live-cell confocal images. (A, B, C, D, E) Quantification of the loss of peripheral ER structure and EDV formation is provided for (A, B, C, D). Scale bar, 15 μm (A, C, D); 20 μm (B).
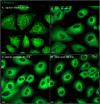
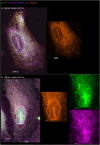
Figure S9.
Figure S9.. Alpha1-oleate triggered an increase in distance between the plasma membrane and the retracting ER network in A549 cells (supporting images for Fig 2G and H).
(A, B) Live-cell confocal images show the ER structure in A549 cells stained with the BODIPY-based ER-Tracker, along with the corresponding brightfield images for PBS in a large field of view. (C, D) Live-cell confocal images show the remodeled ER structure in A549 cells treated with alpha1-oleate (unlabeled, 21 μM) for 10 min, along with the corresponding brightfield images in a large field of view. (E, F) Live-cell confocal images show the remodeled ER structure in A549 cells treated with alpha1-oleate (unlabeled, 21 μM) for 60 min, along with the corresponding brightfield images in a large field of view. The distance between the plasma membrane and the retracting ER network was quantified by drawing lines between the edge of the retracting ER network, defined by ER-Tracker staining, and the edge of the cell, defined by brightfield microscopy (demarked by a white dotted line) in images taken at 63X magnification. Scale bar, 15 μm (A, C); 10 μm (B, D, E, F).
Figure S10.
Figure S10.. Retention of cell membrane staining visualized using CellBrite in alpha1-oleate–treated A549 cells (supporting images for Fig 2G and H).
(A) Live-cell confocal images show the membrane staining using CellBrite (blue) in A549 cells, co-stained with ER-Tracker, in control (PBS treatment) in a large field of view. (B) CellBrite (blue) was used to visualize changes in membrane staining at the cell periphery of alpha1-oleate (unlabeled, 21 μM)–treated cells. Large field-of-view confocal images reveal distinct CellBrite staining at the cell periphery, contrasting with the loss of peripheral ER after 10 min of alpha1-oleate treatment. CellBrite also partially stained the remodeled ER structures. Merged images and single channels are shown. Scale bar, 15 μm (A, B).
Figure 3.
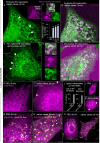
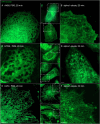
Figure 3.. Formation of ER-derived vesicles (EDVs) in alpha1-oleate–treated cells.
(A, B) Live-cell confocal images of A549 cells exposed to alpha1-oleate for 10 min. The AZ647-labeled peptide is shown in magenta. EDV formation was observed in the cell periphery after 10 min of exposure to the labeled alpha1-oleate (mixed complex). ER membranes were stained with ER-Tracker (green), and examples of EDVs are indicated by arrows. (B, C) Zoomed-in image of an EDV (in (B)) showing the co-localization of alpha1-oleate with the EDV membrane and presence inside the lumen of vesicle. (D) Quantification of EDV formation triggered by alpha1-oleate (unlabeled, 21 μM). Data are expressed as the mean ± SEM of three independent experiments, n = 50 cells per experiment. Statistical significance was determined by one-way ANOVA with Šidák’s multiple comparison test. ***P < 0.001. (E, F) Live-cell confocal images of A549 cells exposed to unlabeled alpha1-oleate (21 μM) or labeled alpha1-oleate (mixed complex) for 60 min. Clusters of EDVs in the perinuclear area are indicated by white arrows. (F, G) Zoomed-in image of an EDV (in (F)) showing the co-localization of alpha1-oleate with the EDV membrane (merged image), the peptide (magenta), and ER-Tracker (green). The peptide was detected in the ER membrane and inside the lumen of vesicle. (H, I) Halo-KDEL–transfected A549 cells, confirming the loss of peripheral ER structure (arrows) after 60-min exposure to alpha1-oleate (unlabeled, 21 μM) compared with PBS. Cells were counterstained with silicon–rhodamine dye (magenta). Representative live-cell confocal images. (J, K) Halo-KDEL–transfected A549 cells show the formation of EDVs after 60-min exposure to alpha1-oleate (unlabeled, 21 μM) compared with PBS treatment. (L) Quantification of loss of periphery and EDV formation triggered by alpha1-oleate (unlabeled, 21 μM) is provided. Data are expressed as the mean of two independent experiments, n = 40 cells per experiment. (M) Distribution of lipid droplets in A549 cells transfected with Halo-KDEL. The ER network was visualized with silicon–rhodamine dye (magenta), and the lipid droplets by counterstaining with LipidTOX Red (yellow). (N) Most of the halo-KDEL–filled EDVs (magenta, arrows) formed upon exposure to alpha1-oleate (unlabeled, 21 μM) for 60 min are not co-localized with lipid droplets. Live-cell confocal image, representative cells are shown. (M, N, O) Confocal images of the whole cell magnified in (M, N) are provided. Mixed alpha1-oleate: 1:1 vol/vol, labeled, 35 μM, and unlabeled, 21 μM. Scale bar, 5 μm (A, B, E, F, J, K, O); 2 μm (H, I, M, N); 1 μm (C, G).
Figure S11.
Figure S11.. Co-localization of the labeled alpha1-oleate complex with remodeled ER in A549 cells.
(A) Live-cell confocal images of A549 cells exposed to alpha1-oleate for 10 min. The AZ647-labeled peptide is shown in magenta. EDV formation was observed after 10 min of exposure to the labeled alpha1-oleate (mixed complex) is observed in the large field-of-view images. ER membranes were stained with ER-Tracker (green). Merged images and single channels are shown. (B, C) Line scans (white lines) quantifying the co-localization of alpha1-oleate (mixed labeled) with EDV membranes and presence inside the EDV lumen. Mixed labeled alpha1-oleate is 1:1 vol/vol of labeled alpha1-oleate (35 μM) and unlabeled alpha1-oleate (21 μM). Scale bar, 15 μm (A); 5 μm (B, C).
Figure S12.
Figure S12.. Visualization of KDEL-filled ER-derived vesicles (EDVs) enveloped by ER-Tracker formed by alpha1-oleate treatment in A549 cells (supporting images for Fig 3M–O).
(A, B) Additional live-cell confocal images of halo-KDEL–transfected A549 cells, counterstained with silicon–rhodamine dye (magenta) and ER-Tracker (green). A time-dependent increase in KDEL-filled EDVs is visualized after treatment with alpha1-oleate (unlabeled, 21 μM). These images clearly illustrate that the KDEL-filled EDVs are lined by ER-Tracker. Merged images and single channels are shown. Scale bar, 5 μm.
Figure S13.
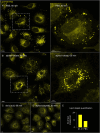
Figure S13.. Effect of alpha1-oleate on lipid droplet distribution in A549 cells.
(A) Live-cell confocal images show the distribution of lipid droplets by LipidTOX Red Neutral Lipid Stain (yellow) in a large field of view in control (PBS-treated). A zoomed-in cell (right panel) from the large field of view (white dotted box) is provided to visualize the cellular distribution of lipid droplets in detail. (B) Representative large field-of-view confocal images show the change in the distribution of lipid droplets upon exposure to alpha1-oleate (unlabeled, 21 μM) for 60 min. A zoomed-in cell (right panel) from the large field of view (white dotted box) is provided to visualize the increase in the number and size of the lipid droplets triggered by alpha1-oleate. (C, D) Control experiments in A549 cells exposed to alpha1-peptide (unlabeled, 21 μM) or oleic acid (unlabeled, 105 μM) show no change in lipid droplet distribution compared with alpha1-oleate. (A, B, E) Quantification of the lipid droplet distribution in (A, B) is provided. Lipid droplets with a diameter higher than 0.5 μm were counted. One experiment, n = 38 and 41 cells for alpha1-oleate and PBS. Scale bar, 10 μm.
Figure S14.
Figure S14.. Most of the ER-derived vesicles (EDVs) formed by alpha1-oleate do not co-localize with lipid droplets in A549 cells.
(A) Additional live-cell confocal image shows the distribution of lipid droplets in A549 cells transfected with Halo-KDEL. The ER network was visualized with silicon–rhodamine dye (magenta), and the lipid droplets by counterstaining with LipidTOX Red (yellow). Lipid droplets were detected in the untreated cells at both the cell periphery and the perinuclear region. (B, C) Most of the halo-KDEL–filled EDVs formed upon exposure to alpha1-oleate (unlabeled, 21 μM) for 60 min are not co-localized with lipid droplets. The insets showing zoomed-in sections from the whole cell (white dotted box) further demonstrate the spatial separation between the lipid droplets and the KDEL-filled EDVs (arrows) formed upon alpha1-oleate treatment. Merged images and single channels are shown. Scale bar, 5 μm (A, B, C); 2 μm (insets: B, C).
Figure S15.
Figure S15.. Visualization of the loss of peripheral ER structures and ER-derived vesicle (EDV) formation triggered by alpha1-oleate using ER-resident protein, calnexin, in A549 cells.
(A, B) Confocal images show the characteristic loss of ER periphery, the formation of EDVs, and ER entry into the nucleus in A549 cells treated with alpha1-oleate (unlabeled, 21 μM) compared with PBS-treated controls. Nucleus and ER in the fixed cells were visualized by staining for lamin A/C (blue) with an AF405-conjugated anti-mouse secondary antibody and calnexin with an AF647-conjugated anti-rabbit secondary antibody. (C, D) Representative large field-of-view images show the ER remodeling response upon alpha1-oleate treatment (21 μM, unlabeled), compared with the PBS treatment in a large population of cells. (E, F) Control experiments in A549 cells exposed to alpha1-peptide (unlabeled, 21 μM) or oleic acid (unlabeled, 105 μM) show no loss of periphery and EDV formation. (C, D, E, F, G) Quantification of the loss of periphery and EDV formation observed in (C, D, E, F) is provided. Data are expressed as the mean ± SEM, n = 70 cells. A1-O, alpha1-oleate; A1-alpha1-peptide; OA, oleic acid. Scale bar, 5 μm (A, B); 10 μm (C, D, E, F).
Figure S16.
Figure S16.. Loss of peripheral ER structures induced by alpha1-oleate in different cancerous cell lines.
(A, B) Live-cell confocal image shows the rapid loss of peripheral ER structure in alpha1-oleate (unlabeled, 21 μM, 60 min)–treated A498 kidney carcinoma cells compared with PBS. (C, D) Live-cell confocal image shows the rapid loss of peripheral ER structure in alpha1-oleate (unlabeled, 21 μM, 60 min)–treated HTB9 bladder carcinoma cells for 60 min compared with PBS. (E, F) Live-cell confocal image shows the rapid loss of peripheral ER structure in alpha1-oleate (unlabeled, 21 μM, 60 min)–treated U251 glioblastoma cells compared with PBS. ER membranes were stained with ER-Tracker (green). White boxes in the whole-cell images (middle panels) indicate the regions in the zoomed-in sections (left and right panels). Scale bar, 3 μm (A, D, E, F, G, H); 5 μm (B, C, I, J, K, L).
Figure S17.
Figure S17.. ER-derived vesicle (EDV) formation induced by alpha1-oleate in different cancerous cell lines.
(A, B) Live-cell confocal image shows the EDV formation in alpha1-oleate (unlabeled, 21 μM, 60 min)–treated A498 kidney carcinoma cells for 60 min compared with PBS. (C, D) Live-cell confocal image shows the EDV formation in alpha1-oleate (unlabeled, 21 μM, 60 min)–treated HTB9 bladder carcinoma cells compared with PBS. (E, F) Live-cell confocal image shows the EDV formation in alpha1-oleate (unlabeled, 21 μM, 60 min)–treated glioblastoma cells compared with PBS. ER membranes were stained with ER-Tracker (green). White boxes in the whole-cell images (middle panels) indicate the regions in the zoomed-in sections (left panels). Scale bar, 3 μm (A, C, D, E); 7 μm (B, F).
Figure 4.
Figure 4.. ER response defined by membrane composition and defined by gene expression analysis.
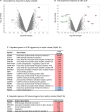
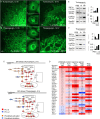
(A) Membrane vesicles (GUVs) were prepared using lipid mixtures representative of the ER or plasma membranes (PM) and exposed to alpha1-oleate (unlabeled, 21 μM) or PBS. GUVs were visualized using rhodamine B (magenta). (B) Rapid formation of membrane vesicles in ER-like GUVs exposed to alpha1-oleate (unlabeled, 21 μM). Minor structural changes were observed in PM-like GUVs exposed to alpha1-oleate. Stable morphology in GUVs exposed to PBS for both ER- and PM-like composition. (B, C) Quantification of membrane effects in (B) compared with PBS is provided. (D, E) Whole-genome transcriptomic analysis of human lung epithelial cells treated with alpha1-oleate (35 μM, 3 h) compared with PBS (control) (cutoff fold change ≥ 1.5). (D, E) Activation of the unfolded protein response pathway (D) and ER stress pathway (E) in response to alpha1-oleate treatment shown (red = up-regulation, blue = down-regulation, orange = predicted activation, light blue = predicted inhibition, gray = not significantly regulated). (F) Western blot analysis of top regulated ER stress markers, phosphorylated eIF2α and XBP1S in alpha1-oleate–treated cells (1 h) compared with PBS-treated controls. GAPDH is shown for loading control. Data are expressed as the mean of three independent experiments. Statistical significance was determined by a two-tailed unpaired t test. *P < 0.03, ns, not significant. (G) Strong up-regulation of apoptosis-related genes in alpha1-oleate–treated cells (318 genes compared with untreated controls). Top regulated apoptosis signaling genes are shown in the table. (H) TUNEL staining demonstrates apoptosis-like cell death triggered by alpha1-oleate, n = 50 cells (H). Scale bar, 10 μm (B); 30 μm (H).
Figure S18.
Figure S18.. Integration of alpha1-oleate into ER and PM into giant unilamellar vesicles (GUVs).
(A, B) Representative confocal images show the rapid formation of membrane vesicles (red) inside the lumen of the ER-like GUVs exposed to AZ-647-alpha1-oleate (green) compared with plasma membrane (PM)–like GUVs, where the peptide component of the complex is labeled. Minor structural changes were observed in PM-like GUVs exposed to alpha1-oleate. The membrane response is observed after alpha1-oleate (mixed labeled) comes in proximity of the GUVs. The yellow co-localization signal at the GUV periphery indicates integration of the alpha1-oleate into membrane vesicles. ER or PM GUVs were observed using rhodamine B staining. (C, D) Stable morphology in GUVs exposed to PBS for both ER- and PM-like composition was visualized. Mixed labeled alpha1-oleate is 1:1 vol/vol of labeled alpha1-oleate (35 μM) and unlabeled alpha1-oleate (21 μM).
Figure S19.
Figure S19.. ER response to alpha1-oleate defined by gene expression analysis in A549 cells.
(A, B) Control experiment in A549 cells exposed to alpha1-peptide (unlabeled, 21 μM) or oleic acid (105 μM) shows no significant effect on gene expression. One gene was down-regulated (green), and three were up-regulated (red) by alpha1-peptide treatment. Six genes were down-regulated (green), and 10 were up-regulated (red) by oleic acid treatment. Fold change compared with PBS-treated cells, cutoff FC ≥ 1.5, P < 0.05 (red, up-regulated; blue/green, down-regulated; gray, nonsignificant regulation). (C) List of the genes in the unfolded protein pathway activated by alpha1-oleate treatment (unlabeled, 35 μM, 3 h) is provided. (D) List of the genes in the ER stress response pathway activated by alpha1-oleate treatment (unlabeled, 35 μM, 3 h) is provided.
Figure S20.
Figure S20.. Effect of alpha1-oleate treatment on UPR and ER stress markers monitored using Western blot analysis.
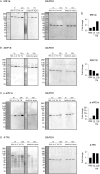
(A, B) No significant effect of alpha1-oleate (unlabeled, 35 μM, 3 h) treatment on the IRE1 pathway in the ER stress/UPR was monitored at the protein level using IRE1⍺ and XBP1S as representative markers in A549 cells. (C) Significant activation of the PERK pathway in the ER stress/UPR was observed at the protein level in A549 cells treated with alpha1-oleate (unlabeled, 35 μM, 3 h), as indicated by increased p-eIF2⍺ expression. (D) No significant effect of alpha1-oleate (unlabeled, 35 μM, 3 h) treatment on the ATF6 pathway in the ER stress/UPR triggered by alpha1-oleate was monitored at the protein level using ATF6(N) as a representative marker. (B, D, E) Quantification of the western blots shown in (B, D). Quantification for the rest of the markers is provided in Fig 4. Data are expressed as the mean of three independent experiments. Statistical significance was determined by two-tailed unpaired t test.
Figure S21.
Figure S21.. ER stress response to alpha1-oleate is less extensive than that induced by tunicamycin or thapsigargin.
(A) Representative live-cell confocal images show no significant loss of peripheral ER structure or EDV formation after 12 h of treatment with tunicamycin (30 μM) in A549 cells. In contrast, 53% of tunicamycin-treated cells showed no massive changes in ER structure. The remaining 47% of tunicamycin-treated cells displayed a massive destruction of ER ultrastructure. (B) Representative live-cell confocal images show no significant loss of peripheral ER structure or EDV formation after 12 h of treatment with thapsigargin (1 μM) in A549 cells. In contrast, 77% thapsigargin-treated cells showed no massive changes in ER structure. The remaining 23% thapsigargin-treated cells showed beehive-like deformations resembling documented ER whorls. White boxes in the whole-cell images (middle panels) indicate the regions shown in the zoomed-in sections (left or right panels). ER membranes were stained with ER-Tracker (green). (C) Broad activation of the ER stress pathway observed upon whole-genome transcriptomic analysis of A549 cells treated with tunicamycin (30 μM) or thapsigargin (1 μM) for 3 h, compared with DMSO-treated controls (fold change ≥ 2). Red = up-regulation, blue = down-regulation, orange = predicted activation, light blue = predicted inhibition, gray = not significantly regulated. (D) Strong activation of unfolded protein response observed in the list of the genes regulated by 3 h or 12 h of treatment with tunicamycin (30 μM) or thapsigargin (1 μM) compared with alpha1-oleate (35 μM, 3 h). The response notably involved the regulation of HSPA5, EIF2AK3, ERN1, XBP1, and ATF6. (E, F) Western blot analysis of top regulated ER stress pathway markers, phosphorylated eIF2α and IRE1α in tunicamycin (30 μM)- or thapsigargin (1 μM)-treated A549 cells compared with PBS-treated controls. GAPDH was used as loading controls. (E) Splice is present after the first lanes in the blots for p-eIF2α and GAPDH in (E). This splice is indicated by a vertical black line, which denotes the location where the blot was edited for clarity. Source data are available for this figure.
Figure S22.
Figure S22.. Additional experiments showing the ER stress response induced by tunicamycin and thapsigargin in A549 cells.
(A, B, C) Live-cell confocal images show no loss of peripheral ER structure or EDV formation after 1 h of treatment by tunicamycin (30 μM) or thapsigargin (1 μM) in A549 cells compared with control (PBS-treated). (D, E) Broad activation of the ER stress pathway observed upon whole-genome transcriptomic analysis of A549 cells treated with tunicamycin (30 μM) or thapsigargin (1 μM) for 12 h, compared with DMSO-treated controls (fold change ≥ 2). Red = up-regulation, blue = down-regulation, orange = predicted activation, light blue = predicted inhibition, gray = not significantly regulated. Scale bar, 10 μm (A, B, C).
Figure S23.
Figure S23.. Effect of tunicamycin treatment on UPR or ER stress markers monitored using Western blot analysis.
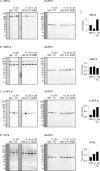
(A, B) Effect of tunicamycin (30 μM, 3 h or 12 h) treatment on the IRE1 pathway in the ER stress/UPR was monitored at the protein level using IRE1⍺ and XBP1S as representative markers in A549 cells. An increase in IRE1⍺ was observed after 12 h. (C) Activation of the PERK pathway in the ER stress/UPR was observed at the protein level in A549 cells treated with tunicamycin (30 μM, 3 h or 12 h), as indicated by an increase in p-eIF2⍺ expression. (D) Effect of tunicamycin (30 μM, 3 h or 12 h) treatment on the ATF6 pathway in the ER stress/UPR was monitored at the protein level using ATF6(N) as a representative marker. A slight increase in IRE1⍺ was observed after 1 and 12 h. (E) Quantification of the western blots is provided. TM, tunicamycin, A1-O, alpha1-oleate.
Figure S24.
Figure S24.. Effect of thapsigargin treatment on UPR or ER stress markers monitored using Western blot analysis.
(A, B) Effect of thapsigargin (1 μM, 3 h or 12 h) treatment on the IRE1 pathway in the ER stress/UPR was monitored at the protein level using IRE1⍺ and XBP1S as representative markers in A549 cells. An increase in IRE1⍺ was observed after 12 h. (C) Activation of the PERK pathway in the ER stress/UPR was observed at the protein level in A549 cells treated with thapsigargin (1 μM, 3 h or 12 h), as indicated by an increase in p-eIF2⍺ expression. (D) Effect of thapsigargin (1 μM, 3 h or 12 h) treatment on the ATF6 pathway in the ER stress/UPR was monitored at the protein level using ATF6(N) as a representative marker. A slight increase in IRE1⍺ was observed after 1 and 12 h. (E) Quantification of the western blots is provided. TG, thapsigargin, A1-O, alpha1-oleate.
Figure 5.
Figure 5.. Nuclear entry of the alpha1-oleate complex.
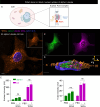
(A, B) Nuclear staining of A549 cells exposed to the alpha1-oleate complex. Representative images derived by Airyscan show the nuclear distribution of the labeled alpha1-oleate (35 μM) upon 10 and 60 min of exposure. The JF549-labeled alpha1-peptide (green) and the AF647 click–labeled oleic acid (magenta) were both detected inside the nuclei, after masking the lamin-stained body of the nuclei. Corresponding whole-cell Airyscan fluorescence images used to generate the masked nuclei are provided in Figs 1A and S26. (C) Quantification of the time-dependent increase in nuclear uptake of alpha1-oleate. Data are expressed as the mean ± SEM from maximum intensity projections collected using z-stacks, n = 17 cells for each time point. Statistical significance was determined by the Kruskal–Wallis test with Dunn’s multiple comparisons. **P < 0.002, ***P < 0.001, ns, not significant. (D, E) Nuclear uptake of the alpha1-oleate complex from the perinuclear area into tubular structures. 3D reconstruction of the entire nucleus and the perinuclear region of an A549 cell exposed to labeled alpha1-oleate (35 μM) for 10 or 60 min is shown. The nucleus is made transparent to visualize the entry of the complex from the perinuclear compartment. (F) Cross-section (y-z) through the 3D renderings of a representative treated A549 cell illustrates the accentuated perinuclear enrichment of the complex and the asymmetrical entry of alpha1-oleate in the nuclear invaginations (mixed complex, 60 min). (A) Both constituents were present (see panel (A)), but the process of 3D reconstruction only takes the highest signal into account. In fixed cells, nuclei are visualized by lamin A/C (blue) immunostaining with anti-mouse AF405 secondary antibody. Mixed alpha1-oleate: 1:1 vol/vol, labeled, 35 μM, and unlabeled, 21 μM. Scale bars, 2 μm (A, B, C, D, E, F).
Figure S25.
Figure S25.. Co-localization of alpha1 and oleic acid in the nuclear compartments after 60 min of treatment with alpha1-oleate (supporting images for Fig 5A).
(A, B, C) Airyscan images showing the distribution of the alpha1-oleate (labeled, 35 μM) constituents in the nuclear compartment in three representative cells. Line scans (white) represent the distribution of the complex constituents in the nucleus after 60 min of treatment. Alpha1 was labeled with JF549 (green), and oleic acid was clicked with AF647 (red). (D, E, F) Line scans (white lines) quantifying the alpha1-peptide and oleic acid signals inside the nucleus. The intensities corresponding to the nuclear compartments are indicated by the dotted boxes. Scale bar, 5 μm (A); 10 μm (B, C).
Figure S26.
Figure S26.. Nuclear uptake of alpha1-oleate: diffuse uptake and NER-associated entry (supporting images for Fig 4).
(A) Airyscan fluorescence images (maximum intensity projections of the z-stacks) of the whole cell showing the diffuse nuclear uptake of alpha1-oleate (labeled, 35 μM) are provided for the corresponding masked nucleus shown in Fig 4B. Alpha1 was labeled with JF549 (green), and oleic acid was clicked with AF647 (magenta). (B) Confocal images (maximum intensity projections of the z-stacks) showing the presence of alpha1-oleate constituents (alpha1, green, and oleic acid, magenta) in nuclear invaginations (NER) marked by lamin A/C staining in alpha1-oleate (mixed labeled)–treated A549 cells. The corresponding y-z cross-sections through the 3D surface of the nucleus further highlight the association of the alpha1-oleate constituents inside the invaginations provided in the main figure (Fig 4F). (C) Confocal image of a second alpha1-oleate (mixed labeled)–treated A549 cell highlighting the association of alpha1-oleate constituents with the nuclear invaginations. (D) Visualization of the alpha1-oleate constituents in the perinuclear area and inside the invaginations observed by 3D reconstructions. The transparent and the solid surfaces of the nucleus in the 3D reconstructions created with lamin A/C fluorescence allow the clear visualization of the constituents. Alpha1 was labeled with JF549 (green), and oleic acid was clicked with AF647 (magenta). The nuclei were visualized by lamin A/C immunostaining using secondary antibody (anti-mouse) labeled with AF405. 3D reconstructions were generated using Imaris. Mixed alpha1-oleate: 1:1 vol/vol (labeled, 35 μM, and unlabeled, 21 μM). Scale bar, 5 μm (A, B, C); 2 μm (D).
Figure S27.
Figure S27.. Nuclear pore blockage by WGA does not inhibit the nuclear entry of alpha1-oleate.
(A) Schematic illustration of a cell depicting WGA-mediated nuclear pore blockade, which inhibits nuclear transport. (B, C) Confocal image of an A549 cell loaded with labeled WGA (WGA-AF488, orange; 0.28 μM) shows the nuclear entry of the alpha1-oleate (labeled, 35 μM). (D) Presence of alpha1-oleate (alpha1, green, and oleic acid, magenta) in the nuclei of WGA-treated cells. 3D reconstruction with y-z cross-sections is shown. (E) Quantification of the nuclear and total uptake of the alpha1-oleate constituents in the presence and absence of WGA. Data are expressed as the mean ± SEM, n = 17 cells. Two-tailed unpaired t test was performed with and without WGA treatment. ns, not significant. Alpha1 was labeled with JF549 (green), and oleic acid was clicked with AF647 (magenta). The nuclei were visualized by lamin A/C immunostaining using secondary antibody (anti-mouse) labeled with AF405. 3D reconstructions were generated using Imaris. Scale bar, 5 μm (B, C); 3 μm (D).
Figure 6.
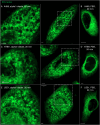
Figure 6.. ER entry inside the nucleus triggered by alpha1-oleate.
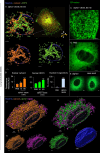
(A) 3D reconstruction of the nucleus of an A549 cell exposed to alpha1-oleate showing ER invaginations extending from the perinuclear region into the nuclear interior (unlabeled, 21 μM, 60 min). The ER-resident protein calnexin (cyan) and the ER-interacting protein ORP3 (green) are co-localized with the nuclear invaginations. Calnexin and ORP3 were visualized using secondary anti-rabbit AF647 and anti-mouse AF488, respectively. (B) Time-dependent increase in the nuclear content of calnexin and ORP3, and the percentage of cells showing nuclear invagination (observed with calnexin) after alpha1-oleate treatment, quantified from z-stacks. Data are expressed as the mean ± SEM of three independent experiments, n = 15 cells. Statistical significance was determined by the Kruskal–Wallis test with Dunn’s multiple comparisons (for nuclear calnexin); mean ± SEM of two independent experiments, n = 15 cells, one-way ANOVA with Šidák’s multiple comparison tests (for nuclear ORP3); mean ± SEM of three independent experiments, n = 50 cells at least, two-tailed unpaired t test (for nuclear invaginations). ***P < 0.001, *P < 0.033. (C, D) Accentuated ER staining inside the nucleus using ER-Tracker (green) in alpha1-oleate (unlabeled, 21 μM, 60 min)–treated A549 cell compared with the control (PBS). Representative live-cell confocal images. (E) Control experiments in A549 cells exposed to alpha1-peptide (21 μM) or oleic acid (105 μM) show no nuclear ER staining. (F, G) A549 cells were exposed to the alpha1-oleate complex formed by JF549-labeled alpha1-peptide (green) and the AF647 click–labeled oleic acid (magenta). 3D reconstruction of a transparent nucleus from a representative A549 cell treated with alpha1-oleate (mixed complex, 60 min) shows the presence of both constituents in the nuclear invaginations lined by the ER (calnexin). Calnexin and ORP3 were visualized using secondary anti-rabbit AF647 and anti-mouse AF488, respectively. (H) Individual channels are shown. (I) Solid body of the nucleus is shown, suggesting nuclear shape change. The corresponding fluorescence image of the whole cell is provided in Fig S26. Mixed alpha1-oleate: 1:1 vol/vol, labeled, 35 μM, and unlabeled, 21 μM. Scale bar, 2 μm (A, F, G, H, I); 3 μm (C, D, E); 5 μm ((A), whole cell).
Figure S28.
Figure S28.. Active response of ER-interacting lipid transporter protein ORP3 to alpha1-oleate.
(A, B) Confocal images show the active response of ER-associated protein, ORP3, in alpha1-oleate (unlabeled, 21 μM)–treated A549 cells. The images show the change from diffuse staining of ORP3 in control cells to a marked punctate staining decorating the remodeled ER network co-stained with calnexin in alpha1-oleate–treated cells. The calnexin staining (orange) was visualized using secondary antibody anti-rabbit labeled with AF647. The ORP3 staining (green) was visualized using secondary antibody anti-mouse labeled with AF488. Scale bar, 10 μm (A); 7 μm (B).
Figure S29.
Figure S29.. Nuclear entry of ER triggered by alpha1-oleate (supporting images for Fig 6A).
(A, B, C) Entry of ER from the perinuclear compartment into the nucleus forming the deep invaginations is visualized with calnexin (orange, ER-resident protein) and ORP3 (green, ER-interacting protein) fluorescence signals in alpha1-oleate (unlabeled, 21 μM)–treated A549 cell. The calnexin staining (orange) was visualized using secondary antibody anti-rabbit labeled with AF647. The ORP3 staining (green) was visualized using secondary antibody anti-mouse labeled with AF488. Scale bar, 5 μm.
Figure S30.
Figure S30.. NER type II formed by calnexin decorated with ORP3.
(A) 3D rendering of the nucleus (transparent) illustrates the NER type II invagination formed by calnexin and decorated with ORP3 in alpha1-oleate–treated A549 cell (unlabeled, 21 μM). (B) Fluorescence image is given for reference. (C) Shape change of the nucleus is visualized with solid body rendering of the nucleus constructed with Hoechst staining. (D) y-z cross-section of the nucleus shows the entry of calnexin and ORP3 into the body of the nucleus. (E) Fluorescence signal of individual markers (calnexin and ORP3) is visualized in the 3D rendering with the body of the nucleus made transparent. The calnexin staining (orange) was visualized using secondary antibody anti-rabbit labeled with AF647. The ORP3 staining (green) was visualized using secondary antibody anti-mouse labeled with AF488. 3D reconstructions were generated using Imaris. Scale bar, 2 μm (A, C, E); 3 μm (D); 7 μm (B).
Figure S31.
Figure S31.. Nuclear entry of ER triggered by alpha1-oleate visualized using live-cell imaging.
(A, B) Accentuated ER staining inside the nucleus using ER-Tracker (green) in alpha1-oleate (unlabeled, 21 μM, 60 min)–treated A549 cell compared with the control (PBS) shown in the live-cell large field-of-view confocal images. (C, D) Control experiments in A549 cells exposed to alpha1-peptide (21 μM) or oleic acid (105 μM) show no nuclear ER staining in the live-cell large field-of-view confocal images. Scale bar, 10 μm (A, B, C, D).
Figure S32.
Figure S32.. Active response of ER-resident protein ORP3 to alpha1-oleate.
(A, B) Large field-of-view confocal images show the change in ORP3 distribution from a diffuse pattern in PBS to large puncta decorating the cell periphery and enriched in the perinuclear and nuclear regions triggered by alpha1-oleate (unlabeled, 21 μM) treatment. Individual cells are shown further to show the change in ORP3 distribution upon alpha1-oleate treatment. (C, D) Control experiments in A549 cells exposed to alpha1-peptide (21 μM) or oleic acid (105 μM) show no change in ORP3 cellular distribution. Scale bar, 5 μm (individual cell in the middle panel; (A, B, C, D)); 10 μm (A, B, C, D).
Figure S33.
Figure S33.. Co-localization of alpha1-oleate constituents with the nuclear entry of ER triggered by alpha1-oleate.
(A) Airyscan images (maximum intensity projections of the z-stacks) of the whole cell showing association of alpha1-oleate constituents (alpha1, green, and oleic acid, magenta) with nuclear invaginations decorated with ER marker, calnexin (orange), provided for the corresponding 3D surface reconstructions shown in the main figure (Fig 6F–H). (B) Airyscan image of a second alpha1-oleate (mixed labeled)–treated A549 cell highlighting the association of alpha1-oleate constituents with calnexin, in the nuclear invaginations forming the type II NER. Alpha1 was labeled with JF549 (green), and oleic acid was clicked with AF647 (magenta). The nuclei were visualized by lamin A/C immunostaining using secondary antibody (anti-mouse) labeled with AF405. Mixed alpha1-oleate: 1:1 vol/vol (labeled, 35 μM, and unlabeled, 21 μM). Scale bar, 5 μm (A, B).
Figure 7.
Figure 7.. Nuclear shape change investigated by staining for inner nuclear membrane constituents and microtubular network.
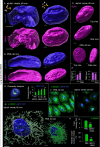
(A) Nuclear shape change, defined by staining the lamin nucleoskeleton (blue) and inner nuclear membrane protein SUN2 (magenta) fluorescence signals and visualized by 3D reconstructions of the nucleus in alpha1-oleate (unlabeled, 21 μM)–treated A549 cells. (B) Controls of nuclear shape from cells exposed to PBS. The corresponding y-z cross-sections (left) illustrate the transition from a smooth, rounded nuclear shape to a deformed morphology with large invaginations. (C) Shape change of the nucleus of an A549 cell treated with alpha1-oleate (unlabeled, 21 μM) for 60 min, visualized with another inner nuclear membrane marker SUN1 (magenta). The SUN1/SUN2 and lamin A/C were visualized using secondary anti-rabbit AF647 and anti-mouse AF405 antibodies, respectively. (D) Nuclear shape change was quantified using concavity analysis, which detected an increase in concavity over time. The concave portion of a representative alpha1-oleate–treated nucleus (blue) generated using MATLAB from z-stacks is represented with a green color. Statistical significance was determined by the Kruskal–Wallis test with Dunnett’s multiple comparison test, n = 50 cells. *P < 0.033, ***P < 0.001. (E) Increase in height and decrease in width of nucleus in alpha1-oleate–treated cells were quantified. Statistical significance was determined by mean ± SEM, Mann–Whitney two-tailed analysis, n = 40 cells. ***P < 0.001. (F) Loss of α-tubulin staining in alpha1-oleate–treated cells (unlabeled, 21 μM) for 60 min compared with control. (G) Loss of the dense perinuclear microtubular network and disruption of the remaining filaments with alpha1-oleate treatment. (G) Representative 3D reconstructions shown in (G). The α-tubulin and lamin A/C were visualized using secondary anti-mouse AF488 and anti-rabbit AF647 antibodies, respectively. (H) Quantifications of α-tubulin fluorescence intensity and perinuclear density of α-tubulin. Statistical significance was determined by the mean ± SEM, Mann–Whitney two-tailed analysis, n = 45 cells (total α-tubulin intensity). Data are expressed as the mean ± SEM of three independent experiments, n = 50 cells. Statistical significance was determined by a two-tailed unpaired t test (loss of perinuclear α-tubulin). ***P < 0.001. Scale bar, 2 μm (A, B, D); 15 μm (F); 5 μm (G).
Figure S34.
Figure S34.. Nuclear shape change triggered by alpha1-oleate visualized using lamin A/C staining and 3D reconstructions (supporting images for Fig 6A and B).
(A, B, C, D) Confocal images (maximum intensity projections of the z-stacks) and the corresponding 3D rendering show the change in nuclear shape triggered by alpha1-oleate (unlabeled, 21 μM; (B, C, D)) relative to control (PBS; (A)) using lamin A/C immunofluorescence. The 3D rendering shows the top view (middle panel) and side view (right panel). The lamin A/C staining (blue) was visualized using secondary antibody anti-mouse labeled with AF405. 3D reconstructions were generated using Imaris. Scale bar, 2 μm.
Figure S35.
Figure S35.. More extensive nuclear invaginations triggered by alpha1-oleate compared with a high concentration of oleic acid alone in A549 cells.
(A) Confocal images show the extensive nuclear invaginations (white arrows) indicative of nuclear shape change triggered by alpha1-oleate (unlabeled, 21 μM, 60 min) using lamin A/C immunofluorescence in two different large fields of view. The lamin A/C staining (blue) was visualized using secondary antibody anti-mouse labeled with AF405. Scale bar, 2 μm. (B) Confocal images show fewer nuclear invaginations in a high concentration of oleic acid (500 μM, 4 h)–treated A549 cells in two different large fields of view. (C, D) Control experiments in A549 cells exposed to alpha1-peptide (21 μM) or oleic acid (105 μM) show no characteristic nuclear invaginations as observed in alpha1-oleate–treated cells.
Figure S36.
Figure S36.. Response of inner nuclear membrane–resident protein (SUN1) to alpha1-oleate.
(A, B) Confocal images (maximum intensity projections of the z-stacks) show the change in the cellular distribution of SUN1 (magenta) triggered by alpha1-oleate (unlabeled, 21 μM) relative to control (PBS) in a large field of view. (C, D) 3D rendering of a representative nucleus (indicated with a white box in the large field-of-view image) generated using the fluorescence of SUN1 from cells treated with alpha1-oleate shows the nuclear shape (top view) and the increase in height of the deformed nucleus (side view) compared with control. The SUN1 staining (magenta) was visualized using secondary antibody anti-rabbit labeled with AF647. 3D reconstructions were generated using Imaris. Scale bar, 10 μm (A, B); 2 μm (C, D).
Figure S37.
Figure S37.. Response of inner nuclear membrane–resident protein (SUN2) to alpha1-oleate.
(A, B) Confocal images (maximum intensity projections of the z-stacks) show the change in the cellular distribution of SUN2 (magenta) triggered by alpha1-oleate (unlabeled, 21 μM) relative to control (PBS) in a large field of view. (C, D) 3D rendering of a representative nucleus (indicated with a white box in the large field-of-view image) generated using the fluorescence of SUN2 from cells treated with alpha1-oleate shows the nuclear shape (top view) and the increase in height of the deformed nucleus (side view) compared with control. The SUN2 staining (magenta) was visualized using secondary antibody anti-rabbit labeled with AF647. 3D reconstructions were generated using Imaris. Scale bar, 10 μm (A, B); 2 μm (C, D).
Figure S38.
Figure S38.. Analysis of the nuclear shape change triggered by alpha1-oleate with inner nuclear membrane markers (SUN1 and SUN2).
(A, B) 3D-rendered nuclei of alpha1-oleate–treated cells using Imaris were modeled to an ellipsoid to analyze the change in nuclear shape. The three parameters obtained from ellipsoid modeling of the nucleus were used to describe the shape change quantified. Data are expressed as the mean ± SEM, n = 40 (SUN1), n = 90 cells (SUN2). Statistical significance was determined by a two-tailed Mann–Whitney test. **P < 0.002, ***P < 0.001. 3D reconstructions were generated using Imaris. Scale bar, 2 μm.
Figure S39.
Figure S39.. Co-localization of inner nuclear membrane marker (SUN1/SUN2) with lamin A/C.
(A, B) The confocal images show the distribution of SUN1 (magenta) and lamin A/C (blue) in the nucleus of alpha1-oleate (unlabeled, 21 μM)–treated cell. Quantification of the line scan (white) intensities shows the co-localization of SUN1 and lamin A/C in the novel nuclear invaginations triggered by alpha1-oleate. (C, D) Confocal images show the distribution of SUN2 (magenta) and lamin A/C (blue) in the nucleus of an alpha1-oleate (unlabeled, 21 μM)–treated cell. The line scan (white line) shows the co-localization of SUN2 and lamin A/C in novel nuclear invaginations. The SUN1/SUN2 staining (magenta) and lamin A/C (blue) were visualized using secondary antibody anti-rabbit labeled with AF647 and anti-mouse labeled with AF405, respectively. Scale bar, 2 μm (A, C).
Figure S40.
Figure S40.. Change in microtubule assembly triggered by alpha1-oleate.
(A, B) Confocal images show the loss of α-tubulin fluorescence intensity and the disruption of the microtubular assembly triggered by alpha1-oleate using α-tubulin (green) immunostaining (unlabeled, 21 μM) compared with control (PBS-treated) in a large field of view. Loss of perinuclear dense staining is also observed. (C, D, E) Control experiments in A549 cells exposed to alpha1-peptide (21 μM) or oleic acid (105 μM) show no loss of α-tubulin fluorescence intensity or disruption of the microtubular assembly compared with control (PBS-treated) in a large field of view. Images are shown with the same gain. Quantification is provided in Fig 7H. The α-tubulin and lamin A/C (blue) were visualized using secondary anti-mouse AF488 and anti-rabbit AF647, respectively. Scale bar, 15 μm (A, B); 10 μm (E, F, G).
Figure S41.
Figure S41.. Marginal effect of alpha1-oleate on nesprin-2 cellular distribution.
(A, B) Representative confocal images show the cellular distribution of nesprin-2 (outer nuclear membrane marker) in alpha1-oleate (unlabeled, 21 μM)–treated A549 cells compared with control. (C, D) Representative images of the masked nucleus show nuclear distribution of nesprin-2 along with the lamin A/C invaginations in alpha1-oleate–treated cells compared with control. (E) Quantification of nesprin-2 fluorescence intensity showed a slight decrease in alpha1-oleate–treated A549 cells. Data are expressed as the mean ± SEM, n = 35 cells at least, three independent experiments. Statistical significance was determined by a two-tailed Mann–Whitney test. ***P < 0.001. The nesprin-2 staining (magenta) and lamin A/C (blue) were visualized using secondary antibody anti-rabbit labeled with AF647 and anti-mouse labeled with AF405, respectively. Scale bar, 15 μm (A, B); 2 μm (C, D).

References

    1. Biedzinski S, Agsu G, Vianay B, Delord M, Blanchoin L, Larghero J, Faivre L, Théry M, Brunet S (2020) Microtubules control nuclear shape and gene expression during early stages of hematopoietic differentiation. EMBO J 39: e103957. 10.15252/embj.2019103957 - DOI - PMC - PubMed
    1. Brisuda A, Ho JCS, Kandiyal PS, Ng JT, Ambite I, Butler DSC, Háček J, Wan MLY, Tran TH, Nadeem A, et al. (2021) Bladder cancer therapy using a conformationally fluid tumoricidal peptide complex. Nat Commun 12: 3427. 10.1038/s41467-021-23748-y - DOI - PMC - PubMed
    1. Drozdz MM, Vaux DJ (2017) Shared mechanisms in physiological and pathological nucleoplasmic reticulum formation. Nucleus 8: 34–45. 10.1080/19491034.2016.1252893 - DOI - PMC - PubMed
    1. Düringer C, Hamiche A, Gustafsson L, Kimura H, Svanborg C (2003) HAMLET interacts with histones and chromatin in tumor cell nuclei. J Biol Chem 278: 42131–42135. 10.1074/jbc.M306462200 - DOI - PubMed
    1. Eisenhart C (1947) The assumptions underlying the analysis of variance. Biometrics 3: 1–21. 10.2307/3001534 - DOI - PubMed

LinkOut - more resources