Clinical Trial
. 2025 Mar 25;13(3):e010408.
doi: 10.1136/jitc-2024-010408.

mTOR inhibition modulates vaccine-induced immune responses to generate memory T cells in patients with solid tumors

Affiliations
Clinical Trial

mTOR inhibition modulates vaccine-induced immune responses to generate memory T cells in patients with solid tumors

Henry G Withers et al. J Immunother Cancer. .

Abstract

Background: Perturbation of the mechanistic target of rapamycin (mTOR) pathway can instruct effector versus memory cell fate of tumor antigen-specific T cells in preclinical models. In this study, we sought to understand the impact of rapamycin (sirolimus), an mTOR inhibitor, on reprogramming vaccine-induced T cells to enhance memory responses in patients with solid tumors following completion of their standard therapy.

Methods: We conducted three phase I clinical trials employing New York esophageal squamous cell carcinoma-1 (NY-ESO-1) vaccination approaches, with or without schedule-varied rapamycin. T cell phenotypes, functions, and Vβ usage in peripheral blood were analyzed to ask whether rapamycin influenced the generation of vaccine-induced T cells with memory attributes.

Results: The addition of rapamycin to all vaccination approaches was safe and well tolerated. Immediate (days 1-14 postvaccination) or delayed (days 15-28 postvaccination) administration of rapamycin led to a significant increase in the generation of vaccine-induced NY-ESO-1-specific T cells exhibiting central memory phenotypes (CD45RO+CD45RA- CCR7+). Moreover, delayed administration resulted in a greater than threefold (p=0.025) and eightfold (p=0.005) increase in the frequency of NY-ESO-1-specific CD4+ T and CD8+ T cells respectively at the time of long-term follow-up, compared with its immediate usage.

Conclusion: Our novel finding is that delayed administration of rapamycin to patients during the contraction phase of vaccine-induced antitumor immune responses was particularly effective in increasing the frequency of memory T cells up to 1 year postvaccination in patients with solid tumors. Further studies are warranted to identify the impact of this approach on the durability of clinical remission.

Trial registration number: NCT00803569, NCT01536054, NCT01522820.

Keywords: Immunotherapy; Memory; Ovarian Cancer; T cell; Vaccine.


Conflict of interest statement

Competing interests: KO and RK are co-founders of Tactiva Therapeutics. The other authors have declared no conflict of interest exists.

Figures

Figure 1
Figure 1. NY-ESO-1 peptide-induced activation of T cells and tetramer frequency in ALVAC-TRICOM-treated patients. PBMC-isolated CD4+ (A) and CD8+ (B) T cell NY-ESO-1-specific activation, reported as IFN-γ spots per 5×10⁴ cells obtained in ELISpot assays after incubation with individual or pooled 20mer overlapping NY-ESO-1 peptides in ALVAC-TRICOM trials. The maximum number of normalized IFN-γ spots obtained for each patient at prevaccination (green), postvaccination (red), or follow-up (blue) binned time points are reported. All boxplots display the first quartile, third quartile, and median. (C–E) Isolated CD8+ T cells were presensitized in vitro with a pool of NY-ESO-1 overlapping peptides for 12–14 days and stained with anti-CD8 antibody along with HLA-A*0201/NY-ESO-1157–165 and HLA-A*0201/Influenza M158–66 tetramers from HLA-A*0201+ patients (C), HLA-Cw*03/NY-ESO-192–100 and HLA-Cw*03/NY-ESO-194–106 tetramers from HLA-Cw*03+ patients (D), or HLA-B*3501/NY-ESO-192–100, HLA-B*3501/NY-ESO-194–102 and HLA-B*3501/NY-ESO-194–104 tetramers from HLA-B*3501+ patients (E). The representative flow cytometry plot of each tetramer and the change of tetramer frequency for each patient are shown. NY-ESO-1, New York esophageal squamous cell carcinoma-1; PBMC, peripheral blood mononuclear cell; TRICOM, the TRIad of CO-stimulatory Molecules.
Figure 2
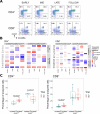
Figure 2. NY-ESO-1 ALVAC-TRICOM vaccination in combination with rapamycin shifts memory T cell populations. (A) Representative flow cytometry scatterplots for CD45RA and CCR7 expression on CD4+ and CD8+ T cells from patient BD at different time points. (B) Patient-specific heatmaps of relative changes in CD4+ and CD8+ central memory (CD45RO+CD45RACCR7+) and effector memory (CD45RO+CD45RACCR7) cell populations relative to baseline, as determined by flow cytometry from available patient samples throughout the ALVAC-TRICOM±rapamycin trials. (C) Comparison of T cell memory populations between vaccination Trial A and Trial B using all postvaccination samples (p value is calculated using ANOVA with post hoc Tukey). Boxplots represent the first quartile, median, and third quartile. ANOVA, analysis of variance; NY-ESO-1, New York esophageal squamous cell carcinoma-1; TRICOM, the TRIad of CO-stimulatory Molecules.
Figure 3
Figure 3. NY-ESO-1 humoral response in ALVAC-TRICOM treated patients. (A) Time-course analysis of serum NY-ESO-1 mean reciprocal antibody titers determined by ELISA relative fluorescence of serially diluted samples at baseline, early, mid, late, and follow-up time groups for ALVAC-TRICOM±rapamycin clinical trials (* indicates p<0.05, linear regression model), including a heatmap of patient-specific mean antibody titers. Thresholds for seropositivity are indicated by a red outline and boosted seropositivity is indicated by purple. An empty cell indicates sample collection was not available at that time point. (B) The maximum fold change of NY-ESO-1 mean reciprocal antibody titer achieved per patient in Trial A (without rapamycin) versus Trial B (with rapamycin), with boxplots representing the first quartile, median, and third quartile (p=0.121, student t-test). Ab, antibody; NY-ESO-1, New York esophageal squamous cell carcinoma-1; TRICOM, the TRIad of CO-stimulatory Molecules.
Figure 4
Figure 4. Characterization of NY-ESO-1 specific immune responses in patients treated with DC+CDX-1401, with and without rapamycin. (A) PBMC-isolated CD4+ and CD8+ T cell NY-ESO-1-specific activation, reported as IFNγ spots per 5×10⁴ cells in ELISpot assays, after incubation with individual or pooled overlapping NY-ESO-1 peptides in DC+CDX-1401 trials (Trial C2 with rapamycin, and Trial C1 without rapamycin). The highest number of normalized IFNγ spots obtained for each patient at prevaccination (green), postvaccination (red), or follow-up (blue) binned time points are presented. A comparison of CD8+ (B) and CD4+ (C) T cell central memory (CD45RO+CD45RACCR7+) and effector memory (CD45RO+CD45RACCR7) populations between Trial C1 and Trial C2 for all postvaccination samples collected (ANOVA with post hoc Tukey). (D) Patient-specific heatmaps show the relative changes in CD4+ and CD8+ central memory (CD45RO+CD45RACCR7+) and effector memory (CD45RO+CD45RACCR7) cell populations relative to baseline, as determined by flow cytometry from available patient samples throughout the trials. The NY-ESO-1 pooled peptide ELISpot assay of CD4+ (E) and CD8+ (F) T cells for all follow-up samples collected at 6 and 12 months (green and red, respectively) in DC+CDX-1401 trials is grouped by rapamycin treatment regimens (ANOVA with post hoc Tukey; *p value<0.05, **p value<0.01). All boxplots represent the first quartile, median, and third quartile. ANOVA, analysis of variance; DC, dendritic cell; NY-ESO-1, New York esophageal squamous cell carcinoma-1; PBMC, peripheral blood mononuclear cell.
Figure 5
Figure 5. NY-ESO-1-induced cytokine production in CD4+ and CD8+ T cells. Intracellular staining of immune-modulating cytokine in PBMC-isolated CD4+ and CD8+ T cells that were presensitized with autologous NY-ESO-1 peptide-pulsed, CD4+/CD8+ depleted cells. The results were reported as the percentage of staining cells normalized to unpulsed controls in either (A) ALVAC-TRICOM trials (Trials A and B) or (B) DC+CDX-1401 trials (Trials C1 and C2) across all time points of sample collection. Statistical significance was assessed using ANOVA with post hoc Tukey (*p<0.05, **p<0.01). Boxplots represent the first quartile, median, and third quartile. ANOVA, analysis of variance; DC, dendritic cell; GM-CSF, granulocyte macrophage-colony stimulating factor; IL2, interleukin 2; NY-ESO-1, New York esophageal squamous cell carcinoma-1; PBMC, peripheral blood mononuclear cell; TRICOM, the TRIad of CO-stimulatory Molecules.
Figure 6
Figure 6. Landscape of TCRβ-CDR3 repertoire on NY-ESO-1 vaccination. (A) Sample preparation for TCRβ-CDR3 sequencing. CD4+ and CD8+ T cells were isolated from PBMCs and presensitized with a pool of NY-ESO-1 overlapping peptides, prior to TCRβ-CDR3 sequencing of both the CD4+/CD8+ populations and PBMCs. (B) Differential abundance of CDR3 clones in PBMC versus the NY-ESO-1 peptide-stimulated and expanded CD4+ T cell pool for a single representative patient and time point. Red points indicate de novo clonotypes identified exclusively in the activated CD4+ T cell repertoire, whereas pink points denote clonotypes present in both the PBMC and CD4+ T cell repertoires. (C) A Venn diagram illustrates the total number of unique NY-ESO-1 reactive CDR3 clones in CD4+ and CD8+ T cells, including the percentage of de novo clones absent in the PBMCs. (D) A CDR3 nucleotide sequence edit distance with a maximum threshold of 10 was used to determine clonal relatedness within samples between the total repertoire and the NY-ESO-1-activated clonal repertoire only. (E) A comparison of VDJ usage between NY-ESO-1 reactive clonotypes (orange) and the total clonotypes (gray) using Circos plots, which identify common VDJ usage patterns in both reactive and total clonotypes. NY-ESO-1, New York esophageal squamous cell carcinoma-1; PBMC, peripheral blood mononuclear cell; TCR, T-cell receptor; VDJ, variable-diversity-joining gene segments.
Figure 7
Figure 7. Evolution of the TCRβ-CDR3 repertoire on NY-ESO-1 vaccination. (A) The Morisita-Horn (MH) index as a measure of intrapatient and interpatient similarity of PBMC CDR3 repertoires (orange and green, respectively). (B) The cumulative frequency of reactive clonotypes in PBMC over time, identified in CD8+ NY-ESO-1 reactive T cell pools. (C) The MH similarity matrix comparing peripheral CDR3 repertoires across patients and time points in ALVAC-TRICOM trials (top) and DC+CDX-1401 trials (bottom). (D) Representative patient-specific MH similarity matrices showing distinct patterns of CDR3 repertoire evolution in PBMC over the course of clinical trials (left—no evolution; middle—early evolution; right—progressive evolution). DC, dendritic cell; NY-ESO-1, New York esophageal squamous cell carcinoma-1; PBMC, peripheral blood mononuclear cell; TRICOM, the TRIad of CO-stimulatory Molecules.

References

    1. Tang L, Huang Z, Mei H, et al. Immunotherapy in hematologic malignancies: achievements, challenges and future prospects. Signal Transduct Target Ther. 2023;8:306. doi: 10.1038/s41392-023-01521-5. - DOI - PMC - PubMed
    1. Disis ML, Taylor MH, Kelly K, et al. Efficacy and Safety of Avelumab for Patients With Recurrent or Refractory Ovarian Cancer: Phase 1b Results From the JAVELIN Solid Tumor Trial. JAMA Oncol. 2019;5:393–401. doi: 10.1001/jamaoncol.2018.6258. - DOI - PMC - PubMed
    1. Moore KN, Bookman M, Sehouli J, et al. Atezolizumab, Bevacizumab, and Chemotherapy for Newly Diagnosed Stage III or IV Ovarian Cancer: Placebo-Controlled Randomized Phase III Trial (IMagyn050/GOG 3015/ENGOT-OV39) J Clin Oncol. 2021;39:1842–55. doi: 10.1200/JCO.21.00306. - DOI - PMC - PubMed
    1. Ribas A, Wolchok JD. Cancer immunotherapy using checkpoint blockade. Science. 2018;359:1350–5. doi: 10.1126/science.aar4060. - DOI - PMC - PubMed
    1. Ahluwalia MS, Reardon DA, Abad AP, et al. Phase IIa Study of SurVaxM Plus Adjuvant Temozolomide for Newly Diagnosed Glioblastoma. J Clin Oncol. 2023;41:1453–65. doi: 10.1200/JCO.22.00996. - DOI - PMC - PubMed

Publication types

MeSH terms

Associated data