. 2025 Mar 25;16(1):2911.
doi: 10.1038/s41467-025-56756-3.

Performance of plasma biomarkers for diagnosis and prediction of dementia in a Brazilian cohort

Affiliations

Performance of plasma biomarkers for diagnosis and prediction of dementia in a Brazilian cohort

Luis E Santos et al. Nat Commun. .

Abstract

Despite remarkable progress in the biomarker field in recent years, local validation of plasma biomarkers of Alzheimer's disease (AD) and dementia is still lacking in Latin America. In this longitudinal cohort study of 145 elderly Brazilians, we assess the diagnostic performance of plasma biomarkers, based on clinical diagnosis and CSF biomarker positivity. Follow-up data of up to 4.7 years were used to determine performance in predicting diagnostic conversions. Participants were clinically categorized as cognitively unimpaired (n = 49), amnestic mild cognitive impairment (n = 29), AD (n = 38), Lewy body dementia (n = 22), or vascular dementia (n = 7). Plasma Tau, Aβ40, Aβ42, NfL, GFAP, pTau231, pTau181 and pTau217 were measured on the SIMOA HD-X platform. Plasma pTau217 showed excellent performance determining CSF biomarker status in the cohort, either alone (ROC AUC = 0.94, 95% CI: [0.88-1.00]) or as a ratio to Aβ42 (ROC AUC = 0.98, 95% CI: [0.94-1.00]). This study comprises an initial step towards local validation and adoption of dementia biomarkers in Brazil.


Conflict of interest statement

Competing interests: The authors declare no conflicts of interest.

Figures

Fig. 1
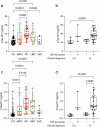
Fig. 1. Plasma NfL, tTau, and GFAP levels across clinical diagnoses.
In each graph, boxplots show median, 25th percentile, 75th percentile, and range. Plasma biomarker data across clinical diagnoses (N = 145) is shown for NfL (a), tTau (b), and GFAP (c). Analysis of a subset of participants with CSF biomarker data available (N = 52) shows levels of plasma NfL (d), t-Tau (e), and GFAP (f) stratified by cognitive and CSF biomarker status. (Kruskal-Wallis test followed by Dunn’s multiple comparisons test; significant p-values are shown).
Fig. 2
Fig. 2. Plasma pTau181 and pTau217 levels across clinical diagnoses.
In each graph, boxplots show median, 25th percentile, 75th percentile, and range. Plasma pTau181 and pTau217 levels are shown across clinical diagnoses (N = 145; a, c) and stratified by cognitive and CSF biomarker status (N = 52; b, d). (Kruskal-Wallis test followed by Dunn’s multiple comparisons test; significant p-values are shown).
Fig. 3
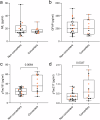
Fig. 3. Performance of plasma biomarkers in predicting diagnostic conversions.
In each graph, boxplots show median, 25th percentile, 75th percentile, and range. Levels of NfL (a), GFAP (b), pTau181 (c), and pTau217 (d) are shown for converters and non-converters (N = 36). Initial diagnoses are represented by colors, with black dots for CU and orange dots for aMCI participants (Two-tailed Mann-Whitney test; significant p-values are shown).
Fig. 4
Fig. 4. Plasma Aβ42 / Aβ40, pTau181 / Aβ42, and pTau217 / Aβ42 ratios across clinical diagnoses.
In each graph, boxplots show median, 25th percentile, 75th percentile, and range. Plasma Aβ42 / Aβ40 ratios are shown for all included participants across clinical diagnoses (N = 145; a) and stratified by cognitive and CSF biomarker status (N = 52; d). The same is shown for pTau181 / Aβ42 (b, e), and pTau217 / Aβ42 ratios (c, f). (Kruskal-Wallis test followed by Dunn’s multiple comparisons test; significant p-values are shown).
Fig. 5
Fig. 5. Diagnostic performance of plasma biomarkers.
Forest plots comparing ROC AUCs are shown for all plasma biomarkers when discriminating participants in the following groups: CSF-biomarker-negative x CSF-biomarker-positive (N = 52; a), CU x CI (N = 145; b), CU x all-cause dementia (N = 116; c), and AD x other dementias (N = 67; d). For each panel, chance levels are indicated by a dotted line (ROC AUC = 0.5) and the AUC of the best-performing biomarker is indicated by a dashed blue line. Error bars represent 95% confidence intervals.
Fig. 6
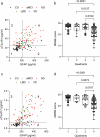
Fig. 6. Relationship between plasma pTau and GFAP levels with cognitive performance.
Scatter plots of plasma pTau181 (a) and pTau217 (c) against plasma GFAP levels are shown for all included participants (N = 145). Diagnoses are represented by colors, as indicated in the images, and the cutoff values of 25.38 pg/ml for pTau181; 0.29 pg/ml for pTau217; and 201.9 pg/ml for GFAP (defined by the ROC analyzes shown in Fig. 5C) are represented by dashed lines, dividing the sample into four quadrants. Available MMSE scores (N = 127) for participants in each of the four quadrants of the pTau181 x GFAP and pTau217 x GFAP graphs are shown in (b) and (d), respectively. Boxplots in (b) and (d) show median, 25th percentile, 75th percentile, and range. (Kruskal-Wallis test followed by Dunn’s multiple comparisons test; significant p-values are shown).

References

    1. Prince, M. et al. The global prevalence of dementia: a systematic review and metaanalysis. Alzheimer’s. Dement9, 63 (2013). - PubMed
    1. Baez, S. & Ibáñez, A. Dementia in Latin America: an emergent silent tsunami. Front Aging Neurosci.8, 253 (2016). - PMC - PubMed
    1. IBGE. Censo Demográfico 2022. https://agenciadenoticias.ibge.gov.br/agencia-noticias/2012-agencia-de-n... (2023).
    1. van Dyck, C. H. et al. Lecanemab in early Alzheimer’s disease. N. Engl. J. Med. 388, 9–21 (2023). - PubMed
    1. Karikari, T. K. et al. Blood phospho-tau in Alzheimer disease: analysis, interpretation, and clinical utility. Nat. Rev. Neurol.18, 400–418 (2022). - PubMed

MeSH terms