. 2025 Mar 25;16(1):2913.
doi: 10.1038/s41467-025-58152-3.

Leveraging large-scale biobank EHRs to enhance pharmacogenetics of cardiometabolic disease medications

Affiliations

Leveraging large-scale biobank EHRs to enhance pharmacogenetics of cardiometabolic disease medications

Marie C Sadler et al. Nat Commun. .

Abstract

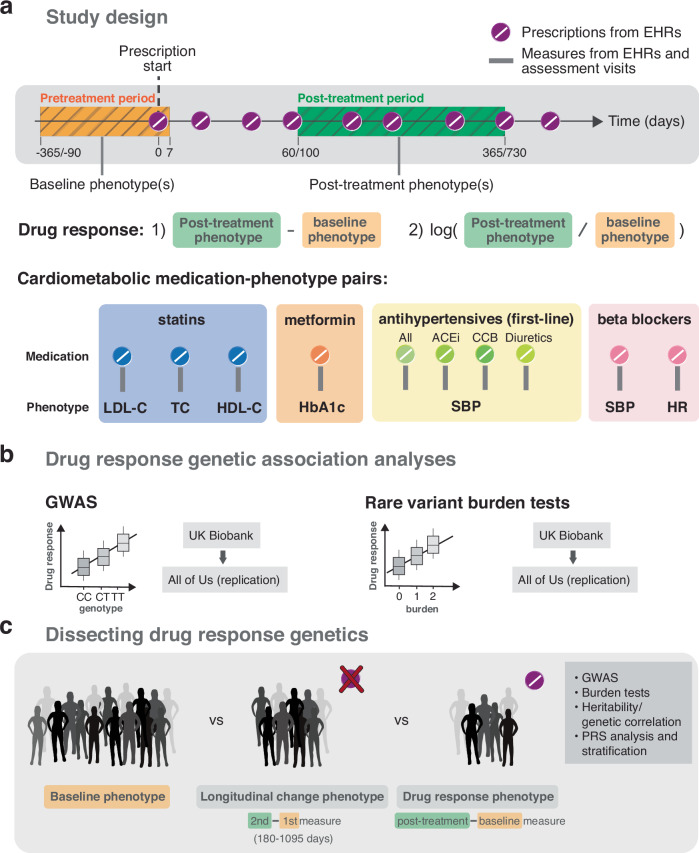
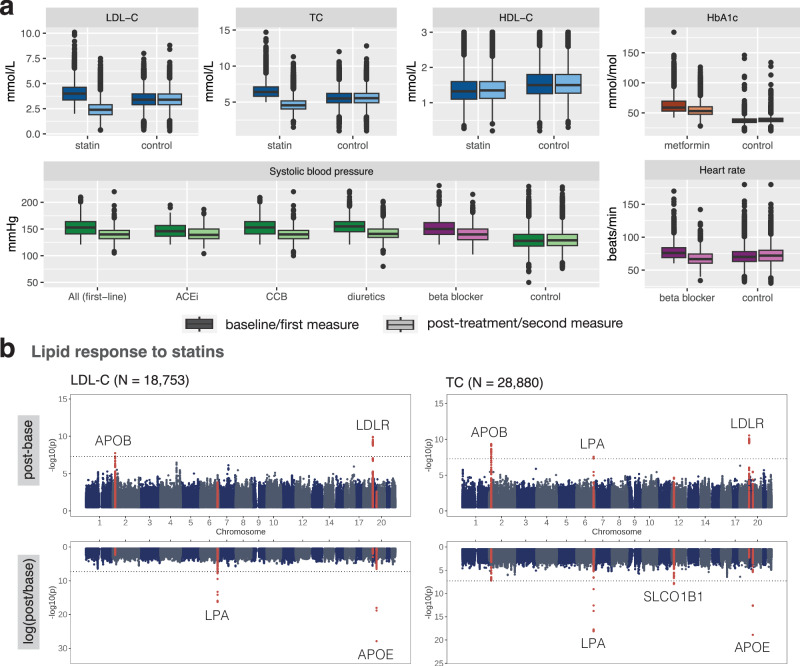
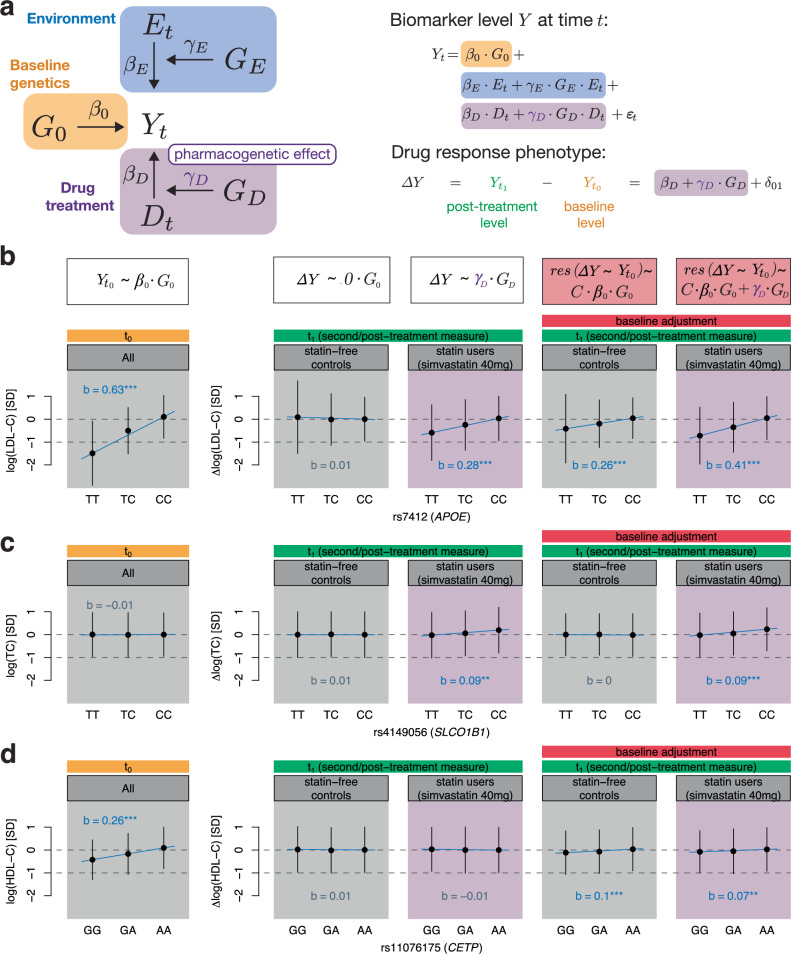
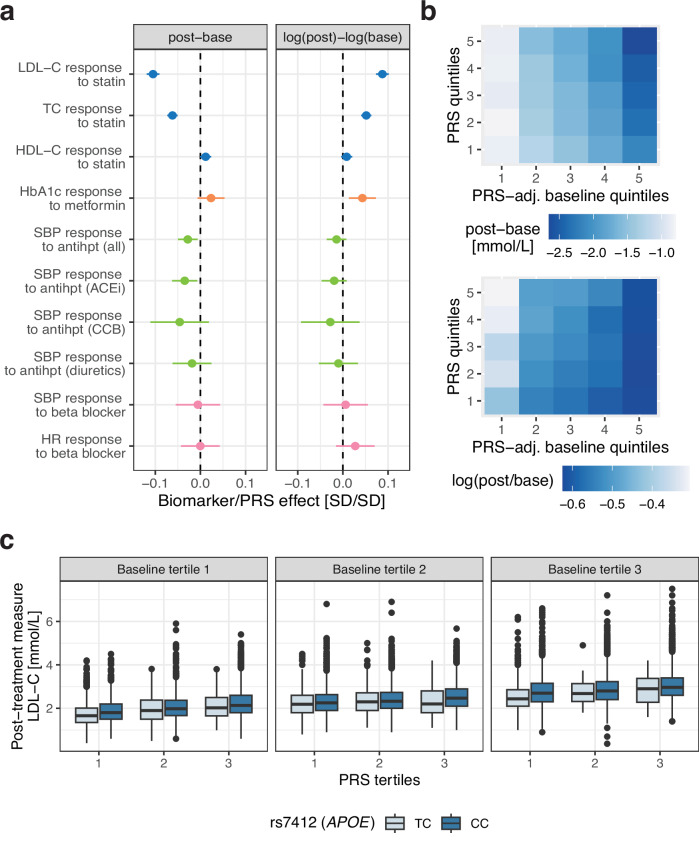
Electronic health records (EHRs) coupled with large-scale biobanks offer great promises to unravel the genetic underpinnings of treatment efficacy. However, medication-induced biomarker trajectories stemming from such records remain poorly studied. Here, we extract clinical and medication prescription data from EHRs and conduct GWAS and rare variant burden tests in the UK Biobank (discovery) and the All of Us program (replication) on ten cardiometabolic drug response outcomes including lipid response to statins, HbA1c response to metformin and blood pressure response to antihypertensives (N = 932-28,880). Our discovery analyses in participants of European ancestry recover previously reported pharmacogenetic signals at genome-wide significance level (APOE, LPA and SLCO1B1) and a novel rare variant association in GIMAP5 with HbA1c response to metformin. Importantly, these associations are treatment-specific and not associated with biomarker progression in medication-naive individuals. We also found polygenic risk scores to predict drug response, though they explained less than 2% of the variance. In summary, we present an EHR-based framework to study the genetics of drug response and systematically investigated the common and rare pharmacogenetic contribution to cardiometabolic drug response phenotypes in 41,732 UK Biobank and 14,277 All of Us participants.


Conflict of interest statement

Competing interests: MCS has been consulting for 5 Prime Sciences at the time of the submission; however, this study was performed separately with no relationship to 5 Prime Sciences. The results and opinions expressed in this paper do not represent those of 5 Prime Sciences. The other authors declare that they have no competing interests.

Figures

Fig. 1
Fig. 1. Study design.
a Drug response study design using electronic health records (EHRs) from the UK and All of Us biobanks. Baseline (orange) and post-treatment (green) phenotypes were extracted from EHRs or biobank assessment visits before and after the first recorded prescription, respectively. Different timings relative to the first prescription were tested as well as the use of single and average values over multiple baseline and post-treatment measures if available. Drug response phenotypes defined by the 1) absolute and 2) relative logarithmic difference in post-treatment and baseline biomarker measures were tested for ten cardiometabolic medication-phenotype pairs: LDL cholesterol (LDL-C), total cholesterol (TC) and HDL cholesterol (HDL-C) response to statins (blue); HbA1c response to metformin (orange); systolic blood pressure (SBP) response to antihypertensives (green, ACE-inhibitors (ACEi), calcium channel blockers (CCBs) and diuretics); SBP and heart rate (HR) response to beta blockers (purple). b Discovery genetic association analyses were conducted in the UK Biobank and replicated in the All of Us research program on common variants (GWAS analysis) and rare variants through burden tests. c Follow-up analyses compared the genetics of baseline, longitudinal change and drug response genetics including polygenic risk score (PRS) analysis.
Fig. 2
Fig. 2. EHR drug response phenotypes and PGx GWAS results derived from the UKBB.
a Baseline and post-treatment biomarker levels of statin (blue), metformin (orange), first-line antihypertensives (green) and beta blocker (purple) medication users as well as first and second measures of controls who do not take any related medications. Boxes bound the 25th, 50th (median, centre), and the 75th quantile of LDL-C post-treatment measures. Whiskers range from minima (Q1 - 1.5*IQR) to maxima (Q3 + 1.5*IQR) with points above or below representing potential outliers. Drug response sample sizes are in Supplementary Data 4 and control sample sizes in Supplementary Data 7. LDL cholesterol (LDL-C); total cholesterol (TC); HDL cholesterol (HDL-C); ACE-inhibitor (ACEi); calcium channel blocker (CCB). b Manhattan plots of LDL-C and TC response to statins. GWAS association results of the top and bottom show the absolute and logarithmic relative biomarker differences, respectively. GWAS were performed using a linear additive model, with a two-sided test of association. Loci with genome-wide significant signals (p-value  < 5e−8) for either the absolute or relative difference are highlighted in red. All loci are annotated with the closest gene and the horizontal line denotes genome-wide significance (p-value  < 5e−8). Results in (a) and (b) correspond to the lenient filtering setting with average values over multiple measures, if available.
Fig. 3
Fig. 3. Modelling longitudinal changes of biomarker levels with (or without) treatment effect.
a Biomarker levels Y at time t can be influenced by baseline genetics G0 (orange), environment E and gene-environment interactions (GE ⋅ E, blue), and drug status D and pharmacogenetic interactions (GD ⋅ D, purple). Drug response phenotypes modelled as the difference of post-treatment (t1) and baseline (t0) levels allow the estimation of the pharmacogenetic effect γD through genetic regression analyses (Supplementary Note 1). bd Stratification at genetic variants that harbour pharmacogenetic γD (b, c) and/or baseline β0 (b, d) genetic effects. Adjusting drug response or longitudinal change phenotypes for baseline induces a bias that scales with C ⋅ β0 where C equals 1(βE2+γE2)corr(Et,E0) (Supplementary Note 1, red). Thus, variants with significant baseline effects spuriously associate with drug response phenotypes even if γD is zero (d). Such measure of change, however, shows association in drug-naive individuals too. The baseline panel (t0) groups statin-free controls and statin users (simvastatin 40mg corresponding to the largest starting statin type-dose group), and shows their sex and age-adjusted standardized baseline level stratified by genotype. The following four panels (t1) show standardized longitudinal change (drug-naive individuals) and drug response phenotypes (statin users) adjusted for sex and age, once unadjusted (correct model) and adjusted (biased model) for baseline levels. Genotype regression coefficients (denoted with b) with baseline lipid levels, longitudinal change and drug response phenotypes were derived through regression of the standardized outcome measures on the genotype dosage adjusted for sex and age as well as baseline levels if indicated. The significance level of the slope (b) is indicated by colour and stars where grey indicates a p-value  > 0.05, blue a p-value ≤ 0.05, 2 stars a p-value  < 1e−3 and 3 stars a p-value  < 5e−8 (two-sided test statistics). Dots correspond to the mean and error bars to the standard deviation of covariate-adjusted baseline levels and drug response/longitudinal change phenotypes in each stratified group (numbers of individuals per stratum are shown in Supplementary Data 12). LDL cholesterol (LDL-C); total cholesterol (TC); HDL cholesterol (HDL-C).
Fig. 4
Fig. 4. Drug response phenotype associations with polygenic risk scores (PRS).
a Drug response associations with PRS calculated for the absolute (post-base) and logarithmic relative (log(post)-log(base)) biomarker difference colour-coded by the drug (blue: statins, orange: metformin, green: antihypertensives, purple: beta blockers). Standardized effect sizes (biomarker/PRS effect) correspond to an SD change for 1SD increase in PRS. A negative sign means that increased PRS increases treatment efficacy (i.e., larger biomarker difference compared to low PRS). All associations are adjusted for sex, age and drug-specific covariates. The center of the error bars corresponds to the linear regression association estimate, and the error bars represent the 95% confidence intervals calculated in each drug response cohort (sample sizes in Supplementary Data 4). LDL cholesterol (LDL-C); total cholesterol (TC); HDL cholesterol (HDL-C); systolic blood pressure (SBP); heart rate (HR); ACE-inhibitor (ACEi); calcium channel blocker (CCB). b Statin users stratified by 1) LDL-C baseline levels adjusted for LDL-C PRS and 2) LDL-C PRS quintiles with each tile showing the average LDL-C biomarker response (top: absolute, bottom: relative difference). Darker blue values correspond to stronger biomarker reductions. c Statin users stratified by 1) LDL-C baseline levels, 2) LDL-C PRS and 3) rs7412 genotype (individuals with the TT genotype are omitted as their sample size was too low). Boxes bound the 25th, 50th (median, centre), and the 75th quantile of LDL-C post-treatment measures. Whiskers range from minima (Q1 - 1.5*IQR) to maxima (Q3 + 1.5*IQR) with points above or below representing potential outliers. Numerical values and sample sizes in each stratum are shown in Supplementary Data 18.

Update of

References

    1. McInnes, G., Yee, SookWah, Pershad, Y. & Altman, R. B. Genomewide association studies in pharmacogenomics. Clin. Pharmacol. Therapeutics110, 637–648 (2021). - PMC - PubMed
    1. Nelson, M. R. et al. The genetics of drug efficacy: opportunities and challenges. Nat. Rev. Genet.17, 197–206 (2016). - PubMed
    1. Pirmohamed, M. Pharmacogenomics: current status and future perspectives. Nat. Rev. Genet.24, 350–362 (2023). - PubMed
    1. Postmus, I. et al. Pharmacogenetic meta-analysis of genome-wide association studies of LDL cholesterol response to statins. Nat. Commun.5, 5068 (2014). - PMC - PubMed
    1. Oni-Orisan, A. et al. Characterization of statin low-density lipoprotein cholesterol dose-response using electronic health records in a large population-based cohort. Circulation: Genom. Precis. Med.11, e002043 (2018). - PMC - PubMed

Substances

LinkOut - more resources