. 2025 Mar 25;16(1):2933.
doi: 10.1038/s41467-025-58214-6.

Enhanced diagnosis of multi-drug-resistant microbes using group association modeling and machine learning

Affiliations

Enhanced diagnosis of multi-drug-resistant microbes using group association modeling and machine learning

Julian G Saliba et al. Nat Commun. .

Abstract

New solutions are needed to detect genotype-phenotype associations involved in microbial drug resistance. Herein, we describe a Group Association Model (GAM) that accurately identifies genetic variants linked to drug resistance and mitigates false-positive cross-resistance artifacts without prior knowledge. GAM analysis of 7,179 Mycobacterium tuberculosis (Mtb) isolates identifies gene targets for all analyzed drugs, revealing comparable performance but fewer cross-resistance artifacts than World Health Organization (WHO) mutation catalogue approach, which requires expert rules and precedents. GAM also reveals generalizability, demonstrating high predictive accuracy with 3,942 S. aureus isolates. GAM refinement by machine learning (ML) improves predictive accuracy with small or incomplete datasets. These findings were validated using 427 Mtb isolates from three sites, where GAM inputs are also found to be more suitable in ML prediction models than WHO inputs. GAM + ML could thus address the limitations of current drug resistance prediction methods to improve treatment decisions for drug-resistant microbial infections.


Conflict of interest statement

Competing interests: The authors declare no competing interests.

Figures

Fig. 1
Fig. 1. GAM + ML workflow summary.
a Genotyping and minimum inhibitory concentration (MIC) culture analysis for drug susceptibility testing (DST) phenotypes of Mtb isolates. b Data filtration via genotype and phenotype information. c Mtb isolate sequence and DST data are fed into GAM to identify mutations associated with drug resistance, after which GAM classification performance is evaluated using statistical metrics. d Machine learning is applied to SNPs that GAM classifies as being associated with drug resistance to predict drug resistance profiles. e Multi-site cross-validation is performed to characterize the utility of this GAM + ML prediction approach. Created in BioRender.
Fig. 2
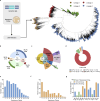
Fig. 2. Summary of the GAM process and groups associated with specific drug resistance profiles.
a GAM scheme and phylogenetic tree of DS2 isolates. b DS2 percentages derived from each lineage of all CRyPTIC isolates. Created in BioRender. c Number of isolates in groups containing multiple (Test/Control) or single (Non-Test) isolates. Mono-resistant (Mono), MDR/RR, Pre-XDR, XDR, Poly (RIF susceptible but resistant to ≥2 other drugs), and INH S (RIF + INH susceptible but resistant to ≥2 other drugs). d Group size ranges in size-ranked drug-resistant group quartiles. e Number of DS2 groups resistant to one or more drugs. f Mean number of isolates in groups resistant to one or more drugs. g Specific drug resistance frequencies in all drug-resistant DS2 groups. Source data are provided as a Source Data file.
Fig. 3
Fig. 3. GAM and LMM detection of drug resistance associations.
a GAM workflow for data grouping and association. b Gene level interpretations of DNA variants associated with specific drug resistance as calculated by Fisher’s exact test, indicating the significance threshold (dashed line; -log10p-value < 5.22) determined after Bonferroni correction for multiple tests. c Gene-drug interactions detected by both LMM and GAM (orange), LMM alone (blue), or neither (white), using associations in the top 20 LMM associations for each drug. d Co-occurrence of DS2 drug-resistant phenotypes, where dark and light green indicates high and low percent overlap, respectively. e True positive, (f) false positive, (g) false negative mutations found by GWAS LMM (blue) and GAM (red). Source data are provided as a Source Data file.
Fig. 4
Fig. 4. Optimization of variant detection as predictors for drug resistance.
a Schematic comparing prior knowledge requirements and accuracy of different approaches. b Boxplot of GAM + ML classification accuracy across model runs (N = 10), each using a different random test set and seed. Data depict median (center bar), 25th and 75th percentile (lower and upper box bounds), and minimum and maximum values (lower and upper whiskers). P-values were calculated from repeat measure 1-way ANOVAs, followed by Dunnett’s test for multiple comparisons, comparing the results to a Gradient Boosting reference model. c Workflow of the ML model using GAM variants as input. Calculated (d) PPV, (e) specificity, and (f) sensitivity (error bars indicate two-sided 95% confidence intervals) of predictive approaches applied to DS1 for specific drug resistance using variants identified by GAM (blue); 2021 (yellow) and 2023 (green) WHO interim criteria; and a gradient boosting model using GAM variants (red). Sample sizes for these comparisons varied according to the number of Mtb isolates with phenotype data for AMI (n = 10027), EMB (n = 8911), ETH (n = 9356), INH (n = 10025), KAN (n = 10085), LEV (n = 10114), MXF (n = 10139), and RIF (n = 10052). Source data are provided as a Source Data file.
Fig. 5
Fig. 5. Effect of sample size and DST data incompleteness on GAM and ML-GAM outputs.
a Effect of sample size on GAM and LMM true positive (TP) and false positive (FP) gene identifications. Y-axis breaks between 20 and 200. b Heatmap of mean PPV from model runs, each using a different random test set and seed (N = 10), for GAM and LMM for varying sample sizes. c Effect of missing data on GAM performance. a, c Solid and dashed lines represent nonlinear sigmoidal curves and their two-sided 95% confidence intervals, respectively. Data points display mean ± standard error values from model runs, each using a different random test set and seed (N = 10). d ML-GAM workflow for datasets with missing data. e ML training set size effect on GAM accuracy, indicating median (central line) and minimum and maximum range (box boundaries), and p-value from a 1-way ANOVA with Tukey’s multiple comparison test from model runs, each using a different random test set and seed (N = 30). f Effect of missing data on accurate GAM gene identification after adjusting data with ML models trained with different sample sizes, where the remaining samples are analyzed as the GAM test samples. Solid and dashed lines represent nonlinear sigmoidal curves and their two-sided 95% confidence intervals, respectively. Data points display mean ± standard error values from model runs, each using a different random test set and seed (N = 5). Source data are provided as a Source Data file.
Fig. 6
Fig. 6. GAM vs WHO ML model accuracy for drug resistance prediction in 427 Mtb isolates.
a Mtb isolates from three hospital sites in China were analyzed by drug susceptibility testing and sequenced to identify variant sequences. Created in BioRender. bi Pair-matched model accuracy for isolates resistant to eight drug targets as assessed across N = 10 random seeds and analyzed by 1-way ANOVAs with Geisser-Greenhouse corrections and Dunnett’s tests for multiple comparisons. The number of isolates used for these comparisons varied according to the number of isolates with phenotype data for (b) amikacin (n = 427), (c) ethambutol (n = 423), (d) ethionamide (n = 421), (e) isoniazid (n = 352), (f) kanamycin (n = 427), (g) levofloxacin (n = 112), (h) moxifloxacin (n = 415), and (i) rifampicin (n = 185) susceptibility tests. Source data are provided as a Source Data file.

Similar articles

Cited by

References

    1. Cohen, M. L. Epidemiology of drug resistance: implications for a post-antimicrobial era. Science257, 1050–1055 (1992). - PubMed
    1. Alanis, A. J. Resistance to antibiotics: are we in the post-antibiotic era? Arch. Med. Res.36, 697–705 (2005). - PubMed
    1. Michael, C. A., Dominey-Howes, D. & Labbate, M. The antimicrobial resistance crisis: causes, consequences, and management. Front. Public. Health2, 145 (2014). - PMC - PubMed
    1. Mazel, D. & Davies, J. Antibiotic resistance in microbes. Cell. Mol. Life Sci.56, 742–754 (1999). - PMC - PubMed
    1. Rowneki, M. et al. Detection of drug resistant Mycobacterium tuberculosis by high-throughput sequencing of DNA isolated from acid fast bacilli smears. PLoS One15, e0232343 (2020). - PMC - PubMed

MeSH terms

Substances

LinkOut - more resources