. 2025 Mar 25;16(1):2890.
doi: 10.1038/s41467-025-58032-w.

Identification of a SNAI1 enhancer RNA that drives cancer cell plasticity

Affiliations

Identification of a SNAI1 enhancer RNA that drives cancer cell plasticity

Chuannan Fan et al. Nat Commun. .

Abstract

Enhancer RNAs (eRNAs) are a pivotal class of enhancer-derived non-coding RNAs that drive gene expression. Here we identify the SNAI1 enhancer RNA (SNAI1e; SCREEM2) as a key activator of SNAI1 expression and a potent enforcer of transforming growth factor-β (TGF-β)/SMAD signaling in cancer cells. SNAI1e depletion impairs TGF-β-induced epithelial-mesenchymal transition (EMT), migration, in vivo extravasation, stemness, and chemotherapy resistance in breast cancer cells. SNAI1e functions as an eRNA to cis-regulate SNAI1 enhancer activity by binding to and strengthening the enrichment of the transcriptional co-activator bromodomain containing protein 4 (BRD4) at the local enhancer. SNAI1e selectively promotes the expression of SNAI1, which encodes the EMT transcription factor SNAI1. Furthermore, we reveal that SNAI1 interacts with and anchors the inhibitory SMAD7 in the nucleus, and thereby prevents TGF-β type I receptor (TβRI) polyubiquitination and proteasomal degradation. Our findings establish SNAI1e as a critical driver of SNAI1 expression and TGF-β-induced cell plasticity.


Conflict of interest statement

Competing interests: The authors declare no competing interests.

Figures
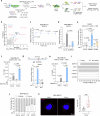
Fig. 1
Fig. 1. TGF-β-induced SNAI1e is an enforcer of TGF-β signaling.
a Schematic overview of CRISPRa-mediated lncRNA screen. b Diagram of lncRNA screening results. c RT-qPCR analysis of SNAI1e expression in MDA‐MB‐231 cells upon TGF-β stimulation. The results are presented as mean ± SD from three biological replicates. d RT-qPCR analysis of SNAI1e expression in MDA‐MB‐231 cells upon shRNA-mediated SMAD4 knockdown. Co.sh, empty vector for shRNA expression. The results are expressed as the mean ± SD from three biological replicates. e Luciferase reporter assay to determine the effects of SMAD3 and caTβRI on SNAI1e promoter 1 (P1) activity. The data are plotted as mean ± SD from three biological replicates. Co.vec, empty vector control. f ChIP-qPCR analysis of the SNAI1e transcription start site (TSS) in MDA-MB-231 cells. The results are expressed as mean ± SD from three biological replicates. g Luciferase reporter assay to determine the effects of TGF-β on SNAI1e promoter 7 (P7) activity. The data are presented as mean ± SD from three biological replicates. h ChIP-qPCR analysis of the SNAI1e promoter region (-2095 - -1987) in MDA-MB-231 cells. The results are expressed as mean ± SD from three biological replicates. i Coding probability prediction of SNAI1e with the CPAT software. Protein‐coding mRNAs (GAPDH and ACTB2) and well‐annotated lncRNAs (XIST and NKILA) serve as positive and negative controls, respectively. j Subcellular localization analysis of SNAI1e in MDA‐MB‐231 cells by RT-qPCR. NEAT1 serves as positive control for the nuclear fraction, whereas H19 and GAPDH serve as positive controls for the cytoplasmic fraction. The data are presented as mean ± SEM from three biological replicates. k RNA fluorescence in situ hybridization was performed to evaluate SNAI1e subcellular localization in MDA-MB-231 cells. Representative images from two independent experiments are shown. Scale bar = 10 μm. The results are quantified as a box plot with min to max Whiskers from 19 (−TGF-β) and 9 (+TGF-β) technical replicates (cells) and the fold change is shown. The boundaries of the box indicate the 25th percentile and the 75th percentile, and the center indicates the median. Significance was calculated using two-tailed unpaired Student’s t-test (e), and one-way ANOVA followed by Dunnett’s (c) and Tukey’s (d, f, g, h) multiple comparisons test. gEV gRNA expression vector. Co.vec empty control vector. Ab antibody.
Fig. 2
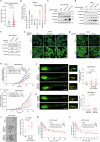
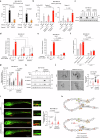
Fig. 2. SNAI1e promotes TGF-β-induced EMT and migration.
a Comparison of SNAI1e expression between normal and tumor breast samples from the TCGA dataset. The results are expressed as mean ± SEM from 101 normal and 1002 tumor breast samples, respectively. b RT-qPCR analysis of SNAI1e expression in multiple cell lines. The data are plotted as mean ± SD from three biological replicates. ce Effect of SNAI1e on TGF-β-induced EMT marker expression in MCF10A-M2 (c, e) or A549 (d) cells upon CRISPRa-mediated SNAI1e overexpression (c, d) or GapmeR‐mediated SNAI1e knockdown (e). f, g Immunofluorescence analysis of F‐actin expression in A549 cells upon CRISPRa-mediated SNAI1e overexpression (f) or GapmeR‐mediated SNAI1e knockdown (g). Scale bar = 36.8 μm. h, i Transwell assay to evaluate the effect of SNAI1e on TGF-β-induced migration in MDA-MB-231 cells. SNAI1e overexpression and knockdown were achieved by CRISPRa (h) and GapmeR (i), respectively. The results are expressed as mean ± SD from eight (h) and four (i) biological replicates, respectively. j, k In vivo zebrafish xenograft experiments with MDA-MB-231 cells upon CRISPRa-mediated SNAI1e overexpression (j) or GapmeR‐mediated SNAI1e knockdown (k). Extravasated breast cancer cell clusters are indicated with yellow arrows. Whole zebrafish image, bar = 618.8 μm; zoomed image, bar = 154.7 μm. The results are expressed as mean from 27 (gEV), 25 (g1), and 23 (g2) biological replicates in (j), and from 20 (Scramble GapmeR) and 22 (SNAI1e GapmeR) biological replicates in (k), respectively. l Effect of CRISPRa-mediated SNAI1e overexpression on mammosphere formation in MCF10A-M2 cells. The numbers of mammospheres are presented as mean ± SD from eight biological replicates. Scale bar = 100 μm. m, n Dose-response curves for doxorubicin (Doxo; m) or paclitaxel (PTX; n) in MCF10A-M2 cells upon CRISPRa-mediated SNAI1e overexpression The results are expressed as mean ± SD from three biological replicates. Significance was assessed using two-tailed unpaired Student’s t-test (a, k), two-way ANOVA followed by Dunnett’s (h, i) and Tukey’s (m, n) multiple comparisons test, and one-way ANOVA followed by Dunnett’s multiple comparisons test (j, l). Data are representative of two (f, g) and at least three (ce) independent experiments with similar results. gEV gRNA expression vector. Scr scramble.
Fig. 3
Fig. 3. SNAI1e inhibits TβRI polyubiquitination and degradation.
a, b Effect of SNAI1e overexpression (a) and knockdown (b) on CAGA12-dynGFP reporter in MDA-MB-231 cells. The data are presented as mean ± SD from four (a) and twelve (b) biological replicates. c Volcano plots showing the differentially expressed genes upon SNAI1e overexpression. d Plot exhibiting the top 15 cellular processes affected by SNAI1e. e GSEA of correlations between SNAI1e and the TGF-β response gene signature. f, g Effect of SNAI1e overexpression (f) and knockdown (g) on TGF-β-induced p-SMAD2. The relative abundance of p-SMAD2 is shown as mean ± SD from five (f) and three (g) independent experiments. h Effect of SNAI1e overexpression on TβRI and TβRII protein expression. The relative abundance of TβRI and TβRII is shown as mean ± SD from three independent experiments. i Western blotting analysis of TβRI protein stability upon SNAI1e overexpression. Quantitative data show the relative TβRI abundance as mean ± SEM from four independent experiments. j Western blotting analysis of TβRI expression upon SNAI1e knockdown with the lysosome or proteasome inhibitors. Quantitative data show the relative TβRI abundance as mean ± SD from three independent experiments. k Effect of SNAI1e overexpression on TβRI polyubiquitination. Relative ubiquitination abundance is shown as mean ± SD from three independent experiments. l Effect of SB431542 (SB) on TGF-β-induced EMT marker expression in MCF10A-M2 cells upon SNAI1e overexpression. m Effect of SB431542 (SB) on MDA-MB-231 cell migration upon SNAI1e overexpression. The results are expressed as mean ± SEM from six biological replicates. n Western blotting results showing TβRI ectopic expression upon SNAI1e knockdown. o Effect of TβRI ectopic expression on MDA-MB-231 cell migration upon SNAI1e knockdown. The results are expressed as mean ± SEM from six biological replicates. Significance was assessed using non-parametric permutation test (e), two-tailed paired Student’s t-test (g), two-way ANOVA followed by Tukey’s (a, m, o) and Dunnett’s (b, i) multiple comparisons test, and one-way ANOVA followed by Tukey’s (j) and Dunnett’s (f, h, k) multiple comparisons test. Data are representative of at least three (l, n) independent experiments with similar results. gEV gRNA expression vector. Scr scramble. Co.vec empty control vector. a.u. arbitrary units.
Fig. 4
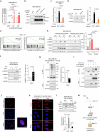
Fig. 4. SNAI1e induces SNAI1 expression.
a RT-qPCR analysis of SNAI1 expression in MDA‐MB‐231 cells upon SNAI1e overexpression. The results are expressed as the mean ± SD from three biological replicates. b Effect of SNAI1e overexpression on SNAI1 protein expression. c RT-qPCR analysis of SNAI1 expression upon SNAI1e knockdown. The data are presented as mean ± SD from three biological replicates. d Effect of SNAI1e knockdown on SNAI1 protein expression. Quantitative data show the relative abundance of SNAI1 as mean ± SD from three independent experiments. e GSEA of correlations between SNAI1e expression and SNAI1-induced gene signature. NES, normalized enrichment score. f Effect of SNAI1 ectopic expression on TGF-β-induced p-SMAD2 in MDA‐MB‐231 cells. Quantitative data show the abundance of p-SMAD2 as mean ± SD from three independent experiments. g Effect of SNAI1 ectopic expression on TβRI polyubiquitination in MDA-MB-231 cells expressing HA-ubiquitin (HA-Ub). Relative ubiquitination is shown as mean ± SEM from three independent experiments. h Effect of SNAI1e overexpression and shRNA-mediated SNAI1 knockdown on TGF-β-induced p-SMAD2. Quantitative data show the abundance of p-SMAD2 as mean ± SD from three independent experiments. i Interactions between SNAI1 and SMAD4 or SMAD7 were analyzed by co-immunoprecipitation assays in HEK293T cells. j The endogenous SNAI1-SMAD7 interaction as evaluated by PLA. The red and blue dots indicate the SNAI1‐SMAD7 interaction and the staining of nuclei by DAPI, respectively. Scale bar = 20 μm (left image) and 40 μm (right image). k Immunofluorescence analysis of SMAD7 localization upon SNAI1 ectopic expression. Scale bar = 58 μm. l Western blotting analysis of SMAD7 localization upon SNAI1 ectopic expression. The levels of the cytoplasmic marker GAPDH and the nuclear marker BRD4 serve as positive controls. Relative SMAD7 abundance is shown as mean ± SD from three independent experiments. m Schematic working model. SNAI1e-induced SNAI1 interacts with and potentiates SMAD7 nuclear retention, resulting in the decrease of TβRI polyubiquitination and proteasomal degradation. Significance was assessed using two-way ANOVA followed by Šidák’s multiple comparisons test (a), one-way ANOVA followed by Tukey’s multiple comparisons test (c, d, h), non-parametric permutation test (e), and two-tailed paired Student’s t-test (f, g, l). Data are representative of at least three (b, ik) independent experiments with similar results. gEV gRNA expression vector. Scr scramble. a.u. arbitrary units. Nuc nucleus. Cyto cytoplasm.
Fig. 5
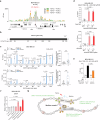
Fig. 5. SNAI1e functions as an eRNA to facilitate SNAI1 transcription.
a Circular chromosome conformation capture (4C)-seq profile overlays displaying the in cis chromatin contacts of the SNAI1e gene body. The increased interactions between SNAI1e viewpoint (VP) and other regions in −TGF-β group or +TGF-β group are labeled in green or yellow, respectively. Common interactions are labeled in gray. Coverage represents an average of three biological replicates. y axis, 4C coverage per 1 million normalized reads. b Schematic of the amplified regions by the indicated primer pairs against the SNAI1e gene body. c ChIP-qPCR analysis of the H3K4me1 and H3K27ac enrichment within the SNAI1e gene body region in MDA-MB-231 cells. The data are shown as mean ± SD from three biological replicates. Cumulative analysis of the histone marker enrichment fold is shown as a box plot with min to max Whiskers from eight technical replicates (eight genomic regions). The boundaries of the box indicate the 25th percentile and the 75th percentile, and the center indicates the median. d ChIP-qPCR analysis of RNA Pol II and H3K4me3 enrichment at the SNAI1 TSS upon CRISPRa-mediated SNAI1e overexpression. RT-qPCR results are shown as mean ± SD from three biological replicates. e ChIP-qPCR analysis of RNA Pol II enrichment at the SNAI1 TSS upon GapmeR-mediated SNAI1e depletion. RT-qPCR results are shown as mean ± SD from three biological replicates. f RT-qPCR analysis of SNAI1 expression in MDA-MB-231 cells upon CRISPR-Display-mediated in cis overexpression of SNAI1e or SNAI1e-V1. The data are presented as the mean ± SD from three biological replicates. g Schematic working model. TGF-β-induced SNAI1e stimulates local enhancer activity, marked by increased H3K27ac and H3K4me1 levels, and thereby triggers SNAI1 transcription by promoting recruitment of RNA Pol II and H3K4me3 to SNAI1 TSS. Significance was assessed by using two-way ANOVA followed by Dunnett’s (c, d) Šídák’s (e) multiple comparisons test, and one-way ANOVA followed by Tukey’s multiple comparisons test (f). gEV gRNA expression vector. Co.vec control empty vector. Scr scramble. TSS transcription start site.
Fig. 6
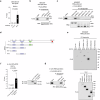
Fig. 6. SNAI1e directly interacts with BRD4.
a The interaction between SNAI1e and BRD4 in MDA‐MB‐231 cells was analyzed by RNA immunoprecipitation (RIP). YTHDC1 served as a negative control. RT-qPCR was performed to detect SNAI1e expression in immunoprecipitants from MDA‐MB‐231 cells. The results are expressed as mean ± SD from three independent experiments. b The interaction between SNAI1e and BRD4 in MDA-MB-231 cells was analyzed by RNA pull-down. Western blotting analysis was performed to detect FLAG expression in whole-cell lysates (Input) and immunoprecipitants (IP). LETS1 and SNAI1e-AS served as negative controls. The RNA amounts used for pull-down were evaluated by agarose gel electrophoresis. c The interaction between SNAI1e truncation mutants and BRD4 in MDA-MB-231 cells was analyzed by RNA pull-down. Western blotting analysis was performed to detect FLAG expression in whole-cell lysates (Input) and immunoprecipitants (IP). The RNA amounts used for pull-down were evaluated by agarose gel electrophoresis. d Schematic representation of full-length (FL) BRD4 and the truncation mutants tested. e The interactions between SNAI1e and BRD4 FL or the truncation mutants in MDA-MB-231 cells were analyzed by RNA pull-down. SNAI1e-AS, antisense SNAI1e; SNAI1e-S, sense SNAI1e. Western blotting analysis was performed to detect FLAG expression in whole-cell lysates (Input) and immunoprecipitants (IP). The RNA amounts used for pull-down were evaluated by agarose gel electrophoresis. f The direct interaction between SNAI1e and the FLAG-BRD4 BD1/2 recombinant protein was analyzed by in vitro RIP. The results are expressed as mean ± SD from three independent experiments. The FLAG-tagged proteins in immunoprecipitants were evaluated by western blotting. g The direct interaction between SNAI1e and the recombinant FLAG-BRD4 BD1/2 protein was analyzed by in vitro RNA pull-down. Western blotting analysis was performed to detect FLAG expression in whole-cell lysates (Input) and immunoprecipitants (IP). The RNA amounts used for pull-down were evaluated by agarose gel electrophoresis. Significance was calculated by using one-way ANOVA followed by Dunnett’s (a) and Tukey’s (f) multiple comparisons test. Data are representative of at least three (b, c, e, g) independent experiments with similar results. Co.vec empty control vector.
Fig. 7
Fig. 7. BRD4 is required for SNAI1e to induce SNAI1 expression and promote EMT and migration.
a, b ChIP-qPCR analysis of BRD4 enrichment at two regions in SNAI1e gene body upon GapmeR-mediated SNAI1e knockdown (a) and CRISPR-Display-mediated in cis overexpression of SNAI1e or SNAI1e-V1 (b). RT-qPCR results are shown as mean ± SD from three biological replicates. c Validation of the knockdown efficiency of BRD4 by western blotting. d RT-qPCR analysis of SNAI1e-induced SNAI1 expression upon BRD4 knockdown. The results are shown as mean ± SD from three biological replicates. e, f Effect of JQ-1 on SNAI1 expression induced by SNAI1e overexpression using CRISPRa (e) and CRISPR-Display (f). RT-qPCR results are shown as mean ± SD (e) and mean ± SEM (f) from three biological replicates. g A transwell migration assay was performed to evaluate the effect of JQ-1 on TGF-β/SNAI1e-induced migration in MDA-MB-231 cells. The results are expressed as mean ± SD from seven biological replicates. h Effect of JQ-1 on TGF-β/SNAI1e-induced EMT marker expression in MCF10A-M2 cells. i In vivo zebrafish extravasation experiments with MDA-MB-231 cells upon CRISPRa-mediated SNAI1e overexpression and JQ-1 treatment. Extravasated breast cancer cell clusters are indicated with yellow arrows. Whole zebrafish image, bar = 618.8 μm; zoomed image, bar = 77.3 μm. The results are expressed as mean from 31 (gEV-JQ-1), 36 (gEV+JQ-1), 27 (g1-JQ-1), and 41 (g1+JQ-1) biological replicates. j Mammosphere formation assays to check effect of JQ-1 and CRISPRa-mediated SNAI1e overexpression on MCF10A-M2 cell stemness. The numbers of mammospheres are expressed as mean ± SD from 24 biological replicates in the right panel. Scale bar = 100 μm. k Schematic working model. SNAI1e interacts with BRD4 to facilitate its binding to H3K27ac on the local enhancer, and thereby triggers SNAI1 transcription, TGF-β-induced EMT, migration, and stemness. JQ-1 treatment disrupts BRD4 binding to the local enhancer and inhibits SNAI1 transcription, TGF-β-induced EMT, migration, and stemness. Significance was assessed using one-way ANOVA followed by Dunnett’s (a, b, i) and Tukey’s (dg, j) multiple comparisons test. Data are representative of at least three (c, h) independent experiments with similar results. gEV gRNA expression vector. Co.vec empty control vector. Scr scramble.

References

    1. Nieto, M. A., Huang, R. Y., Jackson, R. A. & Thiery, J. P. EMT: 2016. Cell166, 21–45 (2016). - PubMed
    1. Pastushenko, I. & Blanpain, C. EMT transition states during tumor progression and metastasis. Trends Cell Biol.29, 212–226 (2019). - PubMed
    1. Brabletz, T., Kalluri, R., Nieto, M. A. & Weinberg, R. A. EMT in cancer. Nat. Rev. Cancer18, 128–134 (2018). - PubMed
    1. Fan, C., Zhang, J., Hua, W. & ten Dijke, P. Biphasic role of TGF-β in cancer progression: from tumor suppressor to tumor promotor. In Reference Module in Biomedical Sciences (Elsevier, 2018).
    1. ten Dijke, P., Miyazono, K., Heldin, C. H. & Moustakas, A. Special issue: TGF-β and epithelial-mesenchymal transition in cancer. Semin. Cancer Biol.102-103, 1–3 (2024). - PubMed

MeSH terms