. 2025 Mar 25;16(1):2893.
doi: 10.1038/s41467-025-58319-y.

SCFA biotherapy delays diabetes in humanized gnotobiotic mice by remodeling mucosal homeostasis and metabolome

Affiliations

SCFA biotherapy delays diabetes in humanized gnotobiotic mice by remodeling mucosal homeostasis and metabolome

Bree J Tillett et al. Nat Commun. .

Abstract

Type 1 diabetes (T1D) is linked to an altered gut microbiota characterized by reduced short-chain fatty acid (SCFA) production. Oral delivery of a SCFA-yielding biotherapy in adults with T1D was followed by increased SCFAs, altered gut microbiota and immunoregulation, as well as delaying diabetes in preclinical models. Here, we show that SCFA-biotherapy in humans is accompanied by remodeling of the gut proteome and mucosal immune homeostasis. Metabolomics showed arginine, glutamate, nucleotide and tryptophan metabolism were enriched following the SCFA-biotherapy, and found metabolites that correlated with glycemic control. Fecal microbiota transfer demonstrated that the microbiota of SCFA-responders delayed diabetes progression in humanized gnotobiotic mice. The protected mice increased similar metabolite pathways to the humans including producing aryl-hydrocarbon receptor ligands and reducing inflammatory mucosal immunity and increasing IgA production in the gut. These data demonstrate that a potent SCFA immunomodulator promotes multiple beneficial pathways and supports targeting the microbiota as an approach against T1D. Trial registration: Australia New Zealand Clinical Trials Registry ACTRN12618001391268.


Conflict of interest statement

Competing interests: E.M. is an inventor on a patent WO2018027274A1 submitted by Monash University that covers methods and compositions for metabolites for the treatment and prevention of autoimmune disease related to this paper, and is the founder of ImmunoBiota Therapeutics Pty Ltd. All other authors declare no competing interests.

Figures

Fig. 1
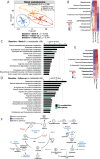
Fig. 1. Gut barrier protein remodeling revealed through fecal proteomics after SCFA biotherapy.
A Schematic overview of the trial. Created in BioRender. Hamilton-Williams, E. (2025) https://BioRender.com/h13m098. B Multivariate PLS-DA of human stool proteins. Significance determined by two-sided PERMANOVA. Pairwise comparisons were adjusted for multiple correction by false discovery rate. Ellipses show the 95% confidence interval. C, D PLS-DA components 1 and 2, top 20 loadings. Orange: baseline, blue: week 6, red: follow-up. E Top-40 significantly enriched Gene Ontology biological processes (FDR < 0.05) enriched using proteins (p < 0.05) that increased from baseline to 6 weeks. F KEGG pathway enrichment of proteins which increased from baseline to six weeks or G decreased from baseline to six weeks. Significance determined by linear mixed effects models using a Likelihood Ratio Test (p < 0.05) and Benjamini-Hochberg correction for multiple testing. Enrichments were performed using proteins with p < 0.05. The cut-off for edges is 40% shared proteins. Thickness of edges indicate degree of protein overlap. See also Supplementary Fig. 1 and Supplementary Data 2-4.
Fig. 2
Fig. 2. Gut metabolite production undergoes significant changes after SCFA biotherapy.
A Multivariate PLS-DA of human stool metabolites. Significance determined by two-sided PERMANOVA. Pairwise comparisons were adjusted for multiple corrections by false discovery rate. Ellipses show a 95% confidence interval. B Abundance heatmap of stool metabolites with an FDR < 0.1 determined by linear mixed effects model using a Likelihood Ratio Test (p < 0.05) and Benjamini-Hochberg correction for multiple testing. Metabolites in bold are level 1 (identified using reference standards). C Significant KEGG pathways enriched from baseline to six weeks and D baseline to follow-up. Enrichments were performed in MetOrigin using metabolites with p < 0.05. Differences were determined using paired two-tailed t-test of individual metabolites with a cut-off value of p < 0.05. Green bars: microbiota pathways, black bars shared host and microbiota (co-metabolism) pathways. E Repeated measures correlations of metabolites with FDR < 0.1 with glycemic variables. * indicates FDR corrected p-value > 0.01 < 0.05 and · indicates p-value > 0.05 < 0.1 F Pathway schematic showing key human stool proteins, stool metabolites, and metabolic pathways altered after the intervention. Solid arrow indicates changes at 6-weeks, dashes arrow indicates changes at follow-up. TCA cycle: The citric acid cycle, NO: nitric oxide. Created in BioRender. Hamilton-Williams, E. (2025) https://BioRender.com/l00t262. See also Supplementary Fig. 2 and Supplementary Data 2, 5, and 6.
Fig. 3
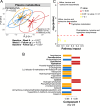
Fig. 3. Plasma metabolites are significantly altered at follow-up.
A PLS-DA analysis of plasma metabolites and B loading plot for component 1 of the PLS-DA. Significance determined by two-sided PERMANOVA. Pairwise comparisons were adjusted for multiple correction by false discovery rate. Ellipses indicate 95% confidence intervals. Orange: baseline, blue: week 6, red: follow-up. Metabolites in bold are level 1 (identified using reference standards). C MetaboAnalyst pathway enrichment analysis of plasma metabolites that changed from 6-weeks to follow-up and baseline to follow-up. Enrichment used metabolites with two-sided linear mixed model analysis p < 0.05. Red dashed line indicates pathway significance. Color represents the significance. Dot size represents impact. P values are provided. See also Supplementary Data 7 and 8.
Fig. 4
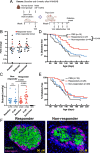
Fig. 4. Human-to-mouse microbiota transplantation from responders delays diabetes in NOD mice.
A Experimental design. Female germ-free NOD mice were colonized with a human stool suspension or remained uncolonized (PBS controls) by oral gavage on days 0 and 7, then mated one week later. Female offspring were followed for diabetes progression and fecal samples collected for analysis. Created in BioRender. Hamilton-Williams, E. (2025) https://BioRender.com/u03r698. B Donor samples, represented by blue dots (non-responder donors) and red dots (responder donors), from four participants were selected from the n = 18 completed SCFA biotherapy trial participants based on fold-change in fecal butyrate at 6 weeks from baseline. One outlier individual is excluded from the graph with fold-changes of 73.2, 123.8, and 299.5. The dashed line represents fold-change of 2 cut-off for defining responder status. C Fecal butyrate in the female offspring of the mice (7–9 weeks of age) colonized with responder (red) or non-responder (blue) human donor stool samples (baseline and 6-week trial timepoints), or control germ-free mice. The line represents median value. Significance based on one-way ANOVA with Tukey’s correction. Survival curve analysis (log-rank Mantel-Cox) test in germ-free NOD mice colonized with non-responder vs responder stool samples collected from donors at 6-weeks (D) or baseline (E) or control germ-free mice which received a sterile PBS gavage. Diabetes data was pooled from two independent experiments. F Pancreas sections stained by immunofluorescence for insulin (green) and glucagon (magenta), with DAPI nuclear stain (blue) from female colonized mice at 10 weeks of age (n = 7 responder and n = 9 non-responder mice, from one experiment). Representative image is shown at 20× magnification. See also Supplementary Fig. 3–6.
Fig. 5
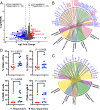
Fig. 5. Fecal metabolites, not gut microbiota composition, drive clustering of recipient mice in human-to-mouse microbiota transplantation study.
A Sparse-PCA of 16S rRNA amplicon sequencing of feces collected from female NOD offspring of human-microbiota colonized mice at 5 weeks of age. Mice colonized with 6-week donor samples were shown. B PCA of fecal metabolites from female NOD mice pups collected at 7–9 weeks of age. Mice colonized with 6-week donor samples only were analyzed for metabolites. Significance determined by two-sided PERMANOVA. C Pathway enrichment analysis of metabolites from mice colonized with responder versus non-responder donors using MetOrigin. Differences were determined using a paired two-sided t-test of individual metabolites with a cut-off value of p < 0.05. Green bars— microbiome pathways, black bars—co-metabolism (shared between host and microbiota) pathways. D Abundance (log2 normalized intensity) of key metabolites from pathways identified in the enrichment analysis. Metabolites marked with # are microbiota only pathways determined from the origin-based MPEA analyses. 4-(2-Amino-3-hydroxyphenyl)-2,4-dioxobutanoic acid is the complete name for abbreviated metabolite in the tryptophan pathways. Box and whisker plots show median and inter-quartile range, with lines representing the minimum and maximum values. Schematic of E purine metabolism pathway and F pyrimidine metabolism pathway. Metabolites in bold are level 1 (identified using reference standards). Metabolites shown in red were higher in responder mice. Schematics created in BioRender. Hamilton-Williams, E. (2025) https://BioRender.com/w72e215 and https://BioRender.com/s39p554. See also Supplementary Fig. 7–9 and Supplementary Data 9−12.
Fig. 6
Fig. 6. Ileal changes in B-cell, innate immunity, and tryptophan metabolism gene signature in responder-microbiota colonized mice.
A RNA sequencing of ileum tissue from offspring of mice colonized with 6-week samples from SCFA-biotherapy responder (donor C, n = 4) and non-responder (donor B, n = 4) mice, collected at 10 weeks of age. Volcano plot of differentially expressed genes in the ileum. Significance determined using Bioconducter package DESeq2 (two-sided analysis). Selected pathways enriched between responders and non-responders in the ileum using B Gene Ontology and C KEGG. Red labels: genes increased in responders, blue labels: genes decreased in responders. D CD40 expression on conventional dendritic cells (cDCs), CD11b + XCR1- dendritic cells (cDC2), total B cells, and IgM- B cells in the spleens of the responder (n = 7) and non-responder (n = 9) mice at 10 weeks of age. The gating strategy is shown in Supplementary Fig. 12. Data pooled from two experiments. The line represents median value. Significance was determined using an unpaired, two-tailed t-test. See also Supplementary Data 13–15.
Fig. 7
Fig. 7. Enhanced aryl-hydrocarbon receptor activity in responder-microbiota colonized mice.
A Fecal water extract from human-microbiota colonized mouse offspring at 7–10 weeks of age was used to stimulate Ahr luciferase reporter cells. Significance was determined by one-way ANOVA with Sidak’s correction (two-sided). Data was pooled from two experiments. B Fecal water extract from the human study participants (n = 18) was used to stimulate Ahr luciferase reporter cells. Human donors used in the mouse study were indicated by colors (non-responder donors – blue, responder donors – red). FICZ synthetic Ahr ligand was used as a positive control and data is expressed as fold change relative to unstimulated cells. Significance determined by repeated-measures one-way ANOVA with Dunnett’s correction (two-sided). C Representative images of ileum tissue from human-microbiota colonized mouse offspring at 10 weeks of age stained with anti-IgA (red), anti-Ahr (cyan), and DAPI (blue). Image representative of staining from n = 5 responder and n = 6 non-responder mice from one experiment.
Fig. 8
Fig. 8. Multi-omic factor analyses (MOFA) identify latent factors associated with glycaemic control, SCFA, and Ahr activity.
MOFA was used to integrate bacterial taxa (n = 22), bacterial pathways (n = 91), human stool proteins (n = 101), stool metabolite (n = 101) and plasma metabolite (n = 92) datasets. The identified latent factors were correlated with clinical data, SCFA and Ahr activity. A Heatmap indicating two-sided Pearson’s correlation between clinical variables and model factors. ***P < 0.001,**P < 0.01, *P < 0.05. B Variables contributing to latent factor 3. Only variables with absolute weight >0.4 are included in the plots. Black text: human proteins, blue text: plasma metabolites, red text: stool metabolites.

References

    1. Belkaid, Y. & Harrison, O. J. Homeostatic Immunity and the microbiota. Immunity46, 562–576 (2017). - PMC - PubMed
    1. Craig, M. E. et al. Early-life factors contributing to type 1 diabetes. Diabetologia62, 1823–1834 (2019). - PubMed
    1. Siljander, H., Honkanen, J. & Knip, M. Microbiome and type 1 diabetes. EBioMedicine46, 512–521 (2019). - PMC - PubMed
    1. Marino, E. et al. Gut microbial metabolites limit the frequency of autoimmune T cells and protect against type 1 diabetes. Nat. Immunol.18, 552–562 (2017). - PubMed
    1. Vatanen, T. et al. The human gut microbiome in early-onset type 1 diabetes from the TEDDY study. Nature562, 589–594 (2018). - PMC - PubMed

MeSH terms

Substances