. 2025 Mar 25;9(1):86.
doi: 10.1038/s41698-025-00874-0.

ChemoID-guided therapy improves objective response rate in recurrent platinum-resistant ovarian cancer randomized clinical trial

Affiliations

ChemoID-guided therapy improves objective response rate in recurrent platinum-resistant ovarian cancer randomized clinical trial

Thomas J Herzog et al. NPJ Precis Oncol. .

Abstract

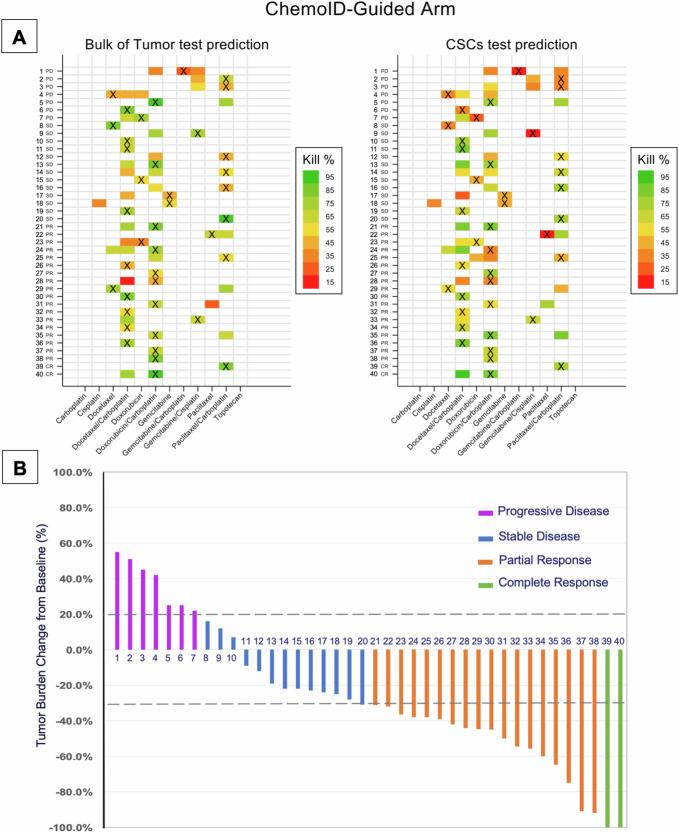
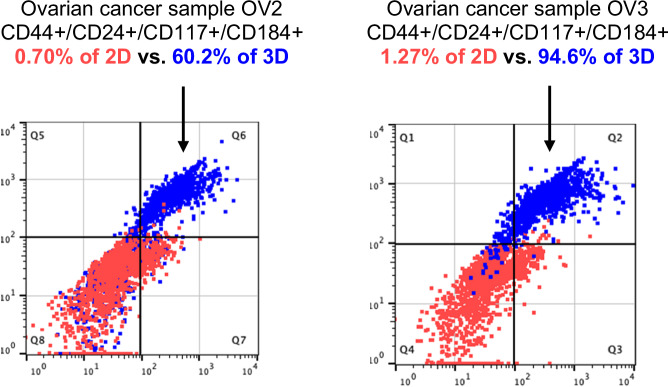
Patients with recurrent platinum-resistant ovarian cancer (PROC) have poor clinical outcomes, owing mainly to the presence of therapy-resistant cancer stem cells (CSCs). The NCT03949283 randomized clinical trial enrolled patients with recurrent PROC to receive ChemoID-guided chemotherapy or the best physician-choice regimen selected from the same list of thirteen mono or combination chemotherapies. The primary outcome was objective response rate (ORR) assessed on CT scans using the RECIST 1.1 criteria at 6 months follow-up. Subjects treated with the ChemoID assay had an ORR of 55% (CI95 39% - 73%), compared to 5% (CI95 0% - 11%) for those treated with physician's choice chemotherapy (p <0.0001). Secondary endpoints of duration of response (DOR) and progression-free survival (PFS) of subjects treated with chemotherapies guided by the ChemoID assay versus physician's choice chemotherapy were a median of 8 months vs. 5.5 months (p <0.0001), and 11.0 months (CI95 8.0- NA) vs 3.0 months (CI95 2.0- 3.5) with 27% of hazard ratio (CI95, 0.15-0.49; p <0.001), respectively.


Conflict of interest statement

Competing interests: Drs. Claudio and Valluri reported ownership of intellectual property rights on the cancer stem cell platform technology licensed to Cordgenics, LLC. No other disclosures were reported for other authors.

Figures

Fig. 1
Fig. 1. CONSORT diagram of ChemoID study.
A total of 136 patients were screened between January 31, 2020, and April 15, 2023; Eighty-one of these patients were randomized to either the ChemoID or physician-choice group. The first prespecified interim analysis was performed when 75 subjects were enrolled in the trial.
Fig. 2
Fig. 2
A multi-institutional, randomized clinical trial of patients with recurrent platinum-resistant epithelial ovarian cancer was initiated to assess the efficacy of chemotherapy regimens selected by the ChemoID assay vs. best physician choice. Chemotherapy drugs and doses used in the trial are indicated. The primary endpoint of this trial was objective response rate (ORR). Secondary endpoints were Progression-Free Survival (PFS), duration of response (DOR), measurement of CA125 serum levels, and health-related quality of life.
Fig. 3
Fig. 3. ORR is significantly improved by ChemoID-guided therapy.
A Prespecified interim analysis of ORR. B Final Analysis of ORR.
Fig. 4
Fig. 4. PFS is significantly improved by ChemoID-guided therapy.
Final Analysis of PFS. The number of events; median PFS; PFS rates at 0, 6, 12, and 18 months; and the Kaplan–Meier curve for PFS per investigator assessment in patients treated with ChemoID-guided (blue) vs. physician-choice (red) therapies. Symbols indicate censored observations. A Cox proportional hazards model estimated hazard ratios (HRs) and CIs.
Fig. 5
Fig. 5. DOR (PR + CR) is significantly improved by ChemoID-guided therapy.
Pyramid graph of the duration of response in the two groups. PD is indicated by red bars. SD is indicated by yellow bars. PR and CR are indicated by green bars.
Fig. 6
Fig. 6. CBR (defined as CR + PR + SD/# of subjects) is significantly improved by ChemoID-guided therapy.
A Prespecified interim analysis of CBR. B Final Analysis of CBR.
Fig. 7
Fig. 7. Levels of serum CA125 between screening and third follow-up are improved by ChemoID-guided therapy.
Levels of CA125 of patients in the ChemoID-guided group treated with assay-predicted drugs (blue) vs. physician-choice (red) therapies are represented. The slope of the group of patients treated with ChemoID-guided (blue) vs. physician-choice (red) is represented.
Fig. 8
Fig. 8. The patient’s response correlated with the cell kill of drugs used during treatment as per the ChemoID test report.
A Quadrant diagrams of the associative analysis of cell kill percentages (bulk tumor cell and CSCs) vs tumor response post-treatment of subjects in the Physician-Choice group. Referent lines are drawn at 50% cell kill for the bulk of the tumor and CSCs, cluster subjects who had a response. Open red circles, participants who had no response (SD and PD); solid green circles, participants who had a response (PR and CR). B Quadrant diagrams of the associative analysis of cell kill percentages (bulk tumor cell and CSCs) vs tumor response post-treatment of subjects in the ChemoID-Guided group. Referent lines are drawn at 50% cell kill for the bulk of the tumor and CSCs, cluster subjects who had a response (PR and CR). Open red circles, participants who had no response (SD and PD); solid green circles, participants who had a response (PR and CR).
Fig. 9
Fig. 9
Forest Plot illustrates the lack of association between response and age, race, number of prior platinum treatments, and ECOG.
Fig. 10
Fig. 10. Levels of serum CA125 between screening and third follow-up are improved when subjects are treated with high-cell kill ChemoID-predicted therapy.
High cell-kill drug cut-offs are above 50% cell kill for the bulk of the tumor and CSCs. Patients randomized in either of the arms were re-grouped into two groups depending on whether they were treated with high-cell kill predicted drugs or not. The CA125 serum levels of subjects treated using high cell kill predicted drugs vs. patients treated with drugs not predicted by the assay were plotted. The slope of the group of patients who were treated with assay-predicted (blue) vs. not-predicted drugs (red) is represented.
Fig. 11
Fig. 11. Heatmap of the drug response prediction and treatment received and percent of tumor burden change following therapy from subjects in the physician-choice arm.
A Heat map of the Drug Response Prediction and Treatment Received. Each row represents a different participant in the Physician-Choice group. Each participant is labeled with a unique progressive number. Subjects labeled “NR” are non-responders (SD and PD), while those labeled “R” are responders (CR and PR) evaluated as per RECIST 1.1. The various drug/drug combinations used in the study are represented in the columns. The treating physicians were blinded to test results. The “X” represents the drug regimen administered to each subject. The color of the cells corresponds to the predicted cell kill % of the drug(s). The colored cells without the “X” show other potential drug regimens that were predicted, but not administered. B Percentage of tumor burden change as per RECIST 1.1 measurements following treatment received from subjects in the physician-choice group. Each column represents a different participant. Each participant is labeled with a unique progressive number. Referent lines are drawn to indicate complete response (CR, purple columns, 100% tumor decrease), partial response (PR, orange columns, ≥ 30% tumor decrease), stable disease (SD, blue columns, 30% tumor decrease to 20% tumor increase), and progressive disease (PD, purple columns, ≥ 20% tumor increase).
Fig. 12
Fig. 12. Heatmap of the drug response prediction and treatment received and percent of tumor burden change following therapy from subjects in the ChemoID-guided arm.
A Heat map of the Drug Response Prediction and Treatment Received. Each row represents a different participant in the ChemoID-guided group. Each participant is labeled with a unique progressive number. Subjects labeled “NR” are non-responders (SD and PD), while those labeled “R” are responders (CR and PR) evaluated as per RECIST 1.1. The various drug/drug combinations used in the study are represented in the columns. Therapy was guided by the test results. The “X” represents the drug regimen administered to each subject. The color of the cells corresponds to the predicted cell kill % of the drug(s). The colored cells without the “X” show other potential drug regimens that were predicted, but not administered. B Percentage of tumor burden change as per RECIST 1.1 measurements following treatment received from subjects in the ChemoID-guided group. Each column represents a different participant. Each participant is labeled with a unique progressive number. Referent lines are drawn to indicate complete response (CR, purple columns, 100% tumor decrease), partial response (PR, orange columns, ≥ 30% tumor decrease), stable disease (SD, blue columns, 30% tumor decrease to 20% tumor increase), and progressive disease (PD, purple columns, ≥ 20% tumor increase).
Fig. 13
Fig. 13. The bulk of tumor cells (grown in 2D) and the CSCs (grown in 3D) were labeled with fluorescent-conjugated antibodies against CD24, CD44, CD117, and CD184.
A fluorescence shift can be observed in the expression of CD44/CD24/CD117/CD184 in the CSCs enriched using the 3D bioreactor (in blue) vs the bulk of tumor cells grown in 2D (in red). Sample OV2 contains 0.7% of the bulk of tumor cells (2D) expressing CD44/CD24/CD117/CD184 vs 60.2% of the CSCs (3D) enriched in the bioreactor. Sample OV3 contains 1.27% of the bulk of tumor cells (2D) expressing CD44/CD24/CD117/CD184 vs 94.6% of the CSCs (3D) enriched in the bioreactor.

References

    1. Hanker, L. C. et al. The impact of second to sixth line therapy on survival of relapsed ovarian cancer after primary taxane/platinum-based therapy. Ann. Oncol.23, 2605–2612 (2012). - PubMed
    1. Djordjevic, B. et al. Current approach to epithelial ovarian cancer based on the concept of cancer stem cells. J. BUON17, 627–636 (2012). - PubMed
    1. Wang, X. et al. Eliminating ovarian cancer stem cells: a potential therapeutic target for ovarian cancer chemoresistance. Curr. Protein Pept. Sci.16, 270–278 (2015). - PubMed
    1. Markman, M. & Bookman, M. A. Second-line treatment of ovarian cancer. Oncologist5, 26–35 (2000). - PubMed
    1. Stuart, G. C. et al. 2010 Gynecologic Cancer InterGroup (GCIG) consensus statement on clinical trials in ovarian cancer: report from the Fourth Ovarian Cancer Consensus Conference. Int J. Gynecol. Cancer21, 750–755 (2011). - PubMed

LinkOut - more resources