. 2025 Jul;68(7):1559-1573.
doi: 10.1007/s00125-025-06412-8. Epub 2025 Mar 25.

Immunotherapy with low-dose IL-2 attenuates vascular injury in mice with diabetic and neovascular retinopathy by restoring the balance between Foxp3+ Tregs and CD8+ T cells

Affiliations

Immunotherapy with low-dose IL-2 attenuates vascular injury in mice with diabetic and neovascular retinopathy by restoring the balance between Foxp3+ Tregs and CD8+ T cells

Devy Deliyanti et al. Diabetologia. 2025 Jul.

Abstract

Aims/hypothesis: Diabetic retinopathy features damage to the retinal microvasculature that causes vessels to leak and proliferate and can lead to vision loss and blindness. Inflammation contributes to the development of diabetic retinopathy, but little is known about the role of the adaptive immune system, including the benefits of augmenting the Forkhead box protein P3 (Foxp3) regulatory T cell (Treg) compartment. We aimed to determine whether treatment with low-dose IL-2 expands and activates Tregs and reduces CD8+ T cells in the retina, and attenuates retinal inflammation and vasculopathy in murine models of diabetic retinopathy and neovascular retinopathy.

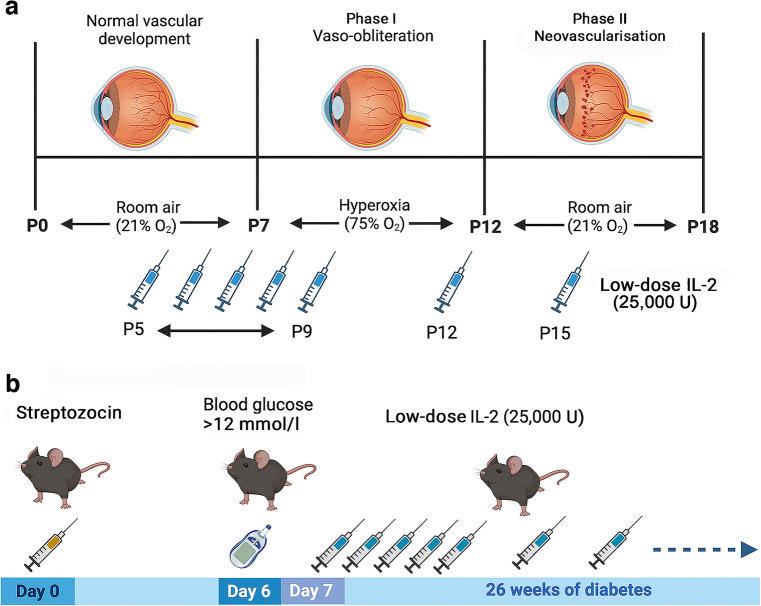
Methods: Mouse models of streptozocin-induced diabetes and oxygen-induced retinopathy (OIR) were administered low-dose IL-2 (25,000 U) or vehicle (sterile water) by i.p. injection. Reporter mice expressing Foxp3 as a red fluorescent protein (RFP) conjugate or CD8 as a green fluorescent protein (GFP) conjugate were used to evaluate Foxp3+ Tregs and CD8+ T cells, respectively, in blood, lymphoid organs and retina using flow cytometry or confocal microscopy. Vasculopathy and the expression of angiogenic and inflammatory factors were assessed in the retina.

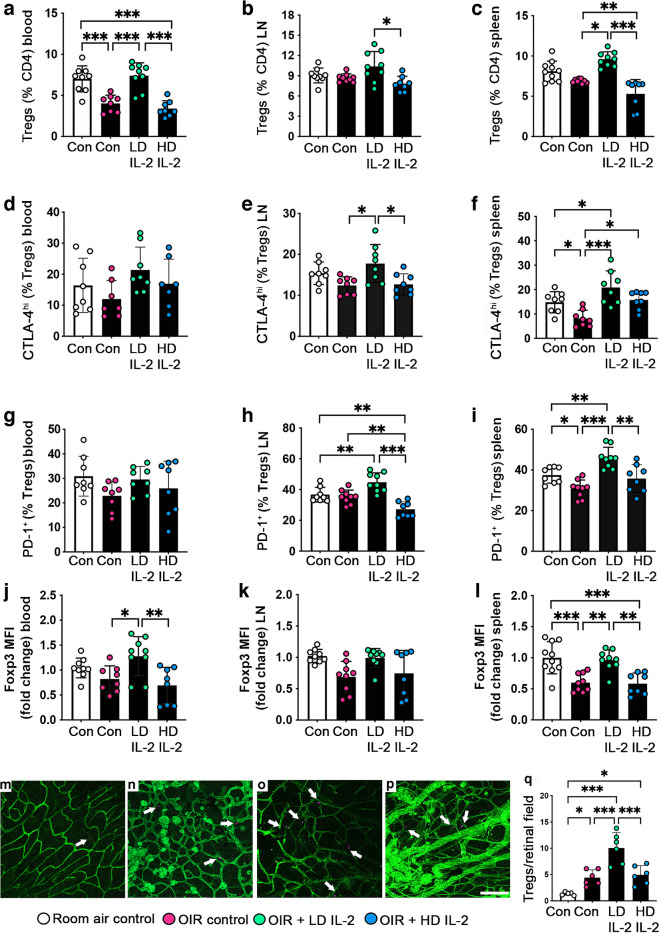
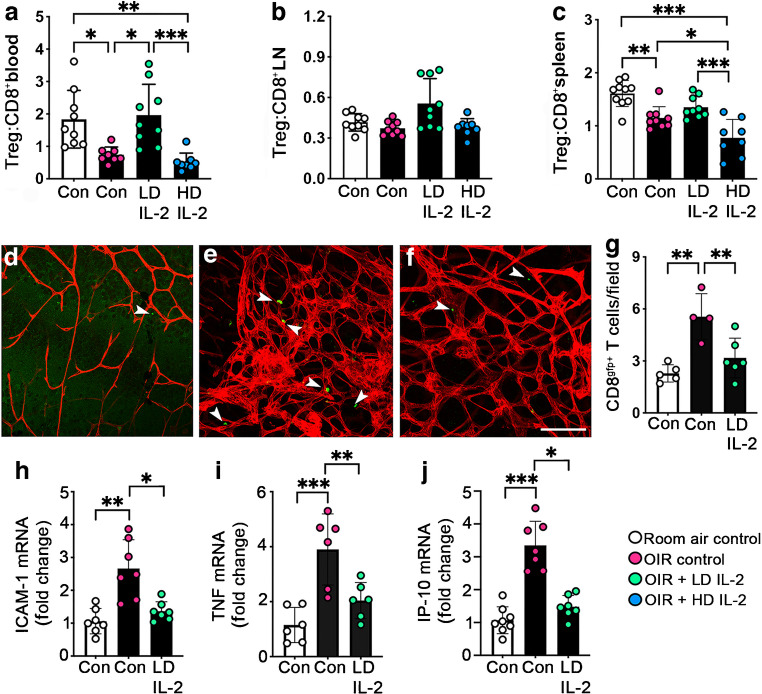
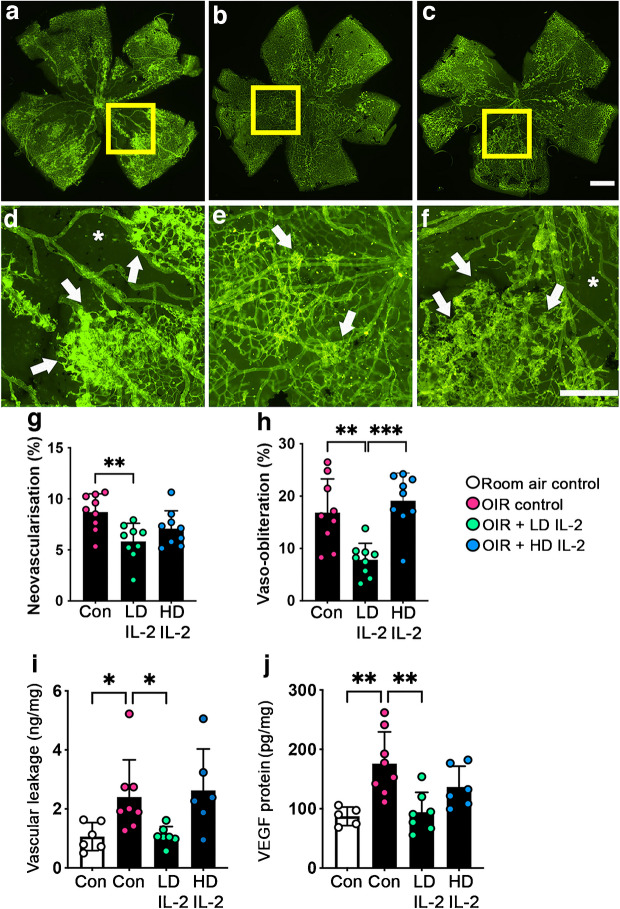
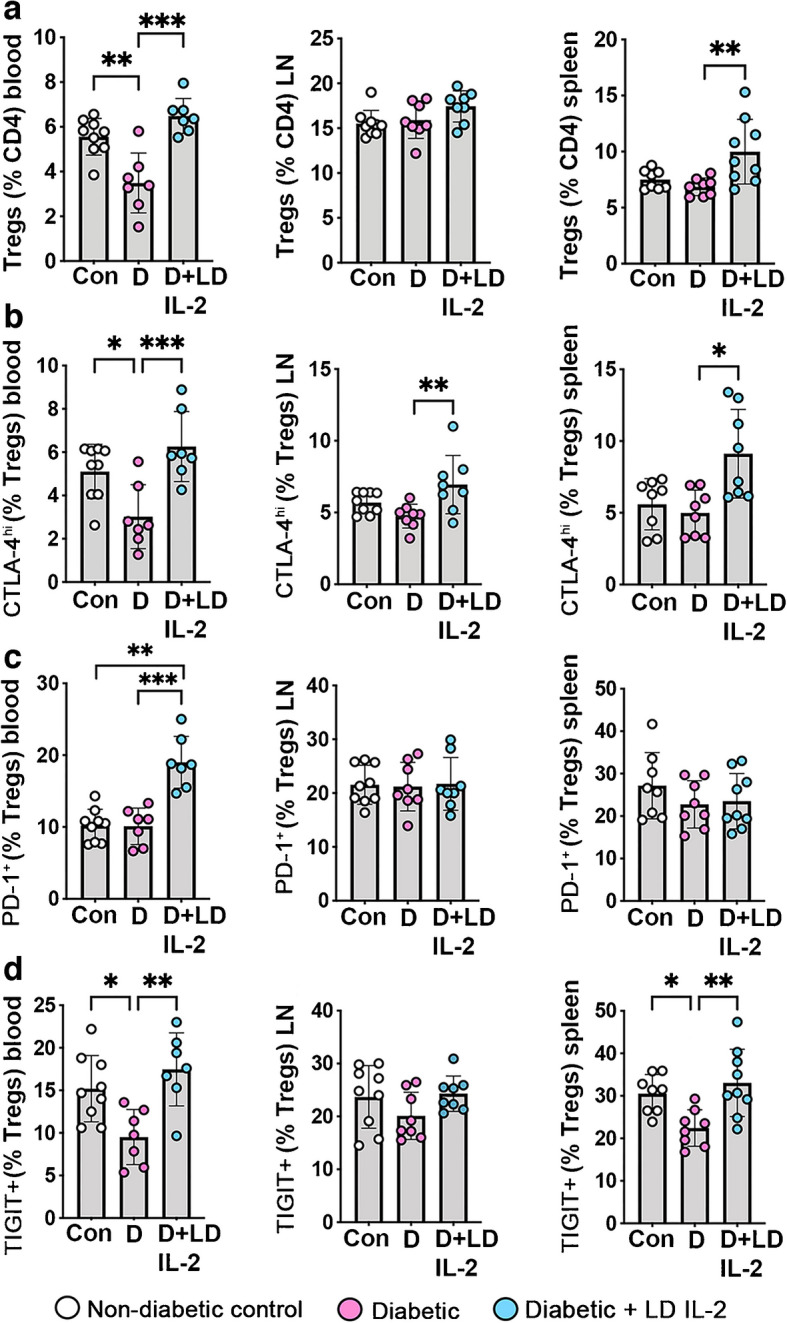
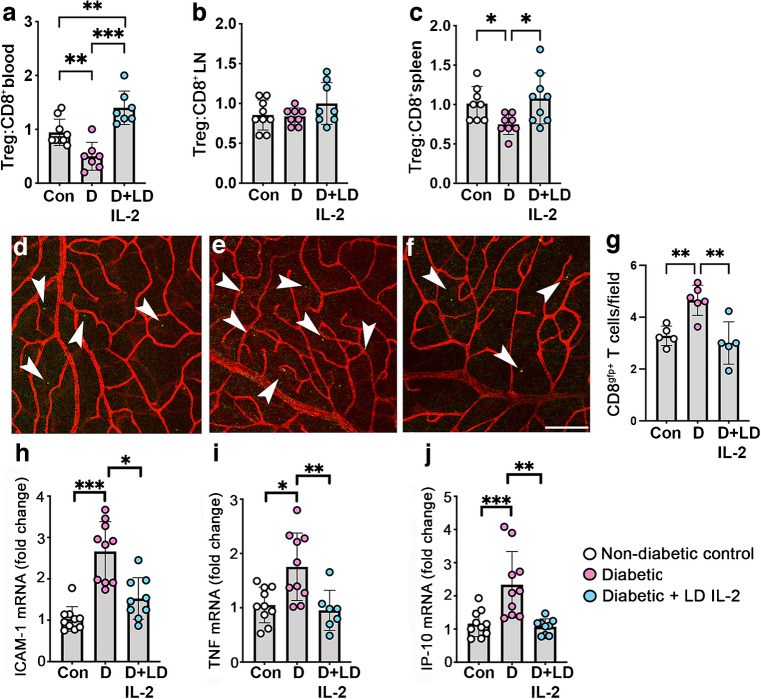
Results: Low-dose IL-2 significantly expanded CD4+CD25+Foxp3+ Tregs in the blood and spleen of mouse models of OIR and diabetes (1.4- to 1.9-fold increase, p<0.01). This expansion enhanced Treg functionality, increasing the expression of cytotoxic T-lymphocyte-associated protein4 (CTLA4), programmed cell death protein1 (PD1) and T-cell immunoreceptor with immunoglobulin and immunoreceptor tyrosine-based inhibitory motif (ITIM) domain (TIGIT), and increased the ratio of Tregs to CD8+ T cells. This was accompanied in the retina by a twofold increase in Foxp3+ Tregs (diabetes: 3.01 ± 0.41 vs 5.90 ± 1.25 cells per field, p<0.001; OIR: 4.41 ± 1.48 vs 10.05 ± 2.91 cells per field, p<0.001) and a reduction in CD8+ T cells (diabetes: 4.65 ± 0.58 vs 3.00 ± 0.81 cells per field, p<0.01; OIR: 5.51 ± 1.33 vs 3.17 ± 1.14 cells per field, p<0.01). Low-dose IL-2 reduced the levels of the potent inflammatory factors intercellular adhesion protein1 and TNF and the chemokine IFNγ-inducible protein10 (IP-10) in the retina. Importantly, low-dose IL-2 treatment effectively attenuated retinal vasculopathy, with marked reductions in acellular capillaries (diabetes: 0.48-fold decrease, p<0.001), neovascularisation (OIR: 0.68-fold decrease, p<0.01) and vascular leakage, and expression of vascular endothelial growth factor.

Conclusions/interpretation: This study highlights the therapeutic potential of low-dose IL-2 to reduce retinal inflammation and severe vascular injury by boosting Tregs and reducing CD8+ T cells and inflammatory factors.

Keywords: Angiogenesis; CD8+ T cells; Diabetic retinopathy; IL-2; Oxygen-induced retinopathy; Regulatory T cells; Tregs.


Conflict of interest statement

Data availability: The data from this study are available from the corresponding author on reasonable request. Funding: Open Access funding enabled and organized by CAUL and its Member Institutions. This research was supported by Breakthrough T1D (formerly known as JDRF) (ID #SRA-2020-968-M-B) and the National Health and Medical Research Council of Australia Ideas Grant scheme (1181462). DD was supported by a Breakthrough T1D Postdoctoral Fellowship (formerly known as JDRF; 1-PDF-2020-969-A-N). The funders were not involved in the design of the study, the collection, analysis and interpretation of data, or writing the report, and did not impose any restrictions regarding the publication of the report. Authors relationships and activities: All authors declare that there are no relationships or activities that might bias, or be perceived to bias, their work. Contribution statement: DD and JLW-B conceived the study, drafted the manuscript, made substantial contributions to the acquisition, analysis and interpretation of the data, and revised and gave final approval to the manuscript. VS, AJo and AJa made substantial contributions to the acquisition, analysis and interpretation of data, and revised and gave final approval to the manuscript. DD and JLW-B are the guarantors of this work and take responsibility for the integrity of this work as a whole.

Figures

Fig. 1
Fig. 1
Experimental protocols and low-dose IL-2 treatment in mice. (a) Oxygen-induced retinopathy. Low-dose IL-2 was administered by daily i.p. injections for 5 days from P5 to P9 and then once every 3 days until P18. (b) Diabetic retinopathy. Seven days after the administration of streptozocin, diabetic mice were administered low-dose IL-2 by i.p. injection once per day for 5 days and then once every 3 days for 26 weeks. Created with BioRender
Fig. 2
Fig. 2
Low-dose IL-2 expanded Tregs in peripheral sites and retina of OIR mice at P18. Abundance of (ac) CD4+CD25+Foxp3+ Tregs, (df) CTLA-4hi and (gi) PD-1+ Tregs, and (jl) Foxp3 mean fluorescence intensity (MFI) levels in CD4+CD25+Foxp3+ Tregs in blood, pooled lymph nodes (LN) and spleen, measured by flow cytometry; n=7–10 mice per group with at least two independent experiments. (mp) Representative flat mounts of retinas from Foxp3RFP+/+ mice, stained with FITC-conjugated isolectin B4 to show the vasculature (green): (m) room air control; (n) OIR control; (o) OIR + LD IL-2; (p) OIR + HD IL-2. Arrows indicate Foxp3+ Tregs, which were frequently found near areas of retinal neovascularisation in OIR controls and OIR + high-dose IL-2 mice. Scale bar = 100 µm. (q) Quantification of Tregs per field of inner retina (inner limiting membrane to ganglion cell layer) from Foxp3RFP+/+ mice; n=6–7 mice per group from two independent experiments. Con, controls; LD, low-dose; HD, high-dose. White bars are room air controls; black bars are OIR groups. All values are means ± SD. Data were analysed using one-way ANOVA and Holm–Šídák tests, except for the lymph node data in (b) and (k), which were analysed using the Kruskal–Wallis test followed by Dunn’s test for non-parametric comparisons. *p<0.05, **p<0.01, ***p<0.001
Fig. 3
Fig. 3
Low-dose IL-2 restored the Treg:CD8+ T cell ratio and reduced CD8+ T cells in retinas of OIR mice at P18. (ac) Tregs:CD8+ T cells ratio in (a) blood, (b) pooled lymph nodes (LN) and (c) spleen measured by flow cytometry; n=8–10 mice per group from two or three independent experiments. (df) Representative flat mounts of retinas from CD8GFP+/− mice, stained with DyLight 594/isolectin-conjugated isolectin B4 to show the vasculature (red). Arrowheads indicate CD8+ T cells (green): (d) room air control; (e) OIR control; (f) OIR + low-dose IL-2. Scale bar = 100 µm. (g) Quantification of CD8+ T cells per field of inner retina (inner limiting membrane to ganglion cell layer) from CD8GFP+/− mice; n=4–6 mice per group. (hj) Fold change in mRNA levels in retinas for (h) ICAM-1, (i) TNF and (j) IP-10 compared with room air controls; n=6–8 mice per group. Con, controls; LD, low-dose; HD, high-dose. White bars are room air controls; black bars are OIR groups. All values are means ± SD. All data were analysed by the Kruskal–Wallis test followed by Dunn’s test, except for data in (c) and (g), which were analysed using one-way ANOVA and the Holm–Šídák test for parametric comparisons. *p<0.05, **p<0.01, ***p<0.001
Fig. 4
Fig. 4
Low-dose IL-2 but not high-dose IL-2 attenuated retinal vasculopathy in OIR mice at P18. (af) Representative flat mounts of retinas from Foxp3RFP+/+ mice, stained using FITC-conjugated isolectin B4 to show the vasculature (green). The regions indicated by the yellow boxes in the upper panels are presented at higher magnification in the lower panels. Neovascularisation is indicated by arrows and vaso-obliteration is indicated by asterisks. Scale bars = 0.125 mm. (gh) Quantification of retinal neovascularisation (g) and vaso-obliteration (h); n=9 mice per group from three independent experiments. (ij) Vascular leakage in retina measured by an albumin ELISA (i) and VEGF protein levels in retina measured by ELISA (j); n=5–8 mice per group. Con, controls; LD, low-dose; HD, high-dose. White bars are room air controls; black bars are OIR groups. All values are means ± SD. All data were analysed by one-way ANOVA followed by the Holm–Šídák test, except for the data in (j), which were analysed using the Kruskal–Wallis test followed by Dunn’s test. *p<0.05, **p<0.01, ***p<0.001
Fig. 5
Fig. 5
Low-dose IL-2 increased the number of Tregs in the blood and lymphoid tissues of mice with diabetic retinopathy for 26 weeks. (ad) Abundance of (a) CD4+CD25+Foxp3+ Tregs and (b) CTLA-4hi, (c) PD-1+ and (d) TIGIT+ Tregs in blood, pooled lymph nodes (LN) and spleen, measured by flow cytometry; n=7–9 mice per group with at least two independent experiments. Con, non-diabetic control; D, diabetic mice; LD, low-dose. All values are means ± SD. All data were analysed by one-way ANOVA followed by the Holm–Šídák test, except spleen data in (a) and (b), which were analysed using Kruskal–Wallis and Dunn’s tests for non-parametric comparisons. *p<0.05, **p<0.01, ***p<0.001
Fig. 6
Fig. 6
Low-dose IL-2 increased the number of Foxp3+ Tregs in the retinas of mice with diabetic retinopathy for 26 weeks. (ac) Representative flat mounts of retina from Foxp3RFP+/+ mice, stained using FITC-conjugated isolectin B4 to highlight the vasculature (green): (a) non-diabetic control; (b) diabetic mice; (c) diabetic mice treated with LD IL-2. Arrowheads indicate Foxp3+ cells. Scale bar = 100 µm. (d) Quantification of Tregs per field of retina (inner limiting membrane to outer nuclear layer); n=6–7 mice per group from two independent experiments. Con, non-diabetic control; D, diabetic mice; LD, low-dose. All values are means ± SD. Data were analysed by one-way ANOVA followed by the Holm–Šídák test. **p<0.01, ***p<0.001
Fig. 7
Fig. 7
Low-dose IL-2 increased the Treg:CD8+ T cell ratio and reduced CD8+ T cells and inflammation in retinas of mice with diabetic retinopathy for 26 weeks. (ac) Ratio of Tregs:CD8+ T cells in the (a) blood, (b) pooled lymph nodes (LN) and (c) spleen, measured by flow cytometry; n=7–9 mice per group from two independent experiments. (df) Representative flat mounts of retinas from CD8GFP+/− mice, stained using DyLight 594/isolectin-conjugated isolectin B4 to show the vasculature (red): (d) non-diabetic control; (e) diabetic mice; (f) diabetic mice treated with low-dose IL-2. Arrowheads show CD8+ T cells (green). Scale bar = 100 µm. (g) Quantification of CD8+ T cells per field of retina (inner limiting membrane to outer nuclear layer); n=4–6 mice per group. (hj) Fold change in mRNA levels in retinas for (h) ICAM-1, (i) TNF and (j) IP-10 compared with non-diabetic controls; n=7–10 mice per group. Con, non-diabetic control; D, diabetic mice; LD, low-dose. All values are means ± SD. All data were analysed using the Kruskal–Wallis test followed by Dunn’s test, except for the data in (a), (b) and (g), which were assessed using one-way ANOVA followed by the Holm–Šídák test. *p<0.05, **p<0.01, ***p<0.001
Fig. 8
Fig. 8
Low-dose IL2 reduced the number of acellular capillaries, vascular leakage and VEGF in retina of mice with diabetic retinopathy for 26 weeks. (ac) Trypsin digests of retina showing the vasculature. Sections were stained using periodic acid/Schiff reagent: (a) non-diabetic control; (b) diabetic mice; (c) diabetic mice treated with low-dose IL2. Arrows indicate acellular capillaries. Scale bar = 100 µm. (d) Quantification of acellular capillaries in retina; n=5–6 mice per group. (e) Vascular leakage into the vitreous humour measured by an albumin ELISA; n=9–11 mice per group. (f) Retinal VEGF mRNA fold change compared with non-diabetic controls; n=8–11 mice per group. (g) VEGF protein in retina measured by ELISA; n=5 mice per group. Con, non-diabetic control; D, diabetic mice; LD, low-dose. All values are means ± SD. All data were analysed by one-way ANOVA followed by the Holm–Šídák test, except data in (f), which were analysed using Kruskal–Wallis and Dunn’s tests. *p<0.05, **p<0.01, ***p<0.001

Similar articles

References

    1. Teo ZL, Tham YC, Yu M et al (2021) Global prevalence of diabetic retinopathy and projection of burden through 2045: systematic review and meta-analysis. Ophthalmology 128(11):1580–1591. 10.1016/j.ophtha.2021.04.027 - PubMed
    1. Gurung RL, FitzGerald LM, Liu E et al (2023) Predictive factors for treatment outcomes with intravitreal anti-vascular endothelial growth factor injections in diabetic macular edema in clinical practice. Int J Retina Vitreous 9(1):23. 10.1186/s40942-023-00453-0 - PMC - PubMed
    1. Kinuthia UM, Wolf A, Langmann T (2020) Microglia and inflammatory responses in diabetic retinopathy. Front Immunol 11(2888):564077. 10.3389/fimmu.2020.564077 - PMC - PubMed
    1. Deliyanti D, Talia DM, Zhu T et al (2017) Foxp3+ Tregs are recruited to the retina to repair pathological angiogenesis. Nat Commun 8(1):748. 10.1038/s41467-017-00751-w - PMC - PubMed
    1. Tang Q, Bluestone JA (2008) The Foxp3+ regulatory T cell: a jack of all trades, master of regulation. Nat Immunol 9(3):239–244. 10.1038/ni1572 - PMC - PubMed

MeSH terms

LinkOut - more resources