. 2025 Jun;68(6):1279-1297.
doi: 10.1007/s00125-025-06409-3. Epub 2025 Mar 25.

Regulating islet stress responses through CD47 activation

Affiliations

Regulating islet stress responses through CD47 activation

Atharva Kale et al. Diabetologia. 2025 Jun.

Abstract

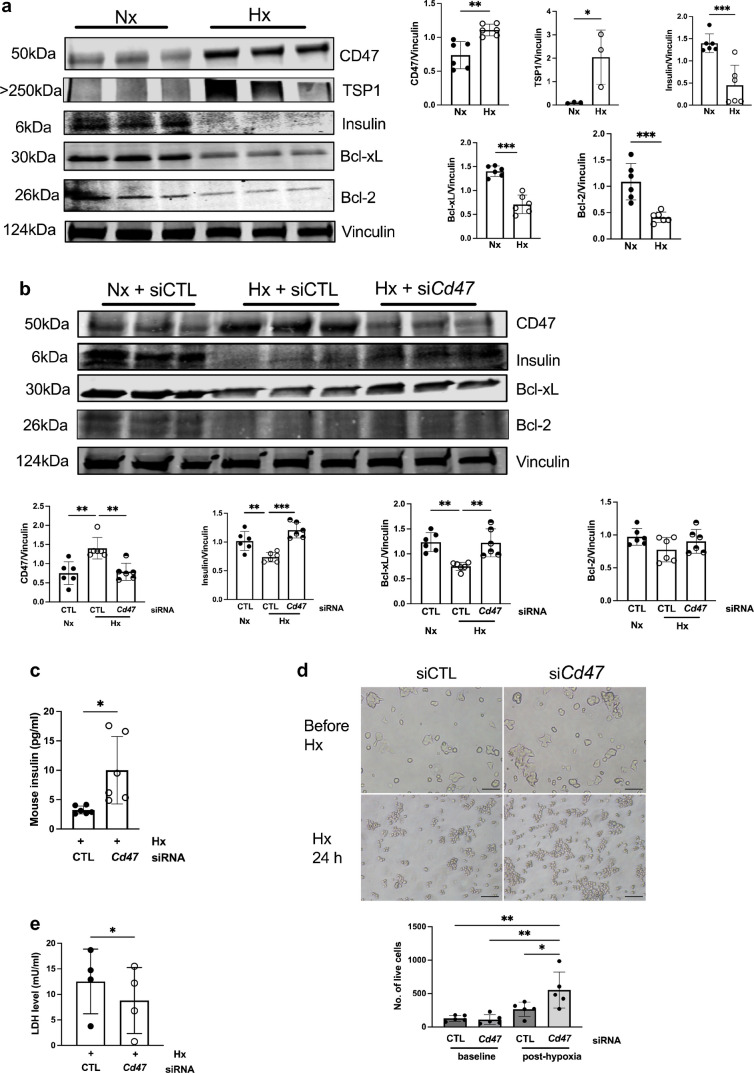
Aims/hypothesis: Diabetes is a global health burden characterised by incremental beta cell loss. Islet transplantation is a recognised treatment for individuals with type 1 diabetes and hypoglycaemia unawareness but broader application is constrained by limited islet survival and function post-transplantation. The underlying molecular mechanisms that induce beta cell dysfunction and demise remain unclear, and therapeutic agents that protect against cellular loss and maintain insulin secretion are in demand as potential treatment options. CD47 is a cell surface protein implicated in cellular stress responses but its role in beta cell function remains relatively unexplored. We hypothesised that modulating CD47 expression would demonstrate a cytoprotective effect in beta cells.

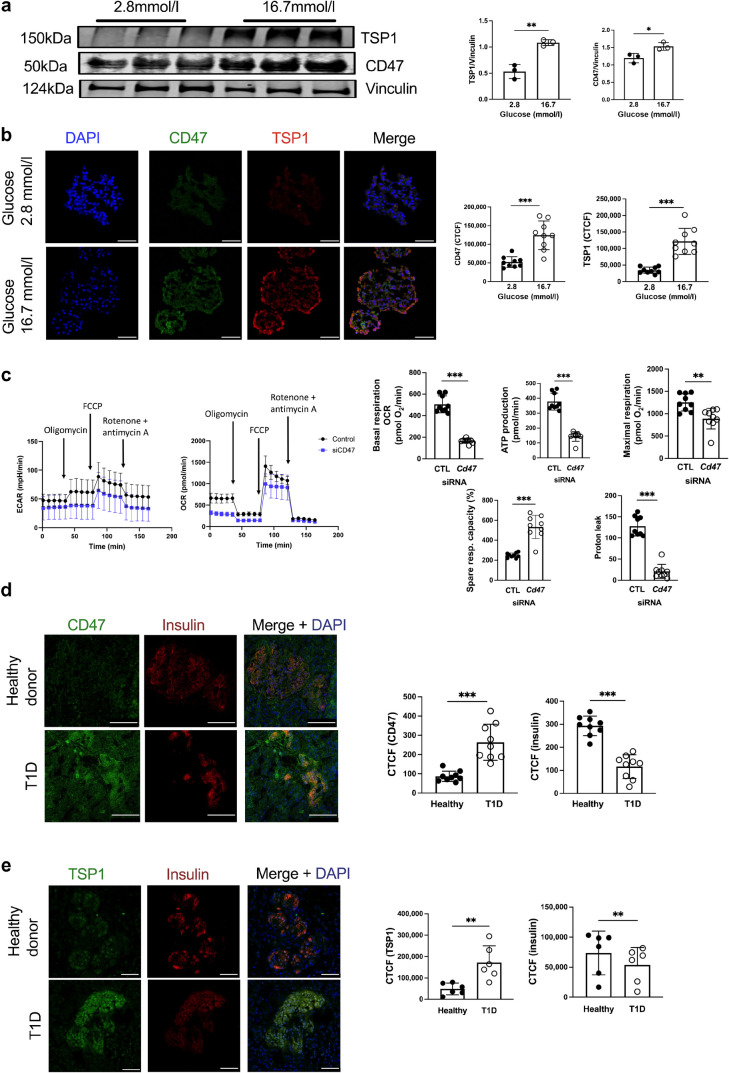
Methods: We used primary murine islets with/without genetic deletion of CD47, as well as human islets and MIN6 cells subjected to pharmacological disruption of CD47 signalling (siRNA or blocking antibody). Metabolic stress was induced in cells by exposure to hypoxia, hyperglycaemia or thapsigargin, and markers of the unfolded protein response, cell survival and insulin secretory function were assessed. Human pancreases from individuals with and without diabetes were examined for evidence of CD47 signalling.

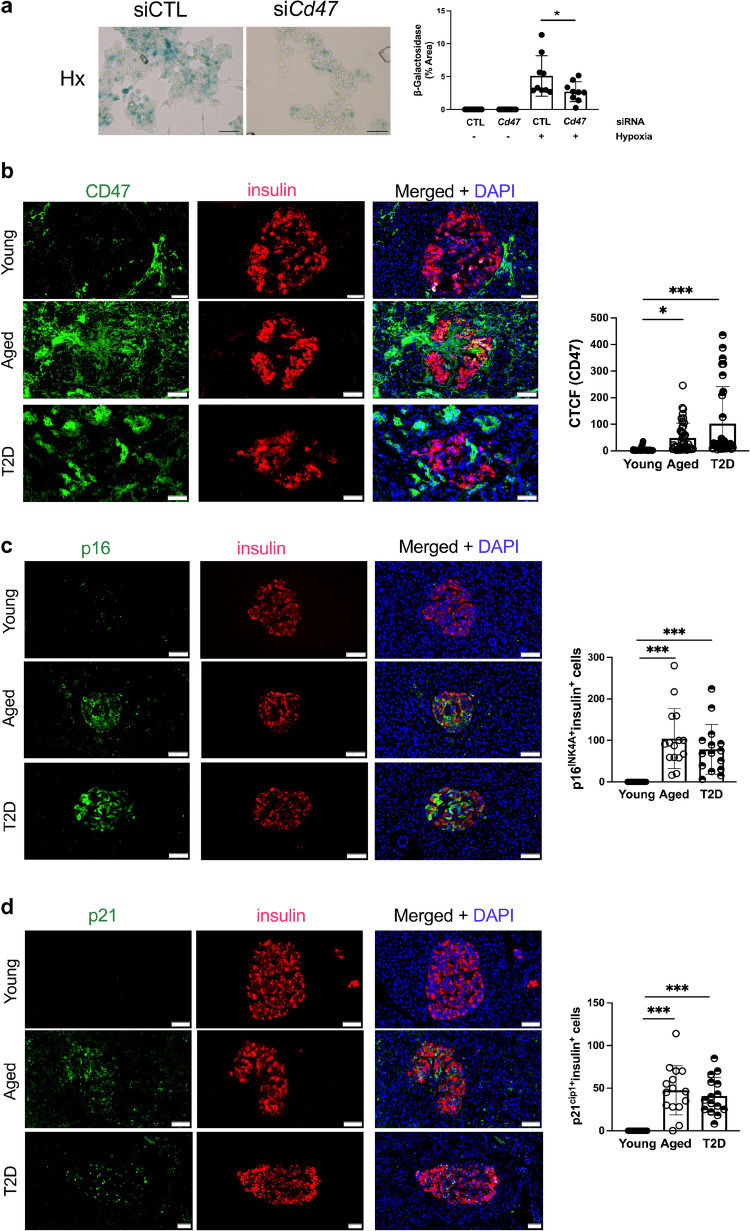
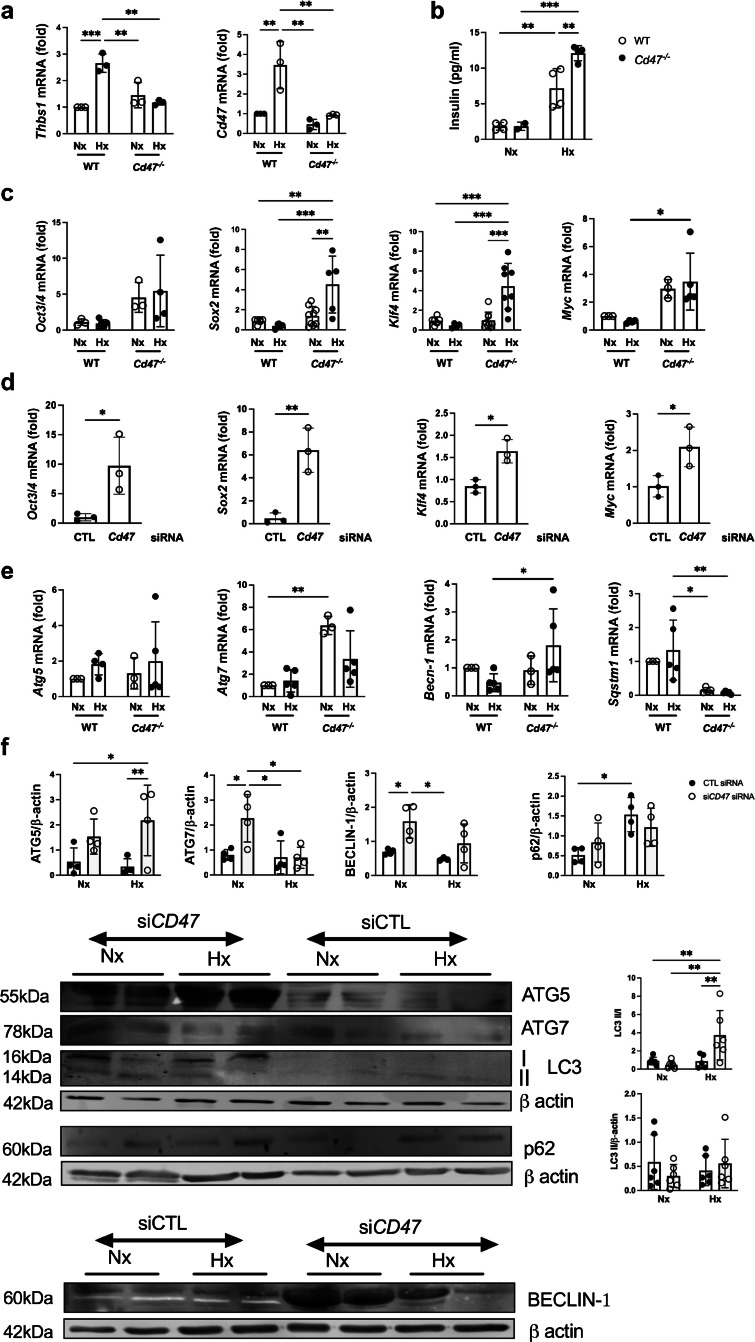
Results: Expression of CD47 and its high affinity ligand thrombospondin-1 (TSP1) was robustly upregulated by exogenous stressors. Limiting CD47 signalling improved markers of senescence, apoptosis, endoplasmic reticulum stress, unfolded protein response, self-renewal and autophagy, and maintained insulin secretory responses. We also found concurrent upregulated expression of CD47 and senescence markers in the endocrine pancreas of aged donors and those with type 2 diabetes. Both CD47 and TSP1 expression were increased in pancreases of humans with type 1 diabetes, as were plasma levels of TSP1.

Conclusions/interpretation: Our study provides key insights into the essential role of CD47 as a novel regulator of islet dysfunction, regulating cytoprotective responses to stress. CD47 may contribute to beta cell damage during the development of diabetes and failure of islet transplant function. Therefore, limiting CD47 activation may be a potential therapeutic tool in conditions where islet function is inadequate.

Keywords: CD47; Diabetes mellitus; ER stress; Hypoxia; Islet transplantation; Islets; Thrombospondin-1.


Conflict of interest statement

Data availability: This manuscript used data acquired from the Human Pancreas Analysis Program (HPAP-RRID:SCR_016202) database ( https://hpap.pmacs.upenn.edu/ ), a Human Islet Research Network (RRID:SCR_014393) consortium (UC4-DK-112217, U01-DK-123594, UC4-DK-112232 and U01-DK-123716). Funding: Open Access funding enabled and organized by CAUL and its Member Institutions. This work was supported by a JDRF Australia top-up scholarship to AK (SC4325), a National Health Medical Research Council grant (GNT2007991) to NMR, a Diabetes Australia General Grant to NMR (Y23G-ROGN) and to KG (Y21G-GHIK) and a Ramaciotti Foundation Health Investment Grant (2020HIG03) to NMR and KG. Authors’ relationships and activities: KG and NMR are named as inventors on a worldwide patent ‘Modulating insulin expression and production by targeting CD47’, publication no. WO/2022/087658. KG and NMR are not involved in any consulting services related to the current work. The authors declare that there are no other relationships or activities that might bias, or be perceived to bias, their work. Contribution statement: The study was conceptualised by NMR and KG. Experiments were performed by AK, MA, VC, SC, SMJ, PMM, KG and NMR. Bioinformatics analysis was performed by HR and EP. The methodology used was defined by AK, MA, KG and NMR. All authors were involved in data acquisition and analysis. The original draft of the manuscript was written by NMR, and all authors critically reviewed the manuscript and approved the final version. NMR is responsible for the integrity of the work as a whole.

Figures

Fig. 1
Fig. 1
Hypoxia upregulates TSP1–CD47 signalling and limits insulin production in islets. (a) Mouse (n=3 replicates from n=3 or 4 mice per replicate) and human islets (n=6 donors) were subjected to normoxia (FIO2 21%) or hypoxia (FIO2 1%) for 24 h. Lysates were collected, resolved by SDS-PAGE and probed for CD47 and TSP1. Representative western blot and combined densitometry are shown. (b) Isolated human islets subjected to normoxia or hypoxia were embedded in OCT, sectioned and stained for CD47 (red), TSP1 (green) and DAPI (blue). Scale bar, 20 μm; magnification ×60. Quantification of staining from n=3 donors from two–three randomly chosen regions-of-interest per image. (c) Human islets (n=6 donors) subjected to normoxia or hypoxia were resolved by SDS-PAGE and probed for HIF1α, CD47 and insulin. Representative western blot and combined densitometry are shown. (d) Human islets (n=3 donors) subjected to normoxia or hypoxia were embedded in OCT, sectioned and stained for CD47 (green), insulin (red) and DAPI (blue). Quantification of staining from three randomly chosen regions-of-interest per image. Scale bar, 20 μm; magnification ×60. All data are mean ± SD. *p<0.05, **p<0.01 and ***p<0.001 by Student’s t test. CTCF, corrected total cell fluorescence; Hx, hypoxia; Nx, normoxia
Fig. 2
Fig. 2
Hypoxic upregulation of CD47 impairs insulin secretion from islets. (a) Human islets transfected with non-silencing control or CD47 siRNA, or treated with anti-CD47 antibody were subjected to normoxia or hypoxia (FIO2 1%) for 24 h and stained for CD47 (green), insulin (red) and DAPI (blue). Images were obtained on a confocal microscope at ×60 magnification. Scale bar, 20 µm. Corrected total cell fluorescence was quantified from n=3 donors from three randomly selected regions-of-interest per image. (b) MIN6 cells transfected with non-silencing control or Cd47 siRNA, or pre-treated with anti-CD47 antibody were subjected to normoxia or hypoxia for 24 h and stained for CD47 (green), insulin (red) and DAPI (blue). Images were obtained on a confocal microscope at ×60 magnification. Scale bar, 50 µm. Corrected total cell fluorescence was quantified from n=5 randomly chosen regions-of-interest from n=3 replicates. (c) Insulin concentration in supernatant fractions from MIN6 cell culture (n=4 replicates) assessed by ELISA. (d) MIN6 cells transfected with non-silencing control or Cd47 siRNA were exposed to hypoxia (FIO2 1%) for 24 h. Lysates were collected, resolved by SDS-PAGE and probed for CD47 and insulin. Representative western blot and combined densitometry are shown. All data are mean ± SD. **p<0.01 and ***p<0.001 by Student’s t test (d), or one-way ANOVA (a, b, c). α, anti-; Ab, antibody; CTCF, corrected total cell fluorescence; CTL, control; Hx, hypoxia; Nx, normoxia
Fig. 3
Fig. 3
Hypoxia promotes apoptosis in islets that is mitigated by limiting CD47 signalling. (a) MIN6 cells (n=3–6 replicates) exposed to normoxia (FIO2 21%) or hypoxia (FIO2 1%) for 24 h were resolved by SDS-PAGE and probed for CD47, TSP1, insulin, Bcl-2 and Bcl-xL. Representative western blot and combined densitometry are shown. (b) MIN6 cells transfected with non-silencing control or Cd47 siRNA were exposed to normoxia (Nx, FIO2 21%) or hypoxia (Hx, FIO2 1%) for 24 h. Lysates (n=6 replicates) were collected, resolved by SDS-PAGE and probed for CD47, insulin, Bcl-2 and Bcl-xL. (c) Insulin concentrations in supernatant fractions from cell cultures were assessed by ELISA (n=6 replicates). (d) Cell numbers before and after 24 h hypoxia (n=5 replicates). Images were obtained on a brightfield microscope at ×4 magnification. Scale bar, 200 µm. (e) LDH levels in hypoxic cell culture after 24 h (n=4 replicates). All data are mean ± SD. *p<0.05, **p<0.01 and ***p<0.001 by Student’s t test (a, c, e), one-way ANOVA (b) or two-way ANOVA (d). CTL, control; Hx, hypoxia; Nx, normoxia
Fig. 4
Fig. 4
Senescence and CD47 are upregulated by ageing and diabetes. (a) MIN6 cells were cultured in six-well plates, transfected with non-silencing control or Cd47 siRNA and then exposed to normoxia (FIO2 21%) or hypoxia (FIO2 1%) for 24 h. Senescence-associated β-galactosidase activity was measured from three regions-of-interest per well from n=3 replicates. Images were obtained on a brightfield microscope at ×20 magnification. Scale bar, 50 µm. (bd) Human pancreas samples from non-diabetic young (<35 years) and aged (>60 years) organ donors, as well as donors with type 2 diabetes were stained for insulin and CD47 (b), insulin and p16INK4A+ (c) or insulin and p21cip1+ (d). Corrected total cell fluorescence for CD47 was quantified from n=5 islets per sample (n=3 donors per group). p16INK4A+ or p21cip1+ cells within the islets of Langerhans (n=5 islets per sample) were counted (c, d). Images were obtained on a confocal microscope at ×60 magnification. Scale bar, 50 µm. All data are mean ± SD. *p<0.05 and ***p<0.001 by two-way ANOVA (a) or one-way ANOVA (b, c, d). CTCF, corrected total cell fluorescence; CTL, control; Hx, hypoxia; Nx, normoxia; T2D, type 2 diabetes
Fig. 5
Fig. 5
CD47 signalling limits autophagy and self-renewal expression in islets. WT and Cd47−/− mouse islets (from n=3–5 samples isolated from n=3 or 4 mice/sample) were isolated and subjected to normoxia (FIO2 21%) or hypoxia (FIO2 1%) for 24 h. (a) mRNA expression of Thbs1 and Cd47 was measured by RT-qPCR. (b) Insulin concentration in the supernatant fraction was measured by ELISA. (c, d) RT-qPCR for self-renewal factors Oct3/4, Sox2, Klf4 and Myc (OSKM) in primary mouse islets following normoxia or hypoxia for 24 h (c) or in MIN6 cells under normoxia transfected with control or Cd47 siRNA (d) was performed. Transcripts were normalised to 18S and then to the referent control (WT normoxic cells or control value respectively). (e) RT-qPCR analysis of autophagy markers Atg5, Atg7, Becn1 (Beclin-1) and Sqstm1 (p62) in primary murine islet subjected to normoxia or hypoxia. (f) Human islets transfected with non-silencing control or Cd47 siRNA then exposed to normoxia or hypoxia for 24 h, protein resolved by SDS-PAGE and probed for ATG5, ATG7, BECLIN-1, LC3 and p62. Representative western blot and combined densitometry are shown. All data are mean ± SD. *p<0.05, **p<0.01 and ***p<0.001 by two-way ANOVA (a, b, c, e, f) or Student’s t test (d). CTL, control; Hx, hypoxia; LC3, microtubule-associated protein light chain 3; Nx, normoxia
Fig. 6
Fig. 6
Loss of CD47 signalling limits ER stress in islets. (a, b) MIN6 cells transfected with non-silencing control or Cd47 siRNA were exposed to thapsigargin for 18 h. Cell lysates were resolved by SDS-PAGE and probed for TSP1, CD47, BiP, IRE1α, total and phospho-eIF2α, and CHOP (a), or Bcl-xL, Bcl-2 and FLIP (long [FLIPL] and short [FLIPS] isoforms) (b). Representative western blot and combined densitometry from n=3–6 replicates are shown. (c, d) LDH activity (c) and insulin content (d) in cell culture supernatant fractions were measured by ELISA. (e) Primary murine islets from WT and Cd47−/− mice were isolated and exposed to thapsigargin for 18 h. mRNA expression of ERN1 (Ire1α), Hspa5 (BiP), and Ddit3 (CHOP) was measured by RT-qPCR, normalised by the mean of 18S, and then vehicle-treated WT cells were used as the referent control. All data are mean ± SD. *p<0.05, **p<0.01 and ***p<0.001 by one-way ANOVA (ad) or two-way ANOVA (e). CTL, control; Hx, hypoxia; Nx, normoxia; Thapsi, thapsigargin
Fig. 7
Fig. 7
TSP1–CD47 signalling is upregulated in type 1 diabetes. Human islets were cultured at baseline glucose (2.8 mmol/l) or hyperglycaemic (16.7 mmol/l) conditions. (a) Cell lysates were resolved by SDS-PAGE and probed for TSP1 and CD47. Representative western blot and combined densitometry are shown from n=3 replicates. (b) Islets were embedded in OCT, sectioned and stained for CD47 (green), TSP1 (red) and DAPI (blue). Scale bar, 50 μm; magnification ×60. Quantification of staining from n=3 donors from three randomly chosen regions-of-interest per image. (c) MIN6 cells transfected with non-silencing control or Cd47 siRNA were used to seed a Seahorse assay plate (105 cells/well). The ECAR and OCR was measured using the Seahorse XFe24 Well Analyzer in hyperglycaemic media (16.7 mmol/l), with the addition of oligomycin (1 µmol/l), FCCP (0.8 µmol/l) and rotenone/antimycinA (0.5 µmol/l) at time points as indicated. Basal respiration, ATP production, maximal respiration, spare respiratory capacity and proton leak from n=3 replicates run in triplicate were calculated. Healthy donor pancreas (n=3) or pancreas from a donor with type 1 diabetes (n=1) was stained for (d) CD47 and insulin or (e) TSP1 and insulin. Scale bar, 75 μm; magnification ×60. Corrected total cell fluorescence was quantified averaged from n=9 or n=6 islets of Langerhans (respectively) in the endocrine pancreas. *p<0.05, **p<0.01 and ***p<0.001 by Student’s t test. CTCF, corrected total cell fluorescence; CTL, control; T1D, type 1 diabetes
Fig. 8
Fig. 8
TSP1–CD47 signalling is upregulated in type 1 and type 2 diabetes. (a) UMAP of pancreatic cell populations across disease states, including autoantibody-positive, healthy (control), type 1 diabetes and type 2 diabetes. Each dot represents an individual cell, coloured by cell type. (b) UMAP of CD47 expression in cells from autoantibody-positive donors, healthy control donors and donors with type 1 diabetes and type 2 diabetes. Grey dots represent cells with low or undetectable CD47 expression; purple dots indicate cells with higher expression levels. (c) Dot plot showing the relative expression of CD47 and THBS1 across different cell types and disease states. The size of the dots indicates the percentage of cells expressing each marker, while the colour intensity represents the average expression level. (d) Plasma TSP1 levels from healthy volunteers (n=27) or individuals with type 1 diabetes (n=32) and normal renal function, measured by ELISA. (e) Linear regression analysis of plasma TSP1 levels and HbA1c in individuals with type 1 diabetes. All data are mean ± SD. ***p<0.001 by Student’s t test. AAB, autoantibody-positive; PP, pancreatic polypeptide; T1D, type 1 diabetes; T2D, type 2 diabetes; UMAP, uniform manifold approximation and projection

Similar articles

References

    1. GBD 2021 Diabetes Collaborators (2023) Global, regional, and national burden of diabetes from 1990 to 2021, with projections of prevalence to 2050: a systematic analysis for the Global Burden of Disease Study 2021. Lancet 402(10397):203–234. 10.1016/S0140-6736(23)01301-6 - PMC - PubMed
    1. The European Nicotinamide Diabetes Intervention Trial (ENDIT) Group, Bingley PJ, Gale EAM et al (2006) Progression to type 1 diabetes in islet cell antibody-positive relatives in the European Nicotinamide Diabetes Intervention Trial: the role of additional immune, genetic and metabolic markers of risk. Diabetologia 49(5):881–890. 10.1007/s00125-006-0160-4 - PubMed
    1. Sosenko JM, Palmer JP, Rafkin LE et al (2010) Trends of earlier and later responses of C-peptide to oral glucose challenges with progression to type 1 diabetes in diabetes prevention trial-type 1 participants. Diabetes Care 33(3):620–625. 10.2337/dc09-1770 - PMC - PubMed
    1. Han J, Back SH, Hur J et al (2013) ER-stress-induced transcriptional regulation increases protein synthesis leading to cell death. Nat Cell Biol 15(5):481–490. 10.1038/ncb2738 - PMC - PubMed
    1. Kale A, Rogers NM (2023) No time to die-how islets meet their demise in transplantation. Cells 12(5):796–812. 10.3390/cells12050796 - PMC - PubMed

LinkOut - more resources