. 2025 Jun;31(6):1882-1894.
doi: 10.1038/s41591-025-03601-1. Epub 2025 Mar 25.

AI-guided precision parenteral nutrition for neonatal intensive care units

Affiliations

AI-guided precision parenteral nutrition for neonatal intensive care units

Thanaphong Phongpreecha et al. Nat Med. 2025 Jun.

Erratum in

  • Author Correction: AI-guided precision parenteral nutrition for neonatal intensive care units.
    Phongpreecha T, Ghanem M, Reiss JD, Oskotsky TT, Mataraso SJ, De Francesco D, Reincke SM, Espinosa C, Chung P, Ng T, Costello JM, Sequoia JA, Razdan S, Xie F, Berson E, Kim Y, Seong D, Szeto MY, Myers F, Gu H, Feister J, Verscaj CP, Rose LA, Sin LWY, Oskotsky B, Roger J, Shu CH, Shome S, Yang LK, Tan Y, Levitte S, Wong RJ, Gaudillière B, Angst MS, Montine TJ, Kerner JA, Keller RL, Shaw GM, Sylvester KG, Fuerch J, Chock V, Gaskari S, Stevenson DK, Sirota M, Prince LS, Aghaeepour N. Phongpreecha T, et al. Nat Med. 2025 Jun;31(6):2070. doi: 10.1038/s41591-025-03691-x. Nat Med. 2025. PMID: 40205201 Free PMC article. No abstract available.

Abstract

One in ten neonates are admitted to neonatal intensive care units, highlighting the need for precise interventions. However, the application of artificial intelligence (AI) in guiding neonatal care remains underexplored. Total parenteral nutrition (TPN) is a life-saving treatment for preterm neonates; however, implementation of the therapy in its current form is subjective, error-prone and resource-consuming. Here, we developed TPN2.0-a data-driven approach that optimizes and standardizes TPN using information collected routinely in electronic health records. We assembled a decade of TPN compositions (79,790 orders; 5,913 patients) at Stanford to train TPN2.0. In addition to internal validation, we also validated our model in an external cohort (63,273 orders; 3,417 patients) from a second hospital. Our algorithm identified 15 TPN formulas that can enable a precision-medicine approach (Pearson's R = 0.94 compared to experts), increasing safety and potentially reducing cost. A blinded study (n = 192) revealed that physicians rated TPN2.0 higher than current best practice. In patients with high disagreement between the actual prescriptions and TPN2.0, standard prescriptions were associated with increased morbidities (for example, odds ratio = 3.33; P value = 0.0007 for necrotizing enterocolitis), while TPN2.0 recommendations were linked to reduced risk. Finally, we demonstrated that TPN2.0 employing a transformer architecture enabled guideline-adhering, physician-in-the-loop recommendations that allow collaboration between the care team and AI.


Conflict of interest statement

Competing interests: The methods described in this manuscript are covered in the US provisional Patent 63/268,689 (WO2022256850A1; ‘Systems and methods to assess neonatal health risk and uses thereof’) approved in 2022. T.P. is a cofounder of Takeoff41. S.M. is a paid consultant for Danaher and Longitude Capital and receives a paid fellowship from Nucleate. J.H.F. is an advisor to Vitara, OvaryIt, Keriton, EmpoHealth, and Avanos; the consulting medical director of Novonate; and a cofounder for EMME. K.G.S. is a consultant for Avexegen Therapeutics, Infinant Health, mProbe and Mission Biocapital. M.S.A. is a member of the Scientific Advisory Board of Cytonics Inc. and AfaSci Research Laboratories and is a paid consultant for Syneos Health. D.K.S. is a member of the Clinical Advisory Board of Maternica Therapeutics. M.S. is a member of the Scientific Advisory Board of Exagen and Aria Pharmaceuticals and is a shareholder at Somnics. N.A. is a member of the Scientific Advisory Boards of January AI, Parallel Bio and WellSim Biomedical Technologies, is a cofounder of Takeoff41 and is a paid consultant for MaraBio Systems. The other authors declare no competing interests.

Figures

Fig. 1
Fig. 1. TPN ordering is a repetitive, time-consuming and error-prone process, with many stakeholders involved.
a, The current TPN ordering workflow involves a multidisciplinary team collaborating to determine the appropriate daily TPN composition for each patient. A medical team first evaluates the patient’s laboratory test results and clinical characteristics and place an order. The order is reviewed by a dietician and, if approved, by a pharmacist. Next, each bag is compounded individually, and delivered to the hospital. This process typically takes 4–12 h, and sometimes up to 24 h. In contrast, the proposed TPN2.0 model simplifies the process by automatically analyzing patient data—comprising laboratory test values and clinical characteristics—and assigning one of the 15 premade TPN formulas to them. TPN2.0 aims to streamline operations to reduce cost, error and practice variability. This is achieved by a combination of AI and standardized TPN compositions. b, Cumulative distribution of the number of days patients are on TPN shows that 50% of the patients receive TPN for up to 7 days, and 95% receive it for up to 50 days. c, Normalized mean values of TPN components by day, demonstrating the dynamic nature of TPN components.
Fig. 2
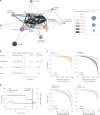
Fig. 2. A deep representation learning algorithm for data-driven prediction and standardization of TPN.
a, A VNN is used to predict TPN compositions based on patient data. The clinical characteristics include newborn characteristics, laboratory measurements and basic TPN information such as total fluid. The compressed EHR representations are obtained from the latent space of the AE fed with 14,499 EHR features including medications, observations, procedures and conditions. The VNN integrates all these inputs and maps them to 16 different TPN components, creating a high-dimensional latent representation that encompasses both prescription and patient information. These latent representations are then fed to a semisupervised iterative clustering algorithm to group similar representations together. The TPN composition of each cluster is obtained by feeding the cluster centroid to the VNN’s decoder, yielding a set of standardized TPN2.0 formulas. b, A 2D visualization of the latent representations, color-coded by cluster assignment. Each dot represents a latent patient EHR profile of that day. The black dotted path corresponds to an example from a particular patient, transitioning through different TPN2.0 clusters based on their historical EHR. Initially, TPN2.0 recommends formula C3, followed by C1, which are low-concentration bags typically used in the first few days of life. Subsequently, the recommendation switches to a more nutrient-rich formula, C7, until hyponatremia develops. In response to this, the model automatically switches the patient to formula C6, which has one of the highest sodium concentrations. Once the hyponatremia is resolved, the recommendation goes back to C1. This case showcases how the model can adjust TPN bag prescriptions based on real-time changes in patient conditions. c, TPN2.0 clusters have distinct compositions. The within-nutrient normalized composition of the formulas illustrated in the example patient’s journey. Comparison should not be made across nutrients. d, This plot visualizes the relative Pearson’s R and the number of clusters, demonstrating diminishing returns after 15, where higher numbers of clusters did not result in substantial performance gain to justify the decrease in practicality. The relative R was calculated from the ratio between R from the cluster predictions and from the model’s raw predictions.
Fig. 3
Fig. 3. TPN2.0 is validated in a second hospital and outperforms baseline Elastic Net models.
a, To validate the model developed at Stanford, we extracted a second TPN dataset from UCSF. To check data consistency, we demonstrated that TPN compositions are associated with the weights of neonates in both sites (Pearson’s R and P value). b, The Stanford team did not have access to UCSF data, and models trained at Stanford were validated independently by the UCSF team. To examine TPN2.0 performance across sites, we report the distance between a prescribed TPN and another expert’s similar TPN order as the gold standard (Methods). We also report the relative difference, which is calculated as the absolute difference between TPN2.0 and the experts’ distances, divided by that of the expert. It is presented as ‘1 − Difference’, where higher values signify higher similarity between experts and TPN2.0 performance. Error bars, s.e. Comparing these distances between the experts’ TPN and TPN2.0 reveals a high correlation at both Stanford (n = 79,790 TPN from 5,913 patients) and UCSF (n = 63,273 TPN from 3,417 patients). The model also outperforms baseline ML (Elastic Net). Data are presented as mean values ± s.e.m. c, At both sites, TPN2.0 shows similar distance to experts for all components (Pearson’s R and P value). Here, lower distances suggest consistency among experts, as seen with components like levocarnitine or multivitamins. In contrast, higher distances reflect lower performance, such as in dextrose and amino acid contents, which are due to greater variability in practice. In contrast, levocarnitine or multivitamins are mostly a binary decision with better defined guidelines. The bands represent 95% confidence intervals.
Fig. 4
Fig. 4. In a blinded study, TPN2.0 outperformed current best practice.
a, In a blinded study, physicians who regularly prescribe TPN were recruited to rank three TPN solutions: TPN2.0, TPN composition from a different patient (randomly selected) and the actual prescription developed for that patient according to current best practice. Each team member ranked each of the three solutions from 0 to 100 after a thorough chart review based on all information available in their EHR. The higher rating score indicates a more appropriate composition. b, From a total of n = 192 comparisons from ten healthcare team members, TPN2.0 received the highest experts’ rating scores. The scores are also significantly higher (Mann–Whitney U test, two-sided P value < 0.0001) than the actual prescribed TPN and random TPN. Data are presented as mean values ± s.e.m.
Fig. 5
Fig. 5. TPN2.0 recommendations are associated with lower rates of morbidities and mortality.
a, A correlation network visualizing the cosine similarity between 16 neonatal outcomes. The size of each node is proportional to the OR of developing the morbidity when the patient’s prescriptions deviated from TPN2.0. Prescriptions are considered to deviate from TPN2.0 when the average Manhattan distance between their compositions is more than the 80th percentile away. Only prescriptions before the diagnosis (up to 3 months) are included. The thickness and color of the edges are proportional to the strength of the cosine similarity; thicker and darker lines indicate higher similarity. b, ORs in patients who received prescriptions deviating from TPN2.0. Morbidities that showed a significant increase in OR include cholestasis, NEC, sepsis and mortality. The P value of the OR is obtained through a two-sided z test for the log OR and is not adjusted for multiple comparison. Dots, mean values; error bars, 95% confidence intervals. c, Survival plots depicting the difference in the rate of developing an outcome between cases and controls as the distance between TPN2.0 and the actual prescription grows. The case group consists of patients whose average distances between TPN2.0 and the actual prescriptions are beyond the 80th percentile, that is, those with prescribed TPN with composition very different from TPN2.0. The control group consists of those with distances below the 20th percentile, that is, those with prescribed TPN with very similar compositions to TPN2.0 recommendations. Lines, estimated survival probability; shading, 95% confidence intervals. The P value is obtained from log rank test. d, To demonstrate this with an example, a patient whose actual prescriptions deviated from TPN2.0 and developed cholestasis on day 64 of TPN is visualized. The difference in fat dosage is one of the main contributors to the deviation from TPN2.0 recommendations. The actual prescriptions have mostly 3 g kg−1 while TPN2.0 recommends 2 g kg−1 before the diagnosis. In past studies, restriction of TPN fat in vulnerable populations has been associated with reduced risks of cholestasis. DBili, direct bilirubin.
Fig. 6
Fig. 6. TPN2.0 by PI-transformer enables physician-in-the-loop recommendations that adhere to pharmacist guidelines.
a, A PI-transformer was developed to cluster TPN compositions over time. To predict TPN composition at time tt) for patient Pn, future data (Xt+i) is masked to prevent information leakage. The model employs a positional encoder for daily TPN to generate latent representations that the decoder combines with previous TPN data (Yti) to predict Ŷt. In pretraining, teacher forcing is used; in fine-tuning, ‘inference as training’ is applied as the decoder autoregressively processes previous predictions. During inference, the model predictions could also be replaced by actual prescriptions if needed. The predictions are further utilized to calculate TPN characteristics. b, TNP2.0 recommendations comply with pharmacist guidelines and rules. These computed values, together with ten pharmacist guidelines/physical expectations (Supplementary Table 2)—including osmolarity, dextrose concentrations and calcium phosphate solubility limits—are integrated into boundary condition losses to enforce clinical standards. TPN2.0 with PI-transformer exhibited the fewest violations among all algorithms tested (n = 79,790 prescriptions from 5,913 patients). c, The performance of TPN2.0 improves with increased physician intervention. Simulated interventions, in which 10% of the TPN2.0 recommendations that are least consistent with actual prescriptions are replaced by the actual prescriptions’ values in the decoder, further enhance performance. At 0% intervention, the model also outperforms the baseline teacher forcing method. This analysis mimics real-world scenarios where physicians modify AI recommendations, and shows that closer collaboration between AI and clinicians enhances model accuracy. Data are presented as mean values ± s.e.m. d, In one illustrative case, the model’s zinc prediction of 362 mcg kg−1 on day 1 was modified to 200 mcg kg−1 according to the actual prescription. The gray area represents the distribution of all zinc values in the data. After the intervention, the model maintained a zinc of 200 mcg kg−1 for the following 8 days, consistent with the actual prescriptions. Subsequently, the prediction shifted back to approximately 350 mcg kg−1—a change that was later followed by the physicians. This indicates the ability of the model to balance clinical judgment with the data-driven approach.
Extended Data Fig. 1
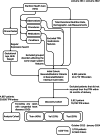
Extended Data Fig. 1. Flowchart diagram of the dataset generation process.
The data were aggregated from the EHRs at Stanford Health Care. The linkage of the two datasets allowed for a combination of nutritional data, phenotypic traits, and long-term outcome data, among others. All EHR data were mapped to the Observational Medical Outcomes Partnership (OMOP) Common Data Model (CDM) version 5.3.1, which included patient observations, procedures, medications, and conditions. Gestational age at delivery and birth weight were extracted from clinical notes in the newborns’ EHRs using regular expressions. For each newborn, their entire medical history available in the EHR corresponding to their days on TPN was extracted, including all conditions, observations, medications, and procedures, while excluding TPN medication records to avoid potential data leakage. Conditions, observations, medications, and procedures were organized by patient, date, and time of entry into the EHR system. Conditions that affect multiple organ systems were excluded. Initially, the Stanford cohort included 6,991 neonatal/pediatric patients in neonatal/pediatric intensive care units with 113,773 TPN orders recorded between January 2011 and January 2022. Of these, 5,913 patients were retained as they received their first TPN within the first 2 years of delivery, resulting in 79,790 TPN orders. EHR data were represented in a binary format for each condition, drug, procedure, and observation. The patients with congenital heart diseases were dropped for the TPN2.0 outcome comparison analysis. In addition, an independent external validation cohort was obtained from EHRs from the UCSF Hospital and Clinics and the Benioff Children’s Hospital. The UCSF EHR database contains demographics, specific lab measurements, and TPN data. This included all 3,417 patients who received their first TPN within the first 24 months of birth between October 2012 and January 2024 in the UCSF EHR Database, totaling 63,273 TPN orders.
Extended Data Fig. 2
Extended Data Fig. 2. The composition of TPN2.0 cluster representatives.
Composition of the 15 clusters identified by iterative clustering of TPN2.0’s latent representations. The ratio values (y-axis) are obtained by normalizing each component across clusters for visualization purposes only. The cluster types are divided into 7 central and 4 peripheral lines from the neonatal protocol, and 4 for the pediatric protocol.
Extended Data Fig. 3
Extended Data Fig. 3. TPN2.0 exhibited improved unexplained variability than current best practices.
a, An AE model was used to generate a latent representation of the patients, followed by clustering, in order to identify homogeneous patient groups. The model was applied to patient characteristics and lab test values. During this process, a compressed latent representation of the input is extracted. This representation is then grouped by K-means clustering. The optimal number of clusters are determined by using Silhouette scores and Within-Cluster Sum of Squares (WCSS) using the KneeLocator method. Subsequently, the variance of each TPN component within each cluster was calculated for both TPN2.0 and the actual prescriptions. b, The mean variance across all clusters (weighted by cluster size) is visualized. The scatter plot shows lower mean variances within the patients in the same group for all components in TPN2.0 compared to current best practice.
Extended Data Fig. 4
Extended Data Fig. 4. TPN2.0 performance generalizes over different sexes, races, and periods.
a, Stratification of the model performance as presented in Fig. 3b by sexes and races indicates that the high performance applies across different subpopulations. The corresponding powers of the stratified analyses are 1 for both male and female at the significance level (α) of 0.0001, and 1 for Asian (α = 0.0001), 0.93 for African American (α = 0.001), 0.94 for Native (α = 0.01), 1 for white (α = 0.0001), and 0.89 for race unknown (α = 0.0001). The race ‘Native’ includes both Native Hawaiian or Other Pacific Islander and American Indian or Alaska Native due to the insufficient numbers of population from these races in our cohort. Refer to Supplementary Table 1 for the number of data points in each group. Data are presented as mean values +/− SEM. b, The model performance with experts as described in Fig. 3c with these results obtained from a time-based cross validation instead of a random train-test split. In each cross-validation, the model was trained on data from a time period that did not overlap with the test period. For example, in the last plot, the model is trained on data from January 1st 2011 to August 31st 2017, and it is tested on TPN orders from September 1st 2017 to January 31st 2022. The high correlation across all periods suggests that potential changes in clinical guidelines from different periods did not meaningfully impact the model performance.
Extended Data Fig. 5
Extended Data Fig. 5. TPN2.0 outperforms current best-practices, even when compared to a mixture-of-experts approach derived from individual expert ratings aggregated at the patient level.
a, Instead of analyzing rating scores from an individual expert for each patient, we evaluate the blinded study by aggregating scores at the patient level, and only include those rated by at least 3 experts. This resulted in a total of 23 comparison pairs. The bar chart showing the aggregated rating scores for TPN2.0, prescribed TPN, and random TPN formulations still shows that TPN2.0 receives the highest ratings, significantly outperforming both the prescribed TPN from best practice and random formulations. Error bars represent standard errors across the aggregated scores. Data are presented as mean values +/− SEM. b, Furthermore, looking at the individual patient’s averaged rating score, each represented by a dot in the scatter plot, TPN2.0 was rated either about the same as prescribed TPN, or in most cases, higher than them. These results support the preference for TPN2.0, even when evaluated using a method that more closely reflects clinical best practices.
Extended Data Fig. 6
Extended Data Fig. 6. TPN2.0 reduces race-specific variance, particularly in populations with adverse outcomes.
The variance of the TPN composition values across races is calculated for both TPN2.0 and actual prescriptions. The calculation is stratified for patients with specific adverse outcomes and for those who were not diagnosed with any of the 16 adverse outcomes or congenital heart diseases (baseline) listed in Supplementary Table 3. The results indicate that actual prescriptions are not only associated with higher variance across races in baseline patients compared to TPN2.0 (~2x), but more so (>~4x) in patients with adverse outcomes. Refer to Supplementary Table 1 for the number of data points in each group. Data are presented as mean values +/− SEM.
Extended Data Fig. 7
Extended Data Fig. 7. Fraction of TPN compositions that adhere to each criterion of pharmacist/clinical guidelines or physical expectations.
The limits for these criteria are listed in Supplementary Table 2. Here, physics-informed (PI) transformer vastly outperforms normal transformer, VNN, and baseline Elastic Net.
Extended Data Fig. 8
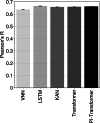
Extended Data Fig. 8. Physics-informed (PI) transformer accommodates safety criterion while maintaining accuracy comparable to other algorithms.
Comparison of the performance (n = 79,790 TPN from 5,913 patients) of different deep learning architectures, including VNN, Long Short-Term Memory (LSTM), Kolmogorov–Arnold Networks (KAN), transformers, and PI-transformer, all showing similar performance. The performance is a Pearson’s R of TPN2.0 composition vs. the actual prescription composition. Data are presented as mean values +/− SEM.
Extended Data Fig. 9
Extended Data Fig. 9. Feature attribution analysis reveals the features driving the predictions of the transformer-based TPN2.0.
a, A heatmap of average gradient-based SHAP (SHapley Additive exPlanations) values visualizes global feature importance for each selected feature and cluster. The SHAP values are derived from 7,500 randomly and uniformly selected TPN orders. The clusters are organized into neonatal central line, peripheral, and pediatric protocol clusters. For each cluster, only SHAP values from samples assigned to that cluster are considered. Color intensity represents the magnitude of SHAP values, with red indicating positive contributions and blue indicating negative contributions to cluster assignment. For example, assignment to cluster 1 of the central line is heavily influenced by serum creatinine levels, while cluster 4 relies more on serum calcium levels. Importantly, the model does not heavily depend on race or sex for cluster assignments, minimizing demographic-based biases. b, Force plots demonstrate how features drive cluster assignments at a local, patient level. The top plot shows a sample assigned to cluster 2 of the central line, where features like birth weight, gestational age, and serum bicarbonate exert strong positive influences, increasing the assignment probability to 0.43 (~3.5x the base value of 0.123). In contrast, the bottom plot shows a sample with a reduced probability of 0.10 for cluster 2 due to negative contributions from low serum calcium, serum sodium, gestational age, and birth weight. These examples highlight the complexity of the model’s predictions at an individual level, revealing feature-specific contributions that may not be fully captured by global explanations.
Extended Data Fig. 10
Extended Data Fig. 10. TPN2.0 with physician-in-the-loop recommendations leads to performance improvement for every physician.
a, The number of TPN orders prescribed by each physician in the dataset. b, Collaboration with TPN2.0 leads to improved performance for every individual physician. Figure 6c previously shows that the model’s performance improves with increasing levels of physician intervention, where physicians adjust TPN2.0’s recommendations in a simulated scenario. Here, we show that the improvement applies to every single individual. Each dot in the pair plot represents the average correlation of TPN2.0 to all actual prescription by a physician.

References

    1. Granger, C. L., Okpapi, A., Peters, C. & Campbell, M. G578(P) Potentially preventable unexpected term admissions to neonatal intensive care (NICU). Arch. Dis. Child.100, A263–A263 (2015).
    1. Harrison, W. & Goodman, D. Epidemiologic trends in neonatal intensive care, 2007–2012. JAMA Pediatr.169, 855–862 (2015). - PubMed
    1. Pang, E. M. et al. Evaluating epidemiologic trends and variations in NICU admissions in California, 2008 to 2018. Hosp. Pediatr.13, 976–983 (2023). - PMC - PubMed
    1. Martin, J. A. & Osterman, M. J. K. Shifts in the distribution of births by gestational age: United States, 2014–2022. Natl Vital Stat. Rep.73, 1–11 (2024). - PubMed
    1. Gregory, G. A., Kitterman, J. A., Phibbs, R. H., Tooley, W. H. & Hamilton, W. K. Treatment of the idiopathic respiratory-distress syndrome with continuous positive airway pressure. N. Engl. J. Med.284, 1333–1340 (1971). - PubMed