. 2025 Apr;21(4):341-360.
doi: 10.1038/s44320-025-00093-6. Epub 2025 Mar 25.

Persistent epigenetic memory of SARS-CoV-2 mRNA vaccination in monocyte-derived macrophages

Affiliations

Persistent epigenetic memory of SARS-CoV-2 mRNA vaccination in monocyte-derived macrophages

Alexander Simonis et al. Mol Syst Biol. 2025 Apr.

Abstract

Immune memory plays a critical role in the development of durable antimicrobial immune responses. How precisely mRNA vaccines train innate immune cells to shape protective host defense mechanisms remains unknown. Here we show that SARS-CoV-2 mRNA vaccination significantly establishes histone H3 lysine 27 acetylation (H3K27ac) at promoters of human monocyte-derived macrophages, suggesting epigenetic memory. However, we found that two consecutive vaccinations were required for the persistence of H3K27ac, which matched with pro-inflammatory innate immune-associated transcriptional changes and antigen-mediated cytokine secretion. H3K27ac at promoter regions were preserved for six months and a single mRNA booster vaccine potently restored their levels and release of macrophage-derived cytokines. Interestingly, we found that H3K27ac at promoters is enriched for G-quadruplex DNA secondary structure-forming sequences in macrophage-derived nucleosome-depleted regions, linking epigenetic memory to nucleic acid structure. Collectively, these findings reveal that mRNA vaccines induce a highly dynamic and persistent training of innate immune cells enabling a sustained pro-inflammatory immune response.

Keywords: Epigenetic Memory; G-quadruplex; H3K27ac; SARS-Cov-2 mRNA Vaccination; Trained Innate Immunity.


Conflict of interest statement

Disclosure and competing interests statement. The authors declare no competing interests.

Figures

Figure 1
Figure 1. Cytokine release in macrophages following SARS-CoV-2 mRNA vaccination.
(A) Graphical illustration of the working hypothesis. (B) Study design: Blood samples from healthy donors were collected in a longitudinal manner for monocyte isolation, followed by differentiation to macrophages by cultivation with M-CSF and used for downstream applications including ex vivo stimulation experiments, RNA-seq- and CUT&RUN analyses. Samples were collected prior (t0) and 2 weeks after first vaccination (t1), 2 weeks after second vaccination (t2), which was applied 4 weeks after the first vaccination and 10 weeks after the second vaccination (t3). The upper graph illustrates IL-1β secretion at different time points upon stimulation with SARS-CoV-2 spike protein (SP) as shown in previous studies. (C) Monocytes were isolated by CD14+ selection from peripheral blood mononuclear cells (PBMCs). Cells were seeded and incubated in the presence of M-CSF for 5 days. Differentiated macrophages were stimulated with ssRNA (t0: n = 35, t1: n = 28; t2: n = 42; t3: n = 26), Zymosan (t0: n = 35, t1: n = 28; t2: n = 43; t3: n = 26) (D) or Pam3Csk4 (t0: n = 35, t1: n = 28; t2: n = 44; t3: n = 33) (E) for 4 h. IL-1β secretion was quantified by ELISA. For statistical analysis, one-way ANOVA with Dunnett’s multiple comparison test comparing t1–t3 to t0 was used. (F) Monocyte-derived macrophages from unvaccinated (t0) (gray) and vaccinated individuals (t2) (red) were generated, stimulated with SP (t0: dark gray dots; t2: dark red dots) or left unstimulated (t0: light gray dots; t2: light red dots) as described in (C). Concentrations of TNF, IL-36 (G), MIP-1-α (CCL3) (H), and CCL20 (I), were measured by multiplex analyses. For statistical analysis, two-way ANOVA with Sidak’s multiple comparison analysis was used. Box plots indicate the median, the upper and lower quartile and the minimum and maximum values. Shown data points represent the technical mean of an independent experiment. P values less than 0.05 were considered statistically significant. Source data are available online for this figure.
Figure 2
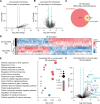
Figure 2. Trancriptomic changes in macrophages determined with RNA-sequencing.
(A) Volcano plot showing differentially expressed genes (gray dots) in SP-stimulated macrophages (n = 6) compared to unstimulated macrophages (n = 6) at t0 for unvaccinated (A) and vaccinated (t2) (B) individuals. Negative log10 adjusted P values are plotted against the log2 fold change. Downregulated genes are depicted with negative log2 fold-change values on the left side of the plot, whereas upregulated genes are represented by positive log2 fold-change values on the right side. Dotted lines indicate log2 fold-change ±1 and −log10 adjusted P values of 1. Genes were considered differentially expressed if they showed a log2 (fold change) > 1 and were below an FDR of 0.05. (C) Venn diagram showing number of differentially expressed genes (DEGs) in monocyte-derived macrophages of unvaccinated (blue) (n = 6) and vaccinated (red) (n = 6) individuals upon SP stimulation compared to unstimulated cells. The red color represents the number of DEGs unique to vaccinated individuals, while the blue color indicates DEGs unique to unvaccinated individuals. The yellow color highlights the overlapping DEGs between the two groups. Circle sizes of the venn diagram correspond to the number of genes. (D) Heatmap indicating DEG patterns comparing SP stimulation of monocyte-derived macrophages from unvaccinated (n = 6) or vaccinated (t2) (n = 6) individuals. Gene expression levels (log2 normalized expression values) are color-coded as indicated. (E) Gene ontology (GO) enrichment analysis, based on DEGs of monocyte-derived macrophages from vaccinated (red) (n = 6) individuals compared to unvaccinated individuals (n = 6) after stimulation with SP. P adjusted values are indicated (color code) and sizes of the circles represent number of DEGs (count). Gene ratio (x axis) indicate the percentage of the number of genes present in this GO term over the total number of genes in this category. Data are shown for the top 15 biological processes ranked by adjusted P values. The P value cutoff was 0.05 by permutation, (using the default values in clusterProfiler), for genes rank ordered by fold change (log2). (F) Volcano plot showing DEGs in SP-stimulated macrophages from vaccinated individuals (n = 6) at t2 compared to stimulated cells from unvaccinated individuals (n = 6). Negative log10 adjusted P values are plotted against the log2 fold change. Selected genes are labeled. Genes were considered differentially expressed if they showed a fold change (log2) > 1 and were below an FDR of 0.05.
Figure 3
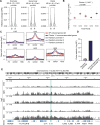
Figure 3. Vaccination induces an increase and sustained persistence of H3K27ac at gene promoters.
(A) Genome browser view of 60 mb of chromosome 9, displaying ratio (log2) of tx over t0 mean H3K27ac coverage across the time points. (B) Distribution of H3K27ac coverage ratios (log2) in peaks of promoters (n = 17,026) (1 kb upstream to 250 bp downstream of transcription start sites [TSS]) (B), gene bodies (n = 19,583) (251 bp downstream of TSS to transcription end sites [TES]) (C) and distal regions (n = 19,315) (1 kb to 100 kb away from TSS and TES) (D) across tx relative to t0. (BD) All distribution comparisons are significantly different (P < 0.001) (see Dataset EV6). Median difference (MD) between the t4/t0 and t1/t0 ratio is indicated for all three genomic regions. (E) H3K27ac coverage ratios (log2) in peaks of promoters is shown for t4 compared to t0 for promoters, gene bodies and distal genes. MD is indicated between gene bodies (G.B.) and promoters. All distribution comparisons are significantly different (P < 0.0001). P values were calculated using RM One-way ANOVA with Tukey’s multiple comparison test. P values less than 0.05 were considered statistically significant. (F) G-quadruplex DNA coverage in H3K27ac peaks located in annotated macrophage-specific accessible chromatin in promoters, gene bodies, distal regions. Source data are available online for this figure.
Figure 4
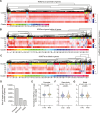
Figure 4. Gene clusters with similar H3K27ac alterations can be identified at promoters across different vaccination time points.
Unsupervised identification of gene clusters exhibiting similar H3K27ac alterations across vaccinations at promotors (A) gene body (B) and distal to genes (C). (D) Size of largest gene clusters found in unsupervised hierarchical clustering of genes related to H3K27ac. (EG) Comparative t1 vs t4 H3K27ac coverage ratios (log2) relative to t0 in promoters (n = 8417) (E), gene bodies (n = 3606) (F) and distal regions (n = 2433) (G). The median difference (MD) between the t4/t0 and t1/t0 ratios is shown for each genomic region. P values were calculated by using a Wilcoxon test. Values were highly significant (P < 0.0001) for all comparisons. P values less than 0.05 were considered statistically significant. Source data are available online for this figure.
Figure 5
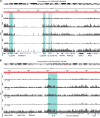
Figure 5. H3K27ac in promoters of immune associated genes of Cluster 1.
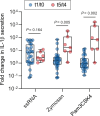
(A) Circos plot of selected immune-related terms identified in Cluster 1 (H3K27ac in promoters), illustrating the overlap of distinct genes across various GO terms. Dark red semicircles represent genes shared among multiple GO terms, whereas genes uniquely associated with specific GO terms are highlighted in light red. Individual genes of interest, including IL1B, IL-18, and SYK, are specifically marked as indicated. (B) G-quadruplex DNA from accessible chromatin of macrophages and its coverage in H3K27ac peaks located in promoters of immune genes part of cluster 1, and in matched randomized promoter sets. (C) Genome browser views of various chromosomal segments, displaying ratio (log2) of tx over t0 mean H3K27ac coverage across the time points. (D) Monocytes at t4 (n = 7; yellow) and t5 (n = 7; red) were isolated by CD14+ positive selection from PBMCs. Cells were seeded and incubated in the presence of M-CSF for 5 days. Differentiated cells were stimulated with ssRNA, Zymosan or Pam3Csk4 for 4 h. IL-1β secretion was quantified by ELISA. For statistical analysis, a multiple unpaired t test was used. Box plots indicate the median, the upper and lower quartile and the minimum and maximum values. Shown data points represent the technical mean of an independent experiment. P values less than 0.05 were considered statistically significant. Source data are available online for this figure.
Figure EV1
Figure EV1. Inflammasome dependent secretion of IL-1β in macrophages following vaccination.
(A) Monocytes were isolated by CD14+ selection from blood samples from unvaccinated (t0) (n = 6) (gray) and vaccinated individuals (t2) (n = 6) (red) and seeded and incubated in the presence of M-CSF for 5 days. Differentiated macrophages were stimulated with SP (t0: dark gray dots; t2: dark red dots) or left unstimulated (t0: light gray dots; t2: light red dots). Concentrations of CCL4, CXCL1 (B), CCL7 (C), CXCL13 (D) and CXCL10 (E), were measured by multiplex analyses. For statistical analysis, two-way ANOVA with Sidak’s multiple comparison analysis was used. Box plots indicate the median, the upper and lower quartile and the minimum and maximum values. (F) Monocyte-derived macrophages from donors before (t0) and 2 weeks after second vaccination (t2) were generated as described in (A). Differentiated macrophages were stimulated with ssRNA, Zymosan (G) or Pam3Csk4 (H) for 4 h in the presence of MCC950 (10 µM) (n = 20), KINK-1 (5 µM) (n = 10) or left untreated. IL-1β secretion was quantified by ELISA. For statistical analysis, one-way ANOVA with Dunnett’s multiple comparison test comparing MCC950/KINK-1-treated cells to untreated cells was used. Box plots indicate the median, the upper and lower quartile and the minimum and maximum values. Shown data points represent the technical mean of an independent experiment. P values less than 0.05 were considered statistically significant.
Figure EV2
Figure EV2. H3K27ac coverage across various gene regions and clusters.
(A) Distribution of normalized (counts per million) H3K27ac coverage in peaks of promoters (1 kb upstream to 250 bp downstream of transcription start sites [TSS]) (left), gene bodies (251 bp downstream of TSS to transcription end sites [TES]) (middle) and distal regions (1 kb to 100 kb away from TSS and TES) (right). All distribution comparisons are significantly different (P < 0.0001). P values were calculated using a Wilcoxon test. P values less than 0.05 were considered statistically significant. Median difference (MD) between t4 and t0 is indicated for all three genomic regions. (B) H3K27ac coverage shown as fold change (log2) across time points (t1-t5) relative to t0 for all genes part of Cluster 1. (C) Fold change of H3K27ac read coverage in tx relative to t0 in H3K27ac peaks overlapping with selected gene promoter from SP-stimulated genes (n = 576), Cluster 1 immune-associated genes (n = 333), Random promoter 1 (n = 333), Random promoter 2 (n = 333), Random promoter 3 (n = 333). (D) Fisher statistic (−log10P) of H3K27ac peaks in SP-induced gene promoter overlapping with H3K27ac peaks in Cluster 1 immune gene promoter or H3K27ac peaks in random promoter. Error bar indicates standard deviation of the fisher statistic from the 3 randomly distributed H3K27ac peaks in all annotated promoters. (E) Genome browser view of 1000 kb of chromosome 2, displaying ratio (log2) of tx over t0 mean H3K27ac coverage across the time points.
Figure EV3
Figure EV3. H3K27ac coverage across different vaccination time points.
(A) Genome browser view of 1000 kb of chromosome 12 and 9 (B), displaying ratio (log2) of tx over t0 mean H3K27ac coverage across the time points.
Figure EV4
Figure EV4. Cytokine release before and after the third dose booster vaccination.
FoId change of L-1β release upon stimulation with ssRNA, zymosan or Pam3CSK4 between t1/t0 (n = 28) (blue) and t5/t4 (n = 7) (red). For statistical analysis, a multiple unpaired t test was used. Box plots indicate the median, the upper and lower quartile and the minimum and maximum values. Shown data points represent the technical mean of an independent experiment.

References

    1. Baden LR, El Sahly HM, Essink B, Kotloff K, Frey S, Novak R, Diemert D, Spector SA, Rouphael N, Creech CB et al (2021) Efficacy and safety of the mRNA-1273 SARS-CoV-2 vaccine. New Engl J Med 384:403–416 - PMC - PubMed
    1. Biffi G, Tannahill D, McCafferty J, Balasubramanian S (2013) Quantitative visualization of DNA G-quadruplex structures in human cells. Nat Chem 5:182–186 - PMC - PubMed
    1. Cheong JG, Ravishankar A, Sharma S, Parkhurst CN, Grassmann SA, Wingert CK, Laurent P, Ma S, Paddock L, Miranda IC et al (2023) Epigenetic memory of coronavirus infection in innate immune cells and their progenitors. Cell 186:3882–3902.e3824 - PMC - PubMed
    1. Esain-Garcia I, Kirchner A, Melidis L, Tavares RCA, Dhir S, Simeone A, Yu Z, Madden SK, Hermann R, Tannahill D et al (2024) G-quadruplex DNA structure is a positive regulator of MYC transcription. Proc Natl Acad Sci USA 121:e2320240121 - PMC - PubMed
    1. Esnault C, Magat T, Zine El Aabidine A, Garcia-Oliver E, Cucchiarini A, Bouchouika S, Lleres D, Goerke L, Luo Y, Verga D et al (2023) G4access identifies G-quadruplexes and their associations with open chromatin and imprinting control regions. Nat Genet 55:1359–1369 - PubMed

MeSH terms