. 2025 May;7(5):1018-1033.
doi: 10.1038/s42255-025-01253-6. Epub 2025 Mar 25.

Haem biosynthesis regulates BCAA catabolism and thermogenesis in brown adipose tissue

Affiliations

Haem biosynthesis regulates BCAA catabolism and thermogenesis in brown adipose tissue

Dylan J Duerre et al. Nat Metab. 2025 May.

Abstract

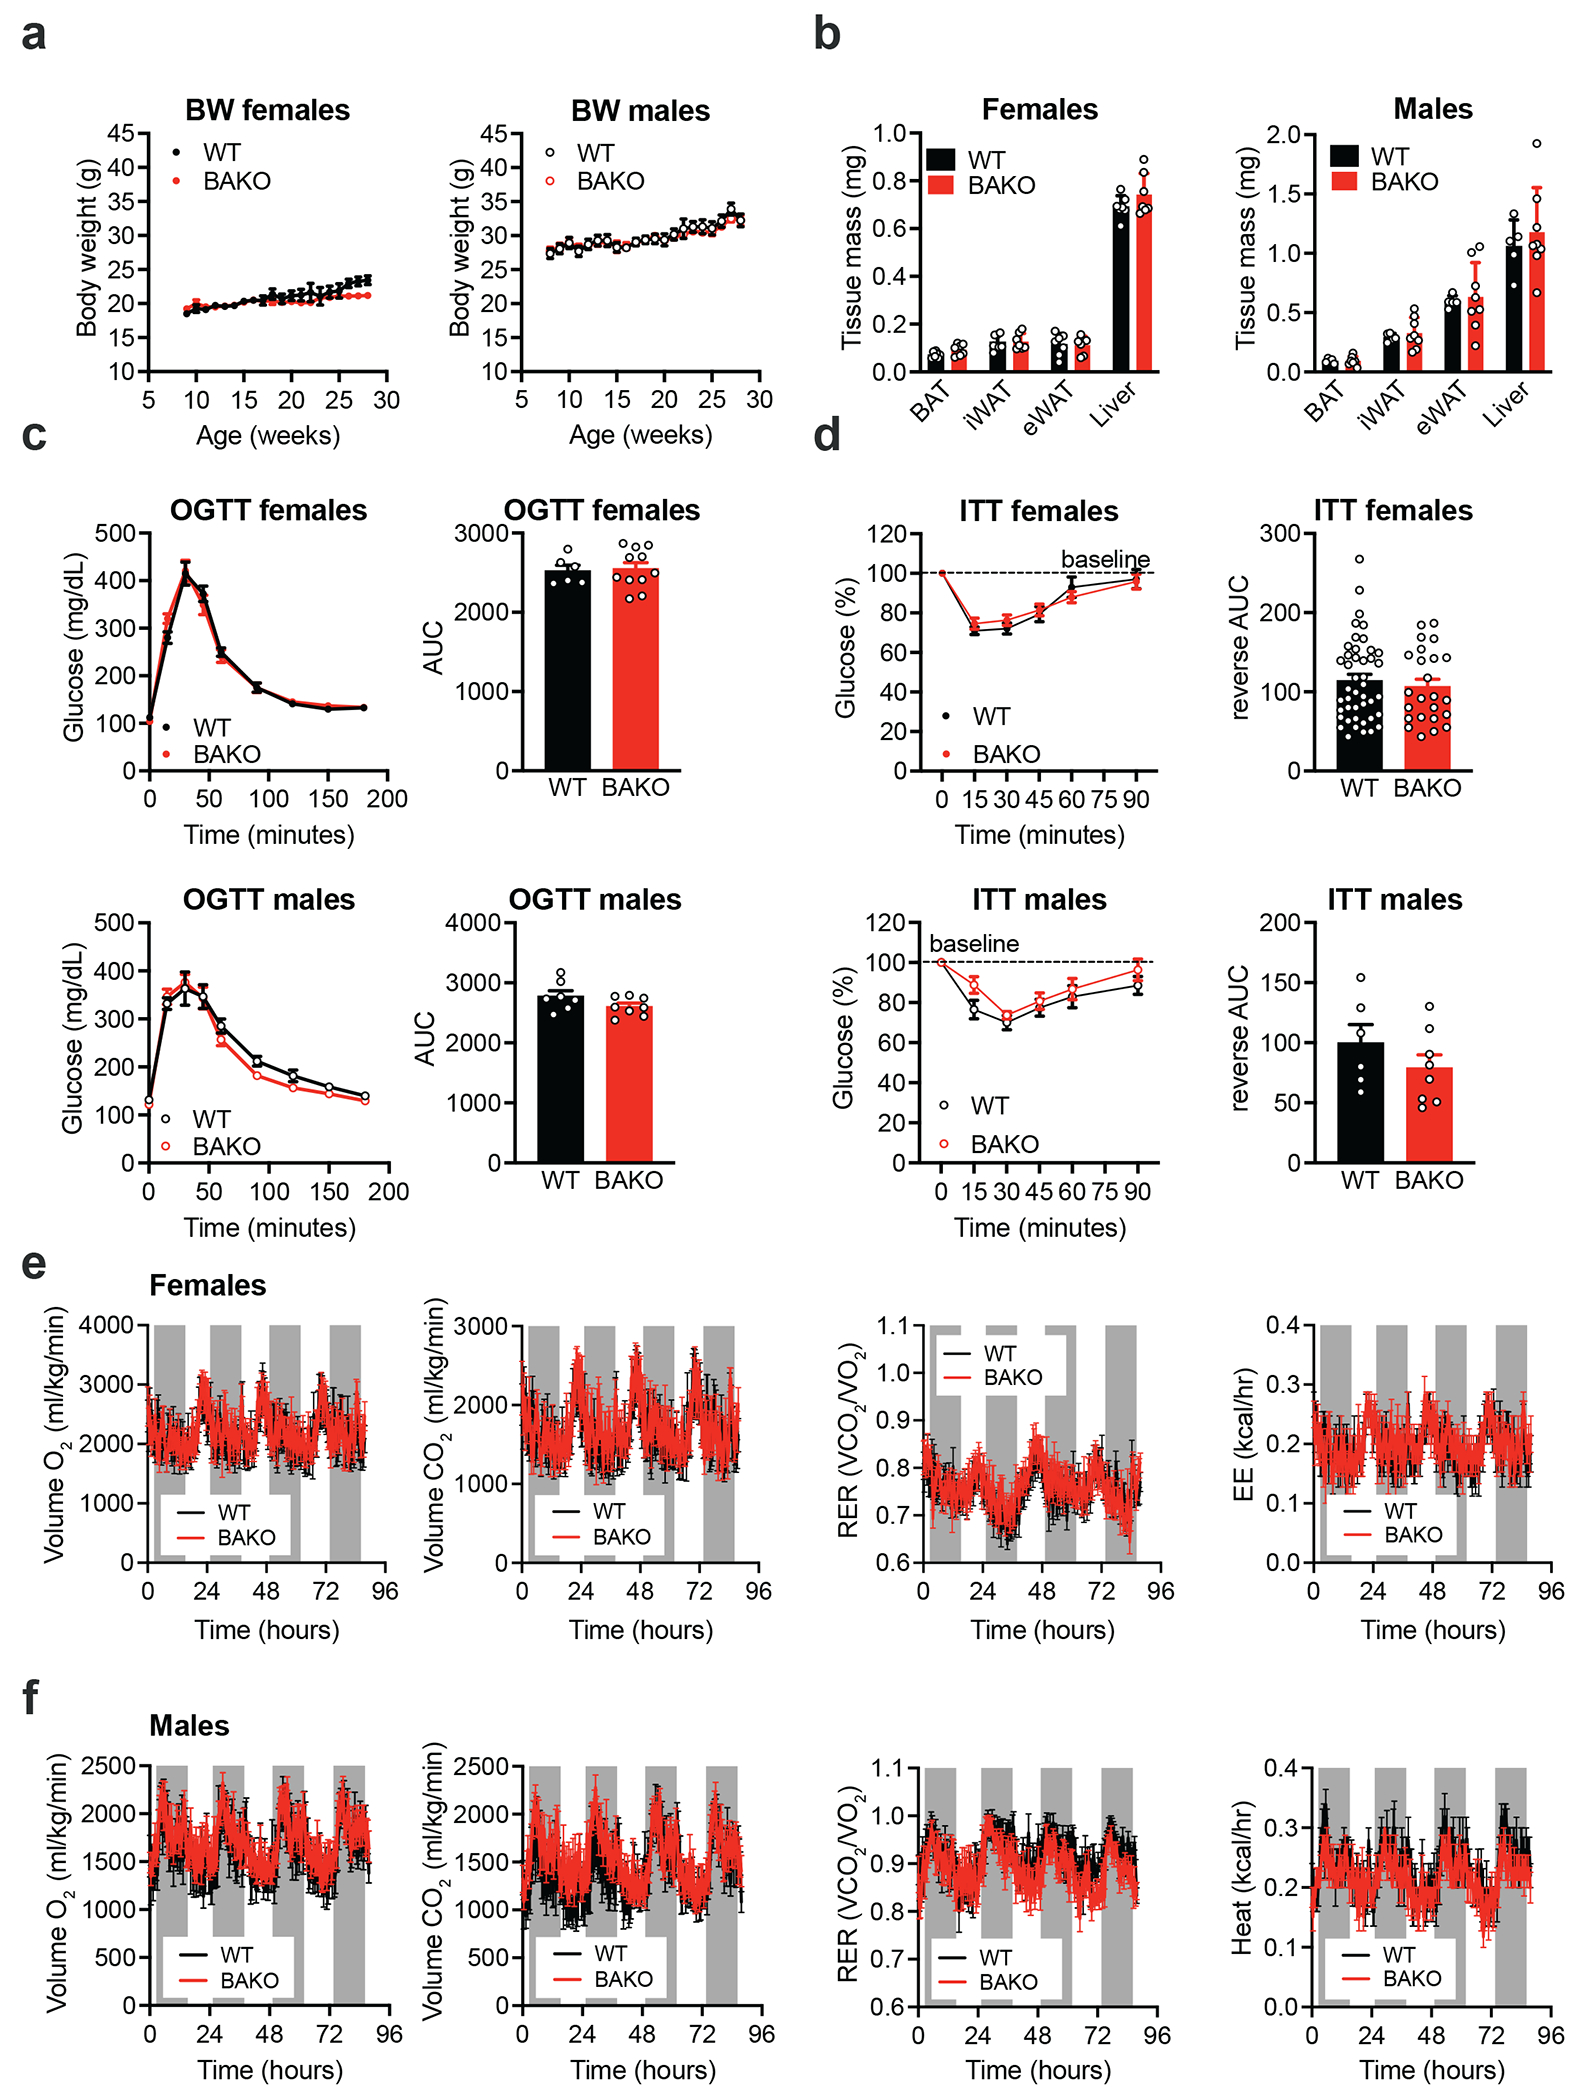
The distinctive colour of brown adipose tissue (BAT) is attributed to its high content of haem-rich mitochondria. However, the mechanisms by which BAT regulates intracellular haem levels remain largely unexplored. Here we demonstrate that haem biosynthesis is the primary source of haem in brown adipocytes. Inhibiting haem biosynthesis results in an accumulation of the branched-chain amino acids (BCAAs) valine and isoleucine, owing to a haem-associated metabolon that channels BCAA-derived carbons into haem biosynthesis. Haem synthesis-deficient brown adipocytes display reduced mitochondrial respiration and lower UCP1 levels than wild-type cells. Although exogenous haem supplementation can restore intracellular haem levels and mitochondrial function, UCP1 downregulation persists. This sustained UCP1 suppression is linked to epigenetic regulation induced by the accumulation of propionyl-CoA, a byproduct of disrupted haem synthesis. Finally, disruption of haem biosynthesis in BAT impairs thermogenic response and, in female but not male mice, hinders the cold-induced clearance of circulating BCAAs in a sex-hormone-dependent manner. These findings establish adipose haem biosynthesis as a key regulator of thermogenesis and sex-dependent BCAA homeostasis.


Conflict of interest statement

Competing interests: J.J.C. is a consultant for Thermo Fisher Scientific, 908 Devices and Seer. The other authors declare no competing interests.

Figures

Extended Data Figure 1.
Extended Data Figure 1.. Expression analysis of heme acquisition pathways in differentiating adipocytes and tissues.
a) Schematic of the eight-step mammalian heme biosynthesis pathway. ALAS1 serves as the rate limiting enzyme. Succinylacetone (SA) is a competitive inhibitor of ALAD/PBGS. Substrates (black), enzymes (red) and subcellular location (gray). Eight molecules each of succinyl-CoA and glycine are required for the synthesis of one molecule of heme. b) mRNA relative expression of Alas1 in various mouse tissues collected from 18-week-old wild type male (n = 3) and female (n = 3) mice. c) Log2 normalized counts of mRNA of genes within the heme biosynthesis pathway in differentiating primary white (yellow), brown (black), or immortalized brown (blue) adipocytes (n = 3 biological replicates per cell type per time point). d) Expression of Alas2 was not detected throughout differentiation in any adipocyte line (n = 3 biological replicates per cell type per time point). e) mRNA counts of putative heme transporters in differentiating adipocytes as described in c (n = 3 biological replicates per cell type per time point). Data shown as mean ± SD. * p<0.05 vs day 0 of differentiation of pBAT (black stars), pWAT (orange stars), or immBAT (blue stars), respectively. # p<0.05 for pBAT (black hashes) and immBAT (blue hashes) vs same time point of pWAT; one-way ANOVA with multiple comparisons and a Tukey’s post-test.
Extended Data Figure 2.
Extended Data Figure 2.. Chemical disruption of heme acquisition represses the thermogenic profile without impairing adipocyte differentiation.
a) mRNA relative expression of adipogenic genes and Alas1 in primary brown adipocytes differentiated in the presence of vehicle, succinylacetone (SA), heme-depleted serum (HDS), or SA + HDS (n = 3 biological replicates per condition). b) Primary brown adipocytes treated as described in a have comparable capacity for adipogenic differentiation. Nile red (red) and Hoechst (blue) used to stain lipid droplets and nuclei, respectively. Scale bar = 100 μm. c) Volcano plot of global protein abundance in primary brown adipocytes treated with SA relative to vehicle (n = 4 biological replicates per condition). d) Bubble plot of biological pathways enriched among significantly changed genes with a log2-fold change less than −1. Data shown as mean ± SD. p values vs. FBS, one-way ANOVA with multiple comparisons and a Tukey’s post-test.
Extended Data Figure 3.
Extended Data Figure 3.. Generation of Alas1−/− immortalized preadipocytes using CRISPR-Cas9.
a) mRNA levels of Alas1 in three representative Alas1 KO clones generated using three distinct gRNAs (n = 3 biological replicates per clone). b) Pparγ expression is not impacted by Alas1 deletion. c) Ucp1 levels are significantly reduced in all Alas1 KO clones (n = 3 biological replicates per clone for a-c). d) Protein levels of Alas1 and Ucp1 confirm loss of expression in screened clones. e) The relative abundance of numerous electron transport chain proteins is significantly reduced in Alas1 KO brown adipocytes compared to WT (n = 4 biological replicates per genotype). Data shown as mean ± SD. p values vs. WT; one-way ANOVA with multiple comparisons and a Tukey’s post-test.
Extended Data Figure 4.
Extended Data Figure 4.. Exogenous heme supplementation does not compensate for loss of heme synthesis.
a) Quantification of heme in isolated nuclei and mitochondria fractions derived from WT and Alas1 KO brown adipocytes following treatment with vehicle or 10 μM HA (n = 3 biological replicates per condition). b) Changes to the global proteome are mainly explained by genotype and active heme biosynthesis (WT vs. Alas1 KO) rather than HA supplementation and differences in the intracellular heme pool (n = 4 biological replicates per condition). c, d) Quantification of intracellular heme levels and mRNA relative expression (n = 4 biological replicates per condition) of Pparγ, Alas1, and Ucp1 in WT primary brown adipocytes treated with SA, HA, or both throughout differentiation. e) Alas1 and Ucp1 protein levels in primary brown adipocytes treated with SA, HA (1 or 10 μM), or both throughout differentiation. f) In contrast to inhibition of heme synthesis (SA), exogenous heme supplementation has limited impact on gene expression in primary brown adipocytes (n = 4 biological replicates per condition). g) ATP turnover is partially restored by 10 μM HA supplementation in Alas1 KO brown adipocytes (n = 8 biological replicates per condition). h) The contribution of the futile creatine cycle to maximal respiration is higher in Alas1 KO adipocytes treated with HA compared to WT (n = 4 biological replicates per condition). i, j) Pharmacological modulation of Rev-Erbα activity does not rescue Ucp1 expression in Alas1 KO adipocytes (n = 3 biological replicates). Data are shown as mean ± SD. p values vs. WT; one-way ANOVA with multiple comparisons and a Tukey’s post-test (a, c, d, g, h), two-tailed FDR-adjusted t-test (b), Wald test (f), and two-way ANOVA with multiple comparisons and a Tukey’s post-test (j).
Extended Data Figure 5.
Extended Data Figure 5.. Alas1 substrates and their precursors accumulate upon heme biosynthesis blockade.
a, b) Relative abundance of Alas1 substrates and their metabolic precursors in differentiated WT and Alas1 KO brown adipocytes (a; n = 4 biological replicates per genotype) and primary brown adipocytes treated with vehicle or SA throughout differentiation (b; n = 3 biological replicates). Data shown as mean ± SD. p values vs. WT or vehicle; multiple two-tailed Student’s t-test.
Extended Data Figure 6.
Extended Data Figure 6.. BCAAs fuel heme synthesis in brown adipocytes.
a) Adipose, liver, and skeletal muscle correlation of Alas1 expression with genes involved in BCAA catabolism. b) Enrichment of propionate-derived carbon labeling of TCA metabolites (n = 3 biological replicates). c) Representative images and quantification of proximity ligation assay (PLA) foci for ALAS1 and PCCA in Alas1 KO brown adipocytes (n = 30 individual cells per genotype). Scale bar = 5 μm. Data are shown as mean ± SD. p values vs. WT, one-tailed Student’s t-test.
Extended Data Figure 7.
Extended Data Figure 7.. Alas2 does not compensate for the loss of Alas1 in BAKO BAT.
a) mRNA relative expression of Alas2 in red blood cells (RBC) relative to BAT collected from female WT (n = 4) and BAKO (n = 4) mice housed at thermoneutrality. b) Protein levels of ALAS1 and ALAS2 in protein lysates from red blood cells (RBC) and PBS-perfused BAT collected from female WT and BAKO mice as described in a. Data are shown as mean ± SEM. p values vs. WT; one-way ANOVA with multiple comparisons and a Dunnett’s post-test.
Extended Data Figure 8.
Extended Data Figure 8.. BAKO mice have normal development and metabolic physiology at thermoneutrality.
a) Female (n = 16 WT, 18 BAKO) and male (n = 7 WT, 8 BAKO) BAKO mice show no significant differences in body weight compared to WT when fed standard chow and housed at thermoneutrality. b) Tissue mass of brown (BAT), inguinal (iWAT), epididymal (eWAT) white adipose, and liver are similar in WT and BAKO females (n = 7 per genotype) and males (n = 5 WT, 7 BAKO). c) Oral glucose tolerance test (OGTT) reveals no differences between WT and BAKO females (n = 6 WT, 11 BAKO) and males (n = 7 WT, 8 BAKO). d) Insulin tolerance test (ITT) shows no significant differences between WT and BAKO females (n = 20 WT, 24 BAKO) or males (n = 6 WT, 8 BAKO). e, f) Female and male indirect calorimetry measurements of O2 consumption (VO2), CO2 production (VCO2), respiratory exchange ratio (RER), and energy expenditure (EE) in WT and BAKO males and females (n = 6 per group) housed at thermoneutrality. Data are shown as mean ± SEM. Mixed effects analysis with Šídák’s multiple comparisons test (a), unpaired two-tailed t-test for tissue weights and reverse AUC, two-way ANOVA followed by Šídák’s multiple comparisons test for OGTT and IGTT.
Extended Data Figure 9.
Extended Data Figure 9.. Altered molecular signatures of BAKO BAT at thermoneutrality.
a) Volcano plot of differentially expressed genes in BAT collected from chow-fed female WT and BAKO (n = 4 per group) mice housed at thermoneutrality. b) Volcano plot of differentially abundant proteins in BAT collected from female WT and BAKO (n = 7 per group) mice. c) Heatmap of differentially expressed genes (p<0.05; |log2-FC|>0.5) in BAT from WT and BAKO mice (n = 4 per group) as described in a.
Extended Data Figure 10.
Extended Data Figure 10.. Diet-induced thermogenesis is not impaired in BAKO mice housed at thermoneutrality.
a, b) Indirect calorimetry in female (n = 10 WT, 10 KO) and male (n = 7 WT, 8 BAKO) mice reveals no significant differences in diet-induced thermogenesis between WT and BAKO mice. Data are shown as mean ± SEM or Min to Max values (RER).
Figure 1.
Figure 1.. Heme biosynthesis controls thermogenesis, mitochondrial function, and oxidative stress response.
a) Quantification of intracellular heme levels in primary brown adipocytes differentiated in the presence of FBS, heme-depleted serum (HDS), succinylacetone (SA), or HDS and SA (n = 3 biological replicates per condition). b) PPARγ, ALAS1, UCP1 and OXPHOS levels in primary brown adipocytes as described in a. c) mRNA relative expression of Ucp1 in primary brown adipocytes as described in a (n = 3 biological replicates per condition). d) Relative quantification of protein levels detected via western blot as seen in b (n = 3 biological replicates per condition). e) Quantification of intracellular heme levels in immortalized WT and Alas1−/− (KO) mature brown adipocytes (n = 4 biological replicates per genotype). f) WT and Alas1 KO brown adipocytes have comparable adipogenic potential. Nile red (red) and Hoechst (blue) used to stain lipid droplets and nuclei, respectively. Scale bar = 100 μm. g) mRNA relative expression of adipogenic and thermogenic genes in WT and KO brown adipocytes (n = 3 biological replicates per genotype). h) PPARγ, ALAS1, UCP1 and OXPHOS levels in WT and KO brown adipocytes. i) Volcano plot of global protein abundance in Alas1 KO brown adipocytes relative to WT (n = 4 biological replicates per genotype). j) Basal, uncoupled, and maximal oxygen consumption rates (OCR) of WT and Alas1 KO brown adipocytes reveals reduced mitochondrial respiration in cells lacking Alas1 (n = 8 biological replicates per genotype). k) Diagram of heme-dependent and heme-independent arms of reactive oxygen species (ROS) handling. Substrate and products (blue), reducing agents (red) and enzymes/cofactors (black). Diethyl maleate (DEM) depletes intracellular glutathione. l) Alas1 KO brown adipocytes have elevated reduced (GSH) glutathione compared to WT (n = 4 biological replicates per genotype). m) Depletion of glutathione with DEM results in significantly higher hydrogen peroxide (H2O2) levels in Alas1 KO brown adipocytes relative to WT (n = 5 biological replicates per condition). Data are shown as mean ± SD. p values vs. WT; one-way ANOVA with multiple comparisons and a Tukey’s post-test (a, c, j, n), two-tailed Student’s t-test (e, g, k, m), two-tailed FDR-adjusted t-test (i), and two-way ANOVA (n).
Figure 2.
Figure 2.. Ucp1 expression is decoupled from mitochondrial function and requires active heme biosynthesis.
a) Quantification of intracellular heme levels in WT and Alas1 KO brown adipocytes treated with vehicle or heme:arginate (HA; 1 or 10 μM) throughout differentiation (n = 4 biological replicates per condition). b) Supplementation with 10 μM HA is sufficient to restore the characteristic color of isolated mitochondria in KO brown adipocytes to those seen in WT. c) HA supplementation partially restores mitochondrial and electron transport chain protein abundance in KO cells in a dose-dependent manner (n = 4 biological replicates per condition). d) Principal component analysis (PCA) of global protein abundance in WT and Alas1 KO brown adipocytes supplemented with HA (n = 4 biological replicates per condition). e) PPARγ, ALAS1, UCP1 and OXPHOS levels in WT and Alas1 KO brown adipocytes as described in a. f) Relative mRNA expression of Pparγ, Alas1, and Ucp1 of WT and Alas1 KO brown adipocytes treated with vehicle or 10 μM HA (n = 3 biological replicates per condition). g) Basal, uncoupled, and maximal oxygen consumption rates (OCR) of WT and Alas1 KO brown adipocytes treated with HA as described in c (n = 8 biological replicates per condition). h) OCR in mitochondria isolated from WT, Alas1 KO and Alas1 KO + HA brown adipocytes before and after injection with 3 μM SBI-425 (n = 4 biological replicates per condition). i, j) Western blot and relative mRNA expression of WT and Alas1 KO adipocytes treated with vehicle or 1 μM rosiglitazone throughout differentiation (n = 3 biological replicates per condition). k, l) Western blot and relative mRNA expression of WT and Alas1 KO adipocytes treated with vehicle or 100 μM clofibrate throughout differentiation (n = 3 biological replicates per condition). Data are shown as mean ± SD. p values vs. WT (black)or KO (red) (g). One-way ANOVA with multiple comparisons and a Tukey’s post-test.
Figure 3.
Figure 3.. BCAA metabolism is functionally linked to heme biosynthesis and regulation of Ucp1 expression.
a) Relative metabolite abundance of glycine- and succinyl-CoA-generating metabolites in Alas1 KO brown adipocytes relative to WT (n = 4 biological replicates per genotype). b) mRNA relative expression of Ucp1 in WT adipocytes treated for 48 hours with glycine- and succinyl-CoA generating metabolites (n = 3 biological replicates per condition). c) Protein levels of PPARγ, ALAS1 and UCP1 in WT adipocytes as described in b. d) Quantification of intracellular branched chain amino acids (BCAAs) (n = 5 biological replicates per condition) and heme (n = 3 biological replicates per condition) in WT cells differentiated in the presence of vehicle or excess valine and isoleucine (10x basal concentrations in DMEM). e) Suppression of Ucp1 expression in SA-or propionate-treated WT adipocytes, and Alas1 KO adipocytes, is not mediated by Gpr43-dependent paracrine signaling. f) H3K14, H3K18, and H4K16 propionylation levels in vehicle- or propionate-treated WT and Alas1 KO adipocytes. Data are shown as mean ± SD. p values vs. vehicle; one-way ANOVA with multiple comparisons and a Tukey’s post-test (b) or two-tailed Students t-test (d).
Figure 4.
Figure 4.. Brown adipocytes preferentially channel propionyl-CoA into heme biosynthesis rather than TCA cycle.
a) Expression of genes involved in BCAA and propionyl-CoA metabolism correlate strongly with Alas1 expression in the adipose tissue of diversity outbred mice (n = 468 mice). b) Bubble plot of biological pathways enriched among the top 50 genes whose expression correlates with Alas1 in the adipose tissue (AT), liver (Liv), and skeletal muscle (SkM). c) Schematic of propionate-derived 13C heavy (black) or 12C light (white) carbon incorporation into 5-ALA following labeling with 3-13C propionate, with isotopologue species indicating the occurrence or absence of TCA cycle entry following conversion to succinyl-CoA. Half-filled circles indicate 1:1 stoichiometric ratio of heavy or light labeled carbon at a given position. Blue stars indicate removal from TCA cycle as CO2. Red pentagons indicate nitrogen derived from glycine. d) Total % enrichment of 5-ALA isotopologues following labeling with 3-13C propionate for 24 hours shows significant enrichment of m+3 5-ALA (n = 3 biological replicates). e) Box and whisker plot m+3/m+2 or m+3/m+1 5-ALA ratios indicate preferential channeling of BCAA-derived propionyl-CoA to Alas1 rather than first passing through the TCA cycle (n = 3 biological replicates). Data are shown as ± SD. One-way ANOVA with multiple comparisons and a Sidak’s post-test.
Figure 5.
Figure 5.. Propionyl-CoA carboxylase proximally associates with Alas1 to feed the heme biosynthesis metabolon.
a) Schematic of proposed channeling of propionyl-CoA-derived succinyl-CoA to Alas1 for heme synthesis. b) Representative images and c) quantification of proximity ligation assay (PLA) detecting association of endogenous PCCA and ALAS1 in unstimulated conditions (vehicle) or in response to glutathione depletion (DEM) or heme biosynthesis blockade (SA). Red foci indicate association within 40 nm distance, with nuclei (blue) stained with Hoechst (n = 20 cells for 2- and 6-hour, n = 30 cells for 0- and 24-hours). d) Representative images and e) quantification of PCCA and ALAS1 PLA time course in response to β3-adrenergic receptor agonist CL 316,24. (n = 30 cells per group). Data are shown as mean ± SD. p values vs. vehicle/control, one-way ANOVA with Dunnett’s multiple comparisons. Scale bar = 5 μm.
Figure 6.
Figure 6.. Impact of Alas1 deficiency on BAT function.
a) Gross appearance of BAKO BAT shows loss of distinguish brown color compared to WT BAT. b) Tissue heme levels are significantly lower in BAKO BAT compared to WT BAT (n = 7 WT, n = 5 BAKO). c) Hematoxylin & Eosin staining of BAT reveals altered lipid deposition in female, but not male, BAKO mice. Scale bar = 150 μm. d) Quantification of lipid droplet size in female and male BAT as described in c. e, f) Pathway analysis of differentially expressed genes (e) and differentially abundant proteins (f) in BAT of female BAKO mice compared to their WT littermates. Blue and red indicate relevant biological pathways that are significantly downregulated or upregulated, respectively. Data are shown as mean ± SEM. p values vs. WT, two-tailed Students t-test.
Figure 7.
Figure 7.. BAKO mice are cold intolerant.
a) Male and female BAKO mice are unable to defend core body temperature under acute cold stress (Female n = 9 WT, 7 BAKO; male n = 6 WT, 7 BAKO). b) Representative forward-looking infrared (FLIR) image of female WT and BAKO mice capturing surface body temperature at the 2-hour timepoint during acute cold challenge. c) mRNA relative expression of Ucp1 in BAT of WT and BAKO female mice after cold challenge (n = 7 WT, 5 BAKO). d) Alas1, Ucp1 and OXPHOS protein levels in BAT of WT and BAKO mice after cold challenge (n = 4 mice per group). e, f) Oxygen consumption and energy expenditure in female and male WT (n = 6 females and 5 males) and BAKO (n = 6 per sex) mice housed at 30°C in response to intraperitoneal injection of vehicle (PBS) or the β3-adrenoreceptor agonist CL 316,243. g, h) Changes in circulating BCAA levels following injection with CL 316,243 (1mg/kg) in female (n = 4 WT, 9 BAKO) and male (n = 5 WT, 7 BAKO) mice. i) BCAA clearance in ovariectomized female (n = 6 WT, 8 BAKO) mice. j) Proposed model outlining preferential channeling of carbons derived from BCAA oxidation into the heme biosynthetic pathway rather than TCA cycle. Heme supports appropriate mitochondrial respiration and the oxidative stress response. Blockade of heme biosynthesis results in propionyl-CoA accumulation, which represses transcription of Ucp1, partly via modification of histone propionylation (KPr) levels. Data are shown as mean ± SEM. * p values vs. WT or time 0 (g, h, and i), two-way ANOVA with mixed effects analysis (a, e, and f), and Sidak’s multiple comparisons test (g, h, and i).

Update of

References

    1. Pontzer H et al. Daily energy expenditure through the human life course. Science 373, 808–812, doi: 10.1126/science.abe5017 (2021). - DOI - PMC - PubMed
    1. Cypess AM et al. Identification and Importance of Brown Adipose Tissue in Adult Humans. New Engl J Medicine 360, 1509–1517, doi: 10.1056/nejmoa0810780 (2009). - DOI - PMC - PubMed
    1. Cannon B & Nedergaard J Brown adipose tissue: function and physiological significance. Physiol Rev 84, 277–359, doi: 10.1152/physrev.00015.2003 (2004). - DOI - PubMed
    1. Li X et al. Four anti-aging drugs and calorie-restricted diet produce parallel effects in fat, brain, muscle, macrophages, and plasma of young mice. Geroscience, doi: 10.1007/s11357-023-00770-0 (2023). - DOI - PMC - PubMed
    1. Miller RA, Li X & Garcia G Aging Rate Indicators: Speedometers for Aging Research in Mice. Aging Biol. 1, 20230003, doi: 10.59368/agingbio.20230003 (2023). - DOI - PMC - PubMed

Substances

LinkOut - more resources