. 2025 Mar 25;8(1):487.
doi: 10.1038/s42003-025-07894-3.

Deep learning image analysis for continuous single-cell imaging of dynamic processes in Plasmodium falciparum-infected erythrocytes

Affiliations

Deep learning image analysis for continuous single-cell imaging of dynamic processes in Plasmodium falciparum-infected erythrocytes

Sophia M Frangos et al. Commun Biol. .

Abstract

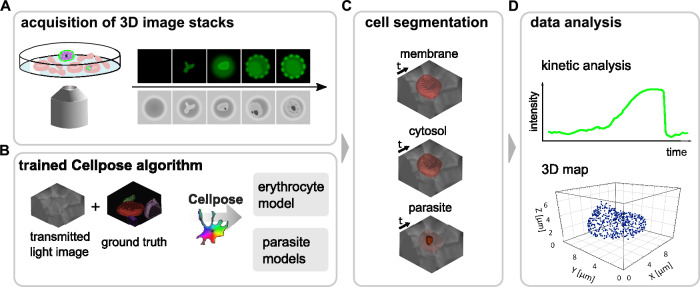
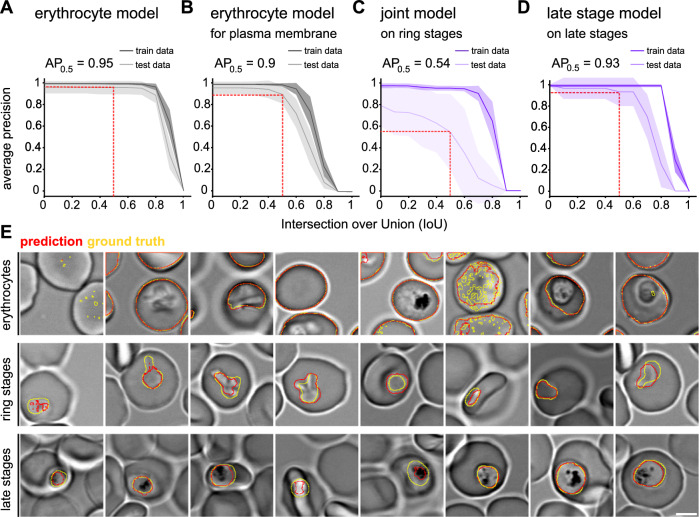
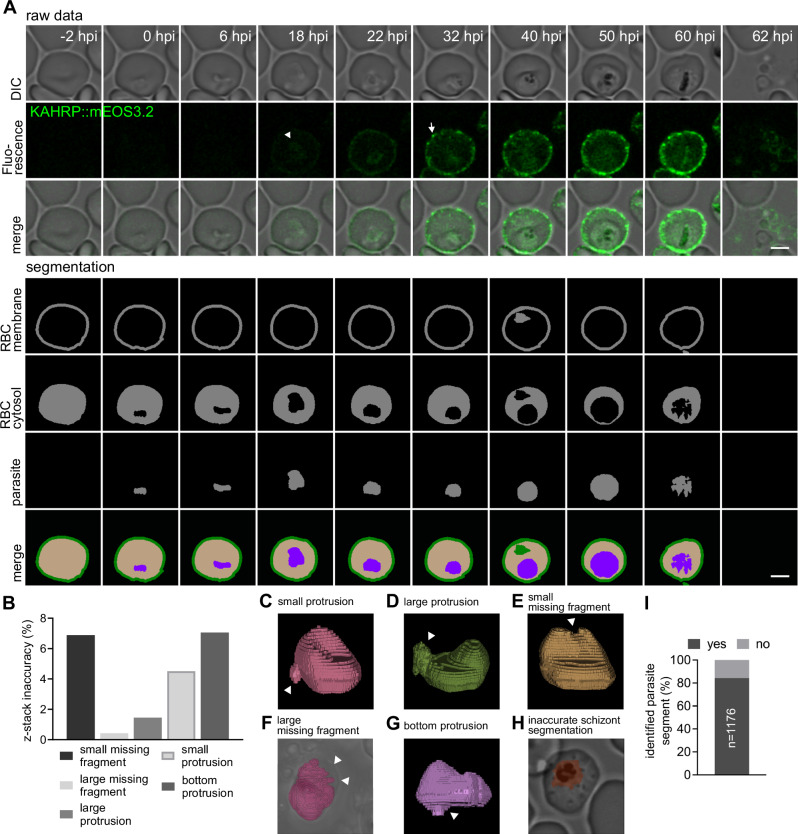
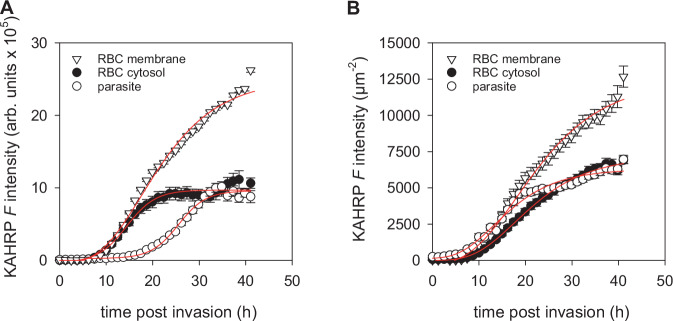
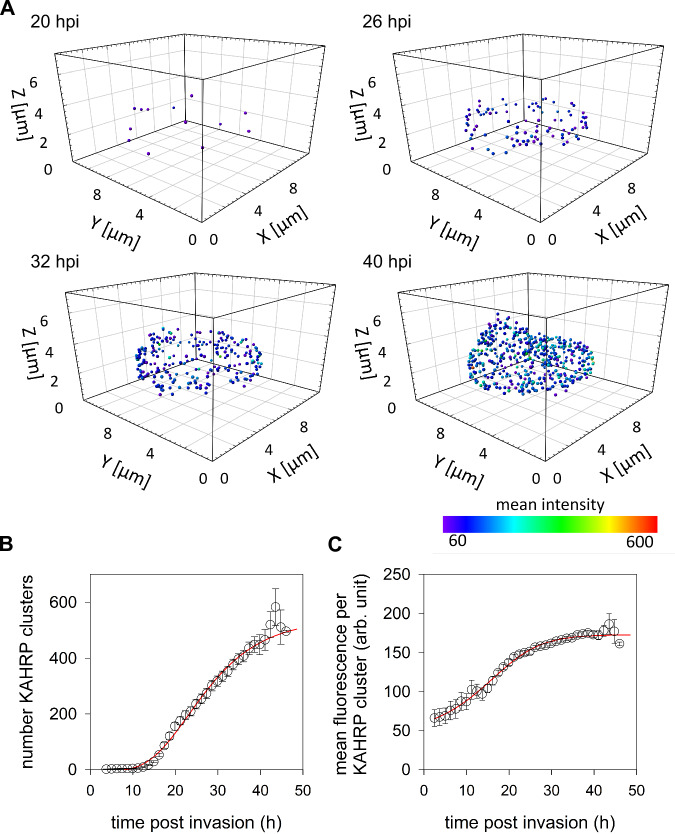
Continuous high-resolution imaging of the disease-mediating blood stages of the human malaria parasite Plasmodium falciparum faces challenges due to photosensitivity, small parasite size, and the anisotropy and large refractive index of host erythrocytes. Previous studies often relied on snapshot galleries from multiple cells, limiting the investigation of dynamic cellular processes. We present a workflow enabling continuous, single-cell monitoring of live parasites throughout the 48-hour intraerythrocytic life cycle with high spatial and temporal resolution. This approach integrates label-free, three-dimensional differential interference contrast and fluorescence imaging using an Airyscan microscope, automated cell segmentation through pre-trained deep-learning algorithms, and 3D rendering for visualization and time-resolved analyses. As a proof of concept, we applied this workflow to study knob-associated histidine-rich protein (KAHRP) export into the erythrocyte compartment and its clustering beneath the plasma membrane. Our methodology opens avenues for in-depth exploration of dynamic cellular processes in malaria parasites, providing a valuable tool for further investigations.


Conflict of interest statement

Competing interests: The authors declare no competing interests.

Figures

Fig. 1
Fig. 1. The experimental workflow for continuous single-cell imaging of dynamic processes over the entire intraerythrocytic cycle from invasion to egress.
A Acquisition of 3D-stacks of single cell images using differential interference contrast (DIC) and the fluorescence Airyscan mode. B Training a neural network based on Cellpose on DIC images of uninfected and infected erythrocytes, yielding models for erythrocytes and parasite cell recognition and segmentation. In the case of infected erythrocyte, three parasite models were trained, on ring stages, trophozoites/schizonts and all stages. C Automatic cell segmentation via the trained models, delineating the erythrocyte plasma membrane, the erythrocyte cytosol and the parasite. D Analyzing the spatial and temporal dynamics of the process under investigation throughout the replicative cycle and 3D rendering of the captured images for visualization.
Fig. 2
Fig. 2. Training dataset with ground truth annotation.
A Representative image showing erythrocytes stained with CellBrite to visualize the membrane. White lines outline the segmentation of the erythrocytes obtained by the ilastik carving workflow, which serves as ground truth. Dataset consists of n = 64 z-stacks with several cells. Top, confocal xy view, yz view. DIC xy view, yz view. Bottom, confocal xz view. DIC xz view. Scale bar, 3 μm. B Volume rendering of segmented erythrocytes. Scale bar, 3 µm Representative images showing infected erythrocytes stained with CellBrite to visualize the erythrocyte plasma membrane and the parasite inside the parasitophorous vacuole. White lines outline the segmentation of (C) a ring stage parasite and (D) a trophozoite, obtained by manual curation, which serves as ground truth. The dataset consists of n = 24 and n = 23 z-stacks of ring and trophozoite stage parasites, respectively. Scale bar, 3 μm.
Fig. 3
Fig. 3. Evaluation of different Cellpose models.
Shown are average precisions scores ± SD as a function of the intersection over union (IoU) threshold of the following models: (A) erythrocyte model; (B) erythrocyte model used to obtain the erythrocyte plasma membrane; (C) joint parasite model (trained on rings and trophozoites/schizonts) on ring stages; (D) late stage model (trained on trophozoites/schizonts) on late stages. (AD) Dark color, evaluation on training dataset; light color, evaluation on test data. AUC, area under the curve. AP0.5, average precision at 0.5 IoU, indicated with the dashed red line. E Representative xy slices depicting infected and uninfected erythrocytes at various depths within different z-stacks. DIC image with ground truth shown with yellow line and predicted masks shown with red line. Top row, erythrocyte model. Middle row, joint model on ring stages. Bottom row, late-stage model on late stages. Scale bar, 3 μm.
Fig. 4
Fig. 4. Characterization of KAHRP::mEOS3.2 parasite line.
A Schematic illustration of CRISPR-based genome editing strategy to fuse the endogenous P. falciparum kahrp gene with the coding region of mEOS3.2. Arrows, primer binding sites. Not drawn to scale. B Pherogram showing products of diagnostic PCR using gDNA from the parental P. falciparum line FCR3 (WT) and five clonal mutants expressing a KAHRP::mEOS3.2 fusion protein. A DNA size marker is indicated. (for uncropped image, see Supplementary Fig. 1). C Western analysis confirming generation of KAHRP::mEOS3.2 in the two mutant clones investigated. Molecular masses in kilo Dalton (kDa). (for uncropped image, see Supplementary Fig. 2). D Scanning electron microscopy of intact erythrocytes infected with trophozoite stage parasites of FCR3 (top) and B4 (bottom). Scale bar, 2.5 μm. Panels on the right (1, FCR3; 2, 3, B4) show magnified views of the erythrocyte surface. Scale bar, 0.5 μm. E knob density and (F) knob diameter of FCR3 and B4. Data points represent individual infected erythrocytes (mean of 7 knob diameter measurements per erythrocyte). Dashed bold line, median; pointed lines, quartiles. Data from four independent biological experiments are shown, with n = 63 for FCR3 and n = 78 cells for B4. p < 0.0001, two-tailed t-test. G Cytoadhesion efficiency. Erythrocytes infected with FCR3 and B4 and uninfected erythrocytes as control were seeded on CSA-coated plastic dishes and subsequently washed. The number of adhering cells were normalized to the initial pre-wash number for each experiment. Each data point represents the average of five replicates, obtained by analyzing different sections of the CSA-coated plastic dish. The adhesion efficiency was comparable between FCR3 and B4. Error bars, SD; Tukey’s multiple comparison.
Fig. 5
Fig. 5. Application of the segmentation strategy to continuous single-cell imaging of KAHRP export.
A Representative super-resolution time-lapse microscopic images of the B4 line expressing KAHRP::mEOS3.2 from invasion to egress. The time post invasion is indicated (hpi, hours post invasion). From top to bottom row: single z-slice DIC images; intensity projections of KAHRP::mEOS3.2 fluorescence images (generated using the Airyscan mode) summing several z-slices, with contrast being adjusted for better visualization. The white arrowhead indicates emerging KAHRP::mEOS3.2 accumulating in the parasite, The arrow indicates KAHRP fluorescence clusters at the erythrocyte membrane; DIC slice merged with KAHRP::mEOS3.2 fluorescence image (green); segmented red blood cell membrane; segmented red blood cell cytosol compartment; segmented parasite compartment; projection of segmented compartments, with red blood cell membrane (green), red blood cell cytosol (beige), and parasite (purple). Scale bar, 3 μm. B z-stack inaccuracies in erythrocyte segmentation after post-processing. A total of 1176 timepoints from 38 cells were investigated. C–H Various examples of inaccurate sample rendering (I) Percentage of parasite segments identified by the model of all time points showing a parasite. n = 1176 timepoints. Data from three independent experiments are shown.
Fig. 6
Fig. 6. Kinetics of KAHRP production and export.
A KAHRP-associated fluorescence intensity (F in arbitrary units) in the parasite, the erythrocyte cytosol compartment (RBC cytosol) and the erythrocyte membrane (RBC membrane) as a function of intraerythrocytic development. B KAHRP-associated fluorescence intensity (F in arbitrary units) per µm2 in the parasite, in the erythrocyte cytosol compartment (RBC cytosol) and the erythrocyte membrane (RBC membrane) as a function of intraerythrocytic development. A, B Note that the rate of development was normalized to that of an in vitro culture, using a method previously described by Grüring et al. (see Materials and Methods) 11. The means ± SEM of n = 26 determinations are shown. A one-parameter sigmoidal function was fit to the data points (red lines).
Fig. 7
Fig. 7. Kinetics of KAHRP cluster formation at the erythrocyte plasma membrane.
A Representative 3D projections showing formation of KAHRP clusters underneath the erythrocyte plasma membrane as a function of the adjusted time post invasion (hpi). The color code indicates fluorescence intensity. B Number of KAHRP clusters as a function of the normalized time post-invasion. Note that the rate of development was normalized to that of an in vitro culture, using a method previously described by Grüring et al. The means ± SEM of 37 independent determinations (infected cells) are shown per time point. A one-parameter sigmoidal function was fit to the data points (red line). C Mean fluorescence intensity per KAHRP cluster as a function of the normalized time post-invasion (see above).

References

    1. World Health Organization. World malaria report 2024. (Geneva, Switzerland, 2024).
    1. Lippincott-Schwartz, J, Snapp, E & Kenworthy, A Studying protein dynamics in living cells. Nat. Rev. Mol. Cell Biol.2, 444–456 (2001). - PubMed
    1. De Niz, Met al. Progress in imaging methods: insights gained into Plasmodium biology. Nat. Rev. Microbiol15, 37–54 (2017). - PubMed
    1. Miyawaki, A Proteins on the move: insights gained from fluorescent protein technologies. Nat. Rev. Mol. Cell Biol.12, 656–668 (2011). - PubMed
    1. Lemon, WC & McDole, K Live-cell imaging in the era of too many microscopes. Curr. Opin. Cell Biol.66, 34–42 (2020). - PubMed

MeSH terms

Substances

LinkOut - more resources