

A nationwide joint spatial modelling of simultaneous epidemics of dengue, chikungunya, and Zika in Colombia
- PMID: 40133812
- PMCID: PMC11934603
- DOI: 10.1186/s12879-025-10782-0
A nationwide joint spatial modelling of simultaneous epidemics of dengue, chikungunya, and Zika in Colombia
Abstract
Background: Chikungunya, and Zika emerged in the 2010s in the Americas, causing simultaneous epidemics with dengue. However, little is known of these Aedes-borne diseases (ABDs) joint patterns and contributors at the population-level.
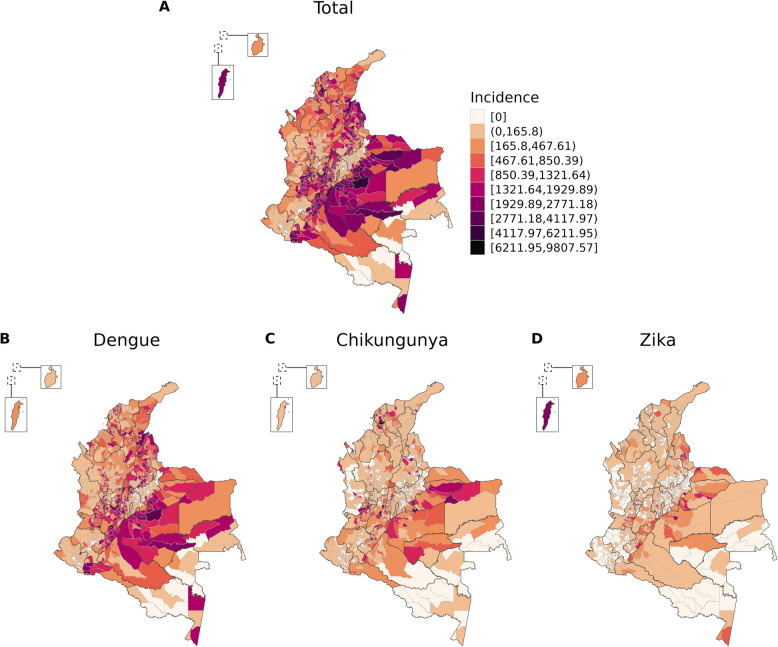
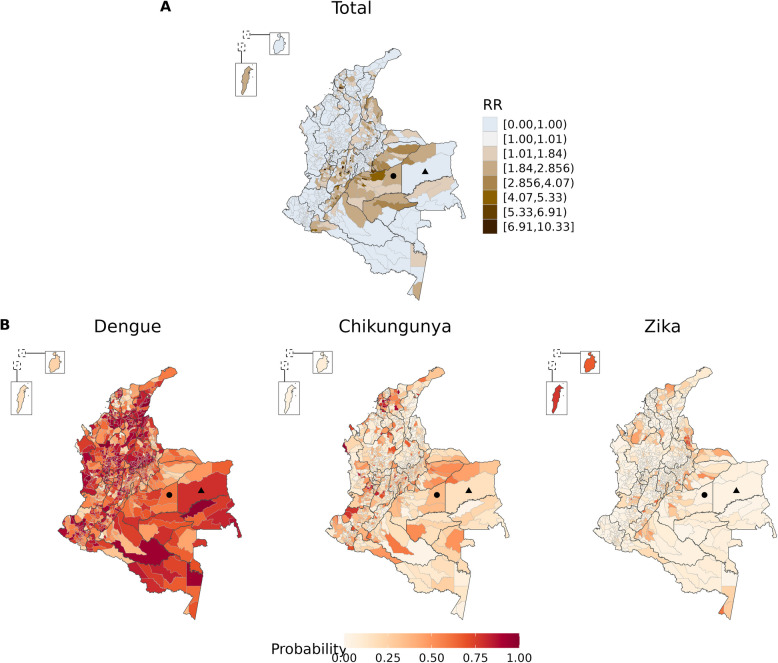
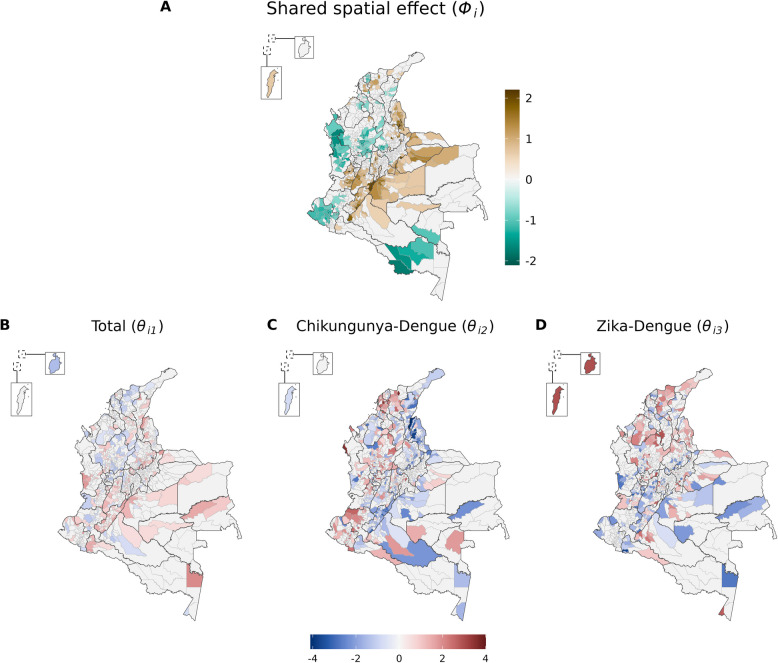
Methods: We applied a novel Poisson-multinomial spatial model to the registered cases of dengue (n = 291,820), chikungunya (n = 75,913), and Zika (n = 72,031) by municipality in Colombia, 2014-2016. This model estimates the relative risk of total ABDs cases and associated factors, and, simultaneously, the odds of presence and contributors of each disease using dengue as a baseline category. This approach allows us to identify combined characteristics of ABDs, since they are transmitted by the same mosquitoes, while also identifying differences between them.
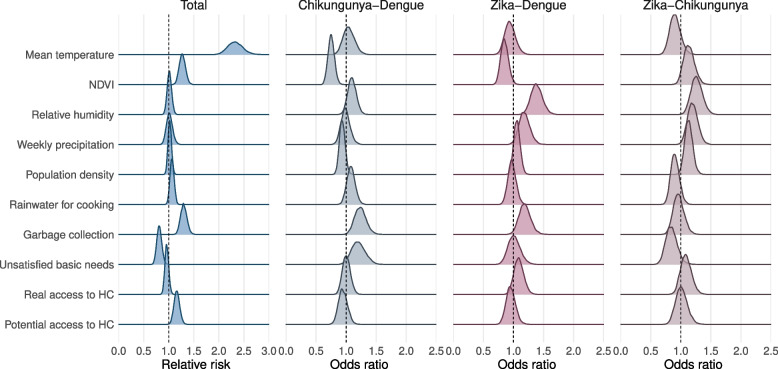
Results: We found an increased ABDs risk in valleys and south of the Andes, the Caribbean coast, and borders, with temperature as the main contributor (Relative Risk 2.32, 95% Credible Interval, CrI, 2.05-2.64). Generally, dengue presence was the most probable among the ABDs, although that of Zika was greater on Caribbean islands. Chikungunya and Zika were more likely present than dengue in municipalities with less vegetation (Odds Ratio, OR, 0.75, 95%CrI 0.65-0.86, and 0.85, 95%CrI 0.74-0.99, respectively). Chikungunya tended to be present in more socially vulnerable areas than dengue (OR 1.20, 95%CrI 0.99-1.44) and Zika (OR 1.19, 95%CrI 0.95-1.48).
Conclusions: Important differences between the ABDs were identified and can help guide local and context-specific interventions, such as those aimed at preventing cases importation in border and tourism locations and reducing chikungunya burden in socially vulnerable regions.
© 2025. The Author(s).
Conflict of interest statement
Declarations. Ethics approval and consent to participate: This study was approved by the Science and Health Research Ethics Committee (Comité d’éthique de la recherche en sciences et en santé - CERSES) of the University of Montreal, approval number CERSES-19-018-D. Consent for publication: Not applicable. Competing interests: The authors declare no competing interests.
Figures
Similar articles
-
Entomological characterization of Aedes mosquitoes and arbovirus detection in Ibagué, a Colombian city with co-circulation of Zika, dengue and chikungunya viruses.Parasit Vectors. 2021 Sep 6;14(1):446. doi: 10.1186/s13071-021-04908-x. Parasit Vectors. 2021. PMID: 34488857 Free PMC article.
-
Climatic and socio-economic factors supporting the co-circulation of dengue, Zika and chikungunya in three different ecosystems in Colombia.PLoS Negl Trop Dis. 2021 Mar 11;15(3):e0009259. doi: 10.1371/journal.pntd.0009259. eCollection 2021 Mar. PLoS Negl Trop Dis. 2021. PMID: 33705409 Free PMC article.
-
Seasonal temperature variation influences climate suitability for dengue, chikungunya, and Zika transmission.PLoS Negl Trop Dis. 2018 May 10;12(5):e0006451. doi: 10.1371/journal.pntd.0006451. eCollection 2018 May. PLoS Negl Trop Dis. 2018. PMID: 29746468 Free PMC article.
-
Human Urban Arboviruses Can Infect Wild Animals and Jump to Sylvatic Maintenance Cycles in South America.Front Cell Infect Microbiol. 2019 Jul 17;9:259. doi: 10.3389/fcimb.2019.00259. eCollection 2019. Front Cell Infect Microbiol. 2019. PMID: 31380302 Free PMC article. Review.
-
The Challenges Imposed by Dengue, Zika, and Chikungunya to Brazil.Front Immunol. 2018 Aug 28;9:1964. doi: 10.3389/fimmu.2018.01964. eCollection 2018. Front Immunol. 2018. PMID: 30210503 Free PMC article. Review.
References
-
- WHO. Dengue and severe dengue. 2024; published online April 23. https://www.who.int/news-room/fact-sheets/detail/dengue-and-severe-dengue (accessed June 6, 2024).
MeSH terms
Grants and funding
LinkOut - more resources
Full Text Sources
Medical
