. 2025 Sep 1;18(9):dmm052185.
doi: 10.1242/dmm.052185. Epub 2025 Mar 26.

Correlative 3D imaging method for analysing lesion architecture in susceptible mice infected with Mycobacterium tuberculosis

Affiliations

Correlative 3D imaging method for analysing lesion architecture in susceptible mice infected with Mycobacterium tuberculosis

Caroline G G Beltran et al. Dis Model Mech. .

Abstract

Tuberculosis (TB) is characterized by the formation of heterogeneous, immune-rich granulomas in the lungs. Host and pathogen factors contribute to this heterogeneity, but the molecular and cellular drivers of granuloma diversity remain inadequately understood owing to limitations in experimental techniques. In this study, we developed an approach that combines passive CLARITY (PACT)-based clearing with light-sheet fluorescence microscopy to visualize lesion architecture and lung involvement in Mycobacterium tuberculosis-infected C3HeB/FeJ mice. Three-dimensional rendering of post-mortem lungs revealed critical architectural features in lesion development that traditional thin-section imaging could not detect. Wild-type M. tuberculosis infection resulted in organized granulomas, with median sizes increasing to 3.74×108 µm3 and occupying ∼10% of the total lung volume by day 70 post-infection. In contrast, infection with the avirulent ESX-1 deletion mutant strain resulted in diffuse and sparsely organized CD11b recruitment (median size of 8.22×107 µm3), primarily located in the lung periphery and minimally involving the airways (0.23% of the total lung space). Additionally, we present a method for volumetric correlative light and electron microscopy, enabling tracking of individual immune cell populations within granulomas.

Keywords: CLARITY; Granuloma; Light-sheet fluorescence microscopy; Serial block face electron microscopy; Three-dimensional; Tuberculosis; Virulence.


Conflict of interest statement

Competing interests The authors declare no competing or financial interests.

Figures

Fig. 1.
Fig. 1.
Multi-modal imaging and quantification of tuberculosis infection in C3HeB/FeJ mouse lungs. (A) Whole lung lobe imaging workflow. A C3HeB/FeJ murine low-dose tuberculosis (TB) infection model was used. Forty/group of 8- to 10-week-old C3HeB/FeJ mice were infected via inhalation exposure system with <100 colony forming units (CFU) of either E2Crimson M. tuberculosis (Mtb) wild type (WT) (Mtb-WT) or E2Crimson Mtb ESX-1 deletion mutant (Mtb-ΔRD1) – Mtb transformed with a PTEC-19 plasmid containing an E2Crimson reporter. Ten mice/group were euthanized 1 day post-infection to confirm delivery dose. Infection was allowed to progress over time. Lungs were extracted at day 28, 42 and 70 post-infection (ten mice/group) following transcardiac perfusion with heparinized phosphate buffered saline (PBS) to remove red blood cells. (B) Overview of lung lobe allocation and procedure for each assay. (1) Right cranial and middle lobes were perfused post-extraction with 4% paraformaldehyde and fixed for 24 h at room temperature. Right cranial lobes were processed for passive CLARITY (PACT)-based clearing and immunolabelling before imaging with light-sheet fluorescent microscopy (LSFM). (2) Regions of interest (ROIs) imaged at higher magnification using LSFM were scanned using microCT, excised and resin embedded prior to serial block face electron microscopy (SBF). (3) Right caudal lobes were placed in 10% formalin and fixed for 24 h prior to paraffin embedding and sectioning and Haematoxylin and Eosin (H&E) staining for standard histology. (4) Left lobes were removed following cardiac perfusion, placed in 4 ml PBS, homogenized and plated for CFU determination. (C) Representative histological (H&E) staining images of lower-right lobes from infected mice at day (D)28, D42 and D70. Scale bars: 1000 μm (upper panels) and 50 μm (lower, zoomed-in panels). ‘ZN’ panels correspond to parallel histological sections of the same region stained using Ziehl–Neelsen staining. (D) Bacterial growth and lung pathology in the lungs of C3HeB/FeJ mice exposed to a low-dose aerosol infection of Mtb H37Rv WT versus ΔRD1 mutant over time (D28, D42 and D70 post-infection). Data points represent mean log10 CFU±s.e.m. of ten animals per time point. (E) Percentage lung involvement at D28, D42 and D70 for uninfected animals (uninf.), ΔRD1 mutant (RD1) and H37Rv WT, indicating cell infiltration. Data are from two animals (uninf.) and ten animals per strain (RD1 and WT) at each time point. Data points represent s.e.m. Significance testing was done using a Kruskal–Wallis test with post-hoc Dunn's test and Bonferroni correction (*P<0.05; **P<0.01; ***P<0.001).
Fig. 2.
Fig. 2.
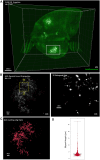
3D view of an infected (D42) lung lobe using LSFM. (A) Whole-lobe imaging using 0.63× zoom, showing the merged signal from the Mtb E2Crimson reporter (white) and tissue autofluorescence (green). Image was acquired with 100% sheet width (12 µm thickness), 10 µm z-step size and 100 ms exposure time, and illumination from left and right side. Scale bar: 1000 µm; numerical aperture (NA)=0.07. (B) Left: 3D view of an ROI (white box, panel A) imaged at higher resolution (dynamic focus with 6.3× zoom and NA of 0.5) to identify the Mtb E2Crimson reporter in higher detail. Image was acquired with 100% sheet width (7 µm thickness) at 2 µm z-step interval, 100 ms exposure, and illumination from left and right side. Scale bar: 50 µm. Right: the ZY orthogonal view (position 183 µm) is referring to a subregion of the volume shown on the left (indicated by the yellow dashed line box), showing individual Mtb cells (white arrows). ZY projections are enlarged roughly fivefold relative and image gamma modified to enhance display of dim features. Scale bar: 10 µm. (C) Individual cell counting using Imaris spot counting feature to identify and count individual cells from the 6.3× stack. (D) Box and whisker plot showing the average length (ellipsoid axis length in µm) of the Mtb cells identified during spot counting. Box plot represents the interquartile range, with whiskers as the maximum and minimum values.
Fig. 3.
Fig. 3.
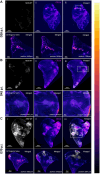
LSFM imaging of PACT-based cleared C3HeB/FeJ mouse right cranial lobe following E2Crimson Mtb WT infection over time. (A) D28 post-infection (p.i.). (B) D42 p.i. (C) D70 p.i. Lesion formation during disease is depicted by the accumulation of myeloid cell around infecting Mtb (CD11b depicted in the colour gradient lookup table ‘flame’ and E2Crimson reporter for Mtb H37Rv WT shown in white). Lower panels depict ZY orthogonal positions in the lung stack, highlighting specific areas of interest (white box), showing merged signal of Mtb and CD11b. Scale bars: 1500 µm for the 3D panels, and 100 µm, 400 µm and 700 µm for the D28, D42 and D70 orthogonal sections, respectively. Images shown are from a single representative lung lobe of one mouse per group. Data in Fig. 4 represent the same lung lobes in the WT-infected groups. All lung lobes were imaged using uniform laser settings optimized for the weakest signal at D28 p.i. to ensure consistency across samples. This approach resulted in signal saturation at later time points, which was subsequently corrected by manually adjusting display thresholds in Imaris for visualization purposes.
Fig. 4.
Fig. 4.
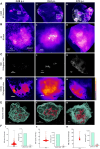
Higher-resolution imaging of ROIs from the E2Crimson Mtb WT-infected group of C3HeB/FeJ mice. Images are shown at D28 (i), D42 (ii) and D70 (iii) p.i. (A) ROIs identified in the larger stack under lower magnification (0.63×) are highlighted in white. Images represent the same samples shown in Fig. 3. (B) 3D projection of the ROI taken at higher resolution (4×, dynamic focus), showing the merged signal of Mtb (white) and CD11b (magenta)-positive cells in lesions at D28, D42 and D70. (C,D) Orthogonal view through the higher-resolution stack, showing the signal of Mtb (C) and CD11b (D)-positive cells (lookup table ‘flame’ display). (E) Volume render of the lesions, including render of the Mtb-infected cells. (F) Signal intensity from the E2Crimson reporter (left), and the volume size (µm3) of the lesion (cyan) and Mtb space (red) taken up inside the lesion (right). Bars represent the mean and maximum and minimum values.
Fig. 5.
Fig. 5.
LSFM-based 3D imaging of PACT-cleared C3HeB/Fej mouse lungs following infection with Mtb ΔRD1 mutant. (A) 3D imaging of E2Crimson Mtb ΔRD1 infection over time (D28, D42 and D70 p.i.) in a C3HeB/FeJ mouse model, depicting lesion formation during disease progression [myeloid cell recruitment depicted in magenta (CD11b) and E2Crimson reporter for Mtb shown in the lookup table ‘fire’]. Images were acquired using identical laser and light-sheet settings for both Mtb WT (shown in Fig. 3) and Mtb ΔRD1 lung lobes. Brightness and contrast were adjusted to show visually similar intensities in the figure to account for excess intensity in the WT-infected group at later time points. (B) Zoomed orthogonal positions in the lung stack from the E2Crimson Mtb ΔRD1-infected lungs highlighting specific areas of interest (white box), showing signal of Mtb ΔRD1 (top) and CD11b (bottom).
Fig. 6.
Fig. 6.
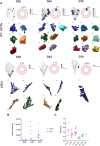
Lesion size, distribution and sphericity within C3HeB/FeJ mouse lungs infected with Mtb H37Rv WT versus ΔRD1 infection over time. (A) Lesion involvement calculated as a percentage of the total lung space, showing individual lesions rendered in 3D. Lesion size and sphericity were quantified using Imaris and the surface object detection and 3D volume rendering application, applying blend mode and manual intensity thresholding based on CD11b signal in each lung lobe for the lesion size, and autofluorescence signal to calculate the total lung volume. (B) Individual lesion volumes (µm3) plotted over the course of infection. The line indicates the median. (C) Sphericity of individual lesions in C3HeB/FeJ mice infected with different Mtb strains. Sphericity was calculated using Imaris and represents a dimensionless value ranging from 0 to 1, where 1 represents a perfect sphere. Sphericity provides insights into the compactness and shape characteristics of an object.
Fig. 7.
Fig. 7.
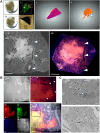
Volumetric correlative light and electron microscopy (vCLEM) to interrogate PACT-cleared tissue for ultrastructural content imaging. All images were taken from lung lobes at 42 days post-infection in both uncleared and cleared tissues. (A) Overview of region identification workflow. Entire lung lobe (i) with corresponding light-sheet render (ii) of each lesion of interest. Lung lobes were cut according to the localisation of each lesion (iii) and embedded in resin (iv). Care was taken to leave enough healthy surrounding tissue until fine block trimming could occur post resin embedding. Prior to block trimming, micro-computed tomography (microCT) scanning was performed on embedded tissue samples to assess the orientation of granulomas compared to initial light-sheet microscopy (v). Image registration between the microCT and light-sheet microscopy was conducted to aid in block trimming. Render of granuloma with lung tissue subtracted (vi). Purple line indicates the angle of the cross-section shown in vii. White arrowheads indicate corresponding blood vessels. Light-sheet data were transformed to microCT data using BigWarp (FIJI), to geometrically scale the light-sheet data to the same as those in the resin block (viii). An affine transformation was applied to the stack, with special care taken not to induce excessive deformation of the original image. The newly transformed light-sheet stack was then registered to the captured serial block face electron microscopy (SBF-EM) dataset, again using inherent morphological landmarks to identify appropriate areas for segmentation. Scale bars: 500 μm. (B) Use of the morphological landmarks to overlay fluorescent and SBF-EM datasets. Fine registration of SBF-EM (i) and light-sheet (ii) images using inherent morphological landmarks indicated by white arrowheads. Final channel overlay of the SBF-EM and the LSFM data (vii), indicated individually in the red (iii), green (iv) and far-red (v) channels post autofluorescence subtraction. Final electron microscopy overlay is shown in vi. Scale bars: 100 μm. The black box in vii represents the area further imaged by SBF-EM in Fig. 8. (C) Comparison of lung tissue before (i) and after (ii) clearing, showing scanning electron microscopy micrographs of 100 nm sections captured on silicon nano-wafers. Uncleared tissue was prepared with a conventional mega-metal staining protocol. Cleared tissue was prepared with ClearEM staining protocol. White arrowheads indicate Mtb bacteria within distinct vacuoles, indicative of engulfment by macrophages. Scale bars: 1 μm.
Fig. 8.
Fig. 8.
Ultrastructural analysis and tracking of cell populations in infected lesions using SBF-EM. (A-C) Region imaged using SBF-EM and the tracking of individual infected macrophage populations across multiple z-planes (black box in Fig. 7B, vii) at z=0 μm (A), z=300 μm (B) and z=600 μm (C). (D-F) Total volume render of infected macrophage population in A-C, respectively, within a selected lesion, with branch points from airways indicated by white arrowheads. (G,H) Render of infected population only (G), with the volume of surrounding structures shown in blue (H). Scale bars: 100 μm.

References

    1. Bankhead, P., Loughrey, M. B., Fernández, J. A., Dombrowski, Y., McArt, D. G., Dunne, P. D., McQuaid, S., Gray, R. T., Murray, L. J., Coleman, H. G.et al. (2017). QuPath: Open source software for digital pathology image analysis. Sci. Rep. 7, 16878. 10.1038/s41598-017-17204-5 - DOI - PMC - PubMed
    1. Clemmensen, H. S., Knudsen, N. P. H., Rasmussen, E. M., Winkler, J., Rosenkrands, I., Ahmad, A., Lillebaek, T., Sherman, D. R., Andersen, P. L. and Aagaard, C. (2017). An attenuated Mycobacterium tuberculosis clinical strain with a defect in ESX-1 secretion induces minimal host immune responses and pathology. Sci. Rep. 7, 46666. 10.1038/srep46666 - DOI - PMC - PubMed
    1. Cohen, S. B., Gern, B. H., Delahaye, J. L., Adams, K. N., Plumlee, C. R., Winkler, J. K., Sherman, D. R., Gerner, M. Y. and Urdahl, K. B. (2018). Alveolar macrophages provide an early mycobacterium tuberculosis niche and initiate dissemination. Cell Host Microbe 24, 439-446. 10.1016/j.chom.2018.08.001 - DOI - PMC - PubMed
    1. Cronan, M. R., Rosenberg, A. F., Oehlers, S. H., Saelens, J. W., Sisk, D. M., Smith, K. L. J., Lee, S. and Tobin, D. M. (2015). CLARITY and PACT-based imaging of adult zebrafish and mouse for whole-animal analysis of infections. Dis. Model. Mech. 8, 1643-1650. 10.1242/dmm.021394 - DOI - PMC - PubMed
    1. Davis, J. M., Clay, H., Lewis, J. L., Ghori, N., Herbomel, P. and Ramakrishnan, L. (2002). Real-time visualization of mycobacterium-macrophage interactions leading to initiation of granuloma formation in zebrafish embryos. Immunity 17, 693-702. 10.1016/S1074-7613(02)00475-2 - DOI - PubMed