. 2025 Mar 11:16:1539773.
doi: 10.3389/fimmu.2025.1539773. eCollection 2025.

Decoding plasma cell maturation dynamics with BCMA

Affiliations

Decoding plasma cell maturation dynamics with BCMA

Sebastian R Schulz et al. Front Immunol. .

Abstract

Plasma cells provide protective antibodies following an infection or vaccination. A network of intrinsic and extrinsic factors fine-tunes the generation of a heterogenous plasma cell pool with varying metabolic requirements, transcriptional profiles and lifespans. Among these, the B cell maturation antigen (BCMA) has been implicated in the APRIL-mediated survival of long-lived plasma cells. To characterize the terminal maturation of plasma cells, we constructed a BCMA reporter mouse (BCMA:Tom) that exclusively labeled antibody-secreting cells and revealed that BCMA:Tom expression varied by IgH isotype and increased with plasma cell maturity. The BCMA reporter, used alongside the Blimp1-GFP reporter, also allowed detailed tracking of plasma cell development and highlighted the importance of the in vivo microenvironment to complete plasma cell maturation. Therefore, the BCMA:Tom reporter mouse provides a valuable tool for tracking plasma cell development and maturation with flow cytometry or advanced imaging techniques, enabling a deeper understanding of the mechanisms regulating plasma cell heterogeneity and longevity.

Keywords: BCMA (TNFRSF17); antibody-secreting cells (ASC); bone marrow; plasma cells; spleen; survival; thymus.


Conflict of interest statement

The authors declare that the research was conducted without any commercial or financial relationships that could be construed as a potential conflict of interest. The author(s) declared that they were an editorial board member of Frontiers, at the time of submission. This had no impact on the peer review process and the final decision.

Figures

Figure 1
Figure 1
BCMA:Tom reporter expression is restricted to plasma cells. (A) Schematic depiction of the wildtype Tnfrsf17 (BCMA) locus (upper) and the targeted BCMA:Tom reporter locus. Blue boxes indicate the three exons of the Tnfrsf17 locus, and light blue boxes indicate the 5’ and 3’ untranslated region (UTR). (B) Flow cytometric analysis of BCMA surface abundance in splenic plasma cells. Splenocytes of BCMA:Tom reporter mice and WT controls were incubated for 18 hours in R10 medium without (ctrl) or with 1 µM DAPT and surface stained with anti-BCMA (clone 25C2) antibodies. Bars display median fluorescence intensities of anti-BCMA after secondary staining with anti-human IgG in the CD138+TACI+ antibody-secreting cell gate. (n=4-6 mice per group, Statistical analysis was performed with 2-way ANOVA with adjusted p-values (Sidak correction) for multiple comparisons), ns, not significant. (C) Representative flow cytometric analysis of tdTomato expression in primary and peripheral lymphoid tissues of naive BCMA:Tom mice and wildtype littermate controls. Live single cells were used as the input gate for the histograms. TdTomato-positive cells are highlighted in red in the lower panel TACI/CD138 plot. (D) Representative analysis of germinal center B cells (GC) and antibody-secreting cells (ASC) in mesenteric lymph nodes (mLN) of BCMA:Tom (red line histogram) and wildtype (grey filled histogram) littermates. (E) Light sheet microscopy of fixed and cleared intestine from WT control C57BL/6 and BCMA:Tom mice. 488 nm excitation autofluorescence is depicted in green, showing epithelial and muscle structures, and the tdTomato signal of colon and small intestine lamina propria (LP) cells is depicted in red. Left panel: side view of villi, luminal side at the bottom, smooth muscle side at the top. Right panel: top view of villi, smooth muscle side at the top. (F) Two-photon intra-vital microscopy of non-fixated, freshly isolated organs from WT control C57BL/6 mice and BCMA:Tom mice. Autofluorescence is depicted in white, tdTomato signal of splenic, bone marrow, mesenteric lymph node (mLN), and small intestine lamina propria (siLP) cells was directly detected and is depicted in red, green, and blue structures derived from second harmony generation (SHG) and show reflections of vessels and organ capsules.
Figure 2
Figure 2
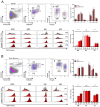
BCMA expression is linked to IgH isotype and mature plasma cell subsets. Representative flow cytometric analysis of antibody-secreting cell (ASC) subsets in (A) spleen and (B) bone marrow of BCMA:Tom reporter mice and WT littermates. TACI+/CD138+ ASCs were gated from viable lymphocytes and subdivided based on CD19/B220 and surface IgM/IgA abundance. The upper right panel depicts the frequency of the respective subpopulations within the ASC gate. tdTomato expression within the total TACI+/CD138+ gate and the IgH isotype gated subpopulations in BCMA:Tom mice is displayed in the lower panel histograms and summarized in the lower panel bar chart (mean +/- SD). Statistical analysis was performed using repeated-measures one-way ANOVA with testing for a linear trend per isotype (n=7-9 per group). ns, not significant, ****,p < 0.0001.
Figure 3
Figure 3
In vitro-generated plasmablasts only develop into mature plasma cells after transfer in vivo. (A) Splenic B cells of Blimp1-GFP/BCMA:Tom mice were magnetically isolated, labeled with the proliferation dye eFluor450 and stimulated with LPS or anti-CD40+IL-4 for 3 days. Representative data of N=3 independent experiments. (B) Splenic B cells of Blimp1-GFP/BCMA:Tom mice were magnetically isolated, co-cultured on 40LB-Feeder cells and stimulated with IL-4 (day 0-4), IL21 (Day 4-10) or APRIL/IL6 without Feeder cells (Day 10-13). Plasmablast differentiation was monitored by the induction of Blimp1-GFP and BCMA:Tom reporter abundance. Representative data of N=2 independent experiments with a total of 3 Blimp1-GFP(+/−)/BCMA:Tom(+/−) and 2 Blimp1-GFP(+/−)/BCMA:Tom(−/−) reporter mice. (C) Splenic B cells were magnetically isolated from Blimp1-GFP/BCMA:Tom mice and activated with LPS for 3 days. On day 3, 5 million Blimp1-GFP+BCMA:Tom cells were isolated by FACS and transferred into JH−/− CD8−/− mice. Recipient mice were sacrificed on days 1, 3, 7, 14 and 28 after adoptive transfer. Blimp1-GFP+CD138+TACI+ antibody-secreting cells (ASC) in the bone marrow were quantified by flow cytometry at the indicated time points after transfer. The frequency of Blimp1-GFP+BCMA:Tom (green) and Blimp1-GFP+BCMA:Tom+ (red) cells at each timepoint is depicted (mean ± SD). Data are shown for 3 mice per timepoint (except day 3 with only one mouse analyzed).
Figure 4
Figure 4
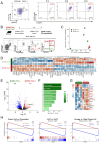
BCMA expression distinguishes a mature plasma cell transcriptome. (A) Bone marrow plasma cells of unimmunized Blimp1-GFP/BCMA:Tom mice were analyzed for reporter gene expression by flow cytometry. Antibody-secreting cells (CD138+TACI+) were used as input for the left-most plot and further subdivided into subpopulations based on CD19/B220 expression. (B) Blimp1-GFP/BCMA:Tom mice were immunized with mRNA-1273 on days 0 and 70. Surface IgM/IgA P3 (B220/CD19) plasma cell populations were sorted for transcriptome analysis based on BCMA:Tom expression. (C) Principal component analysis (PCA) of transcriptome data showing the variance between samples, with the first two principal components (PC1 and PC2) accounting for the highest variance in gene expression profiles across the two sample groups. (D) Heatmap displaying the top 50 up-regulated and downregulated differentially expressed genes (DEGs) across samples with gene-wise color scaling indicating higher expression in red and lower expression in blue. (E) Volcano plot with DEGs (|log2FC| > 1 and FDR < 0.05) highlighted in red (higher in BCMA:Tom+) and blue (higher in BCMA:Tom). (F) Gene Set Enrichment Analysis (GSEA) of significantly enriched MSigDB-Hallmark pathways with color-scaling by the normalized enrichment score (NES). A negative NES indicates enrichment of the respective gene set in BCMA:Tom cells. (G) Heatmap of selected plasma cell maturation signature genes with significantly expressed gene symbols highlighted in red/blue. (H) GSEA Analysis of curated plasma cell signature gene sets derived from literature [Shi et al., 2015a (40); Jing et al., 2024a (41); Robinson et al., 2023 (2)]. Enrichment scores for BCMA:Tom+ cells are indicated in red and for BCMA:Tom in blue.
Figure 5
Figure 5
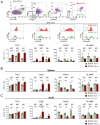
BCMA expression correlates with surface marker abundance across B220 ASC isotypes and tissues. Selected markers were validated at the protein level by flow cytometry on (A) B220/IgM/IgA BCMA:Tom (green) and BCMA:Tom+ (red) bone marrow plasma cells of unimmunized Blimp1-GFP/BCMA:Tom mice. Open histograms represent the FMO controls. The surface abundance of selected markers was further analyzed for both populations on B220/IgM+ or B220/IgA+ ASCs in the bone marrow. (B, C) The protein abundance of selected markers of BCMA:Tom and BCMA:Tom+ ASC for the Ig heavy chain isotypes IgG, IgM and IgA are summarized in (B) spleen and (C) mLN. Median fluorescence intensities (MFI) are summarized in bar charts (mean +/- SD). Statistical analysis was performed using two-way ANOVA with Šídák’s multiple comparisons test (n=4 per group). ns, not significant, p > 0.05; *, p < 0.05; **, p <0.01; ***, p < 0.001; ****, p < 0.0001.

References

    1. Landsverk OJB, Snir O, Casado RB, Richter L, Mold JE, Réu P, et al. . Antibody-secreting plasma cells persist for decades in human intestine. J Exp Med. (2017) 214:309–17. doi: 10.1084/jem.20161590 - DOI - PMC - PubMed
    1. Robinson MJ, Ding Z, Dowling MR, Hill DL, Webster RH, McKenzie C, et al. . Intrinsically determined turnover underlies broad heterogeneity in plasma-cell lifespan. Immunity. (2023) 56:1596–1612.e4. doi: 10.1016/j.immuni.2023.04.015 - DOI - PubMed
    1. Lemke A, Kraft M, Roth K, Riedel R, Lammerding D, Hauser AE. Long-lived plasma cells are generated in mucosal immune responses and contribute to the bone marrow plasma cell pool in mice. Mucosal Immunol. (2016) 9:83–97. doi: 10.1038/mi.2015.38 - DOI - PubMed
    1. Tellier J, Tarasova I, Nie J, Smillie CS, Fedele PL, Cao WHJ, et al. . Unraveling the diversity and functions of tissue-resident plasma cells. Nat Immunol. (2024) 25:330–42. doi: 10.1038/s41590-023-01712-w - DOI - PubMed
    1. Schuh W, Mielenz D, Jäck H-M. Unraveling the mysteries of plasma cells. In: Advances in immunology. Elsevier; (2020) 146:57–107. doi: 10.1016/bs.ai.2020.01.002 - DOI - PubMed

MeSH terms

Substances

LinkOut - more resources