

Nitrogen fertilization form and energetic status as target points conditioning rice responsiveness to elevated [CO2]
- PMID: 40134626
- PMCID: PMC11933000
- DOI: 10.3389/fpls.2025.1517360
Nitrogen fertilization form and energetic status as target points conditioning rice responsiveness to elevated [CO2]
Abstract
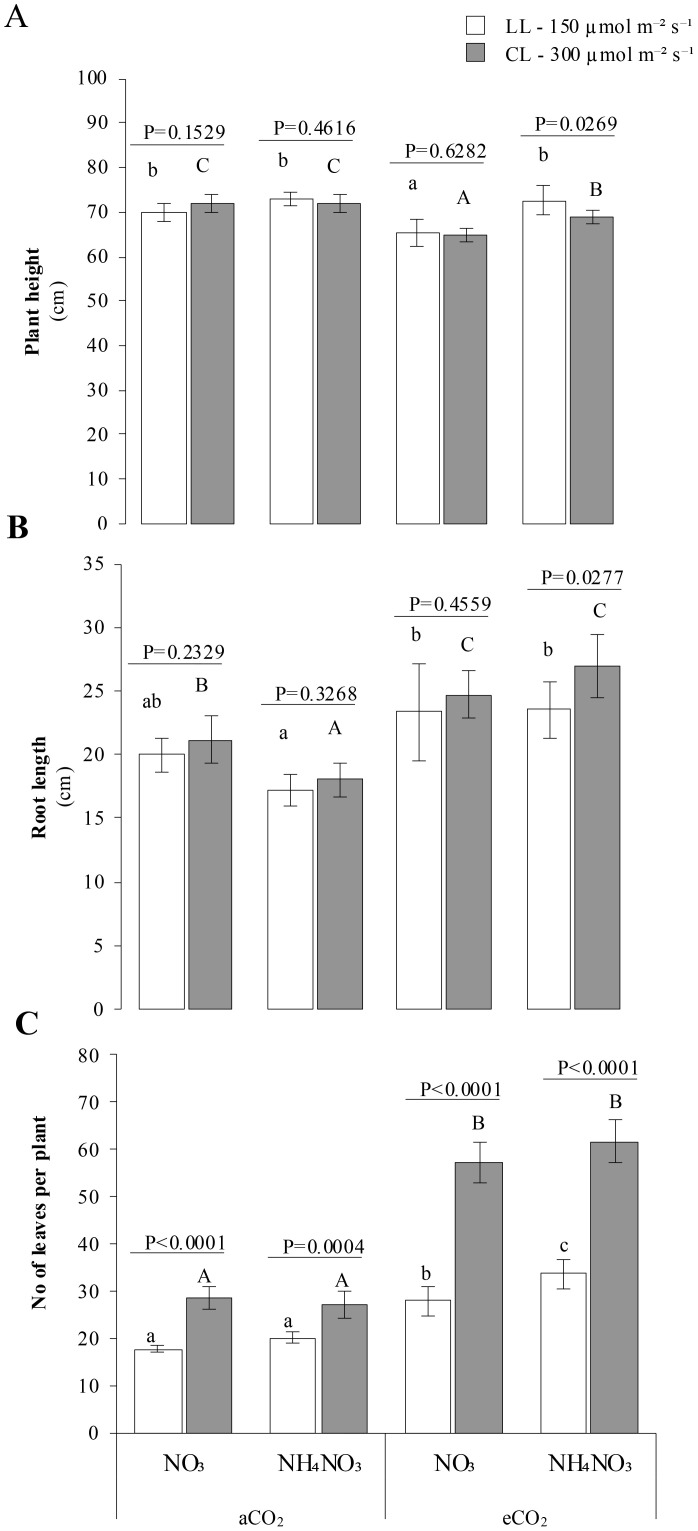
The nitrogen (N) fertilization form and plant energy status are known to significantly influence plant responses to elevated atmospheric carbon dioxide (CO2) concentrations. However, a close examination of the interplay between N sources under contrasting light intensity has been notably absent in the literature. In this study, we conducted a factorial experiment with rice plants involving two different light intensities (150 and 300 µmol m-2 s-1), inorganic N sources [nitrate (N-NO3) or ammonium nitrate (N-NH4NO3)] at varying CO2 levels (410 and 700 parts per million, ppm). The aim was to examine the individual and combined effects of these factors on the allocation of biomass in whole plants, as well as on leaf-level photosynthetic characteristics, chloroplast morphology and development, ATP content, ionomics, metabolomics, and hormone profiles. Our research hypothesis posits that mixed nutrition enhances plant responsiveness to elevated CO2 (eCO2) at both light levels compared to sole N-NO3 nutrition, due to its diminished energy demands for plant assimilation. Our findings indicate that N-NO3 nutrition does not promote the growth of rice, its photosynthetic capacity, or N content when exposed to ambient CO2 (aCO2), and is significantly reduced in low light (LL) conditions. Rice plants with N-NH4NO3 exhibited a higher carboxylation capacity, which resulted in larger biomass (total C, tiller number, and lower root-shoot ratio) supported by higher Calvin-cycle-related sugars. The lower leaf N content and overall amino acid levels at eCO2, particularly pronounced in N-NO3, combined with the lower ATP content (lowest at LL and N-NO3), may reflect the higher energy costs of N assimilation at eCO2. We also observed significant plasticity patterns in leaves under eCO2. Our findings highlight the importance of a thorough physiological understanding to inform innovative management practices aimed at mitigating the negative effects of climate change on plant N use efficiency.
Keywords: ATP; elevated CO2; low light intensity; nitrate; nitrogen source; photosynthesis; plasticity; rice.
Copyright © 2025 Jauregui, Mitsui, Gakière, Mauve, Gilard, Aranjuelo and Baslam.
Conflict of interest statement
The authors declare that the research was conducted in the absence of any commercial or financial relationships that could be construed as a potential conflict of interest.
Figures


Similar articles
-
Nitrogen fertilization and CO2 concentration synergistically affect the growth and protein content of Agropyron mongolicum.PeerJ. 2022 Oct 31;10:e14273. doi: 10.7717/peerj.14273. eCollection 2022. PeerJ. 2022. PMID: 36340197 Free PMC article.
-
Revisiting Why Plants Become N Deficient Under Elevated CO2: Importance to Meet N Demand Regardless of the Fed-Form.Front Plant Sci. 2021 Nov 4;12:726186. doi: 10.3389/fpls.2021.726186. eCollection 2021. Front Plant Sci. 2021. PMID: 34804082 Free PMC article.
-
Enhanced photorespiratory and TCA pathways by elevated CO2 to manage ammonium nutrition in tomato leaves.Plant Physiol Biochem. 2024 Dec;217:109216. doi: 10.1016/j.plaphy.2024.109216. Epub 2024 Oct 25. Plant Physiol Biochem. 2024. PMID: 39486222
-
Short photoperiod attenuates CO2 fertilization effect on shoot biomass in Arabidopsis thaliana.Physiol Mol Biol Plants. 2021 Apr;27(4):825-834. doi: 10.1007/s12298-021-00968-6. Epub 2021 Mar 16. Physiol Mol Biol Plants. 2021. PMID: 33967465 Free PMC article.
-
A meta-analysis of the combined effects of elevated carbon dioxide and chronic warming on plant %N, protein content and N-uptake rate.AoB Plants. 2021 May 25;13(4):plab031. doi: 10.1093/aobpla/plab031. eCollection 2021 Aug. AoB Plants. 2021. PMID: 34285792 Free PMC article. Review.
References
-
- Aranjuelo I., Tcherkez G., Jauregui I., Gilard F., Ancín M., Millán A. F. S., et al. . (2015). Alteration by thioredoxin f over-expression of primary carbon metabolism and its response to elevated CO2 in tobacco (Nicotiana tabacum L.). Environ. Exp. Bot. 118, 40–48. doi: 10.1016/j.envexpbot.2015.05.008 - DOI
LinkOut - more resources
Full Text Sources