. 2025 Mar 3;7(2):fcaf100.
doi: 10.1093/braincomms/fcaf100. eCollection 2025.

Whole-brain volumetric analysis in adult Moyamoya patients reveals significant atrophy compared to healthy controls

Affiliations

Whole-brain volumetric analysis in adult Moyamoya patients reveals significant atrophy compared to healthy controls

Patrick Haas et al. Brain Commun. .

Abstract

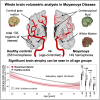
Moyamoya disease (MMD) may lead to perfusion deficits, stroke and brain atrophy in the long-term. Our aim was to analyse whole-brain volumetry of a large cohort of Moyamoya disease patients compared to healthy controls. 3D T1w MRI sequences of adult Moyamoya disease patients treated at our centre between 2016 and 2022 without prior revascularization were analysed for whole-brain volumetry (AssemblyNet) and compared age-controlled to healthy controls. A total of 133 different regions of interest were examined retrospectively for each patient separately by localization, structure and tissue type. All segmentations were subjected to automated and manual quality control. After quality control, 149 hemispheres from 80 Moyamoya disease patients were compared to 258 hemispheres from 129 healthy controls. A significant brain volume loss was observed in Moyamoya disease patients with increasing age, with the greatest reduction seen in bilaterally affected patients with Suzuki grade >3. As direct signs of brain atrophy, significant differences were seen across all regions of interests, emphasized in cortical grey matter with a reduction of 4.4% (95% CI 2.7-6.1%; P < 0.001) in patients aged 30-45 years and 3.4% (95% CI 2.1-4.7%; P < 0.001) aged 46-60 years. As indirect sign for atrophy, external CSF spaces increased up to 26.4% (95% CI 17.0-35.9%; P < 0.001) for 30-45 years and 28.4% (95% CI 17.1-39.7%; P < 0.001) for 46-60 years compared to healthy controls. Infratentorial, significant volume loss was observed for patients aged 46-60 years with 11.6% for cerebellar white matter (95% CI 3.7-19.5%; P = 0.0025) and with 8.5% (95% CI 3.5-13.5%; P = 0.0006) for the brainstem, likely due to secondary neurodegeneration. Moyamoya disease patients >45 year without ischaemia also had significantly less grey matter and white matter volume, with accordingly enlarged CSF spaces. Moyamoya disease may lead to significant differences in brain volume of local and global regions of interest as a sign of brain atrophy, even in the absence of infarctions. These findings might be useful for the understanding of the disease burden and in decision-making for timely revascularization.

Keywords: Moyamoya; cerebral revascularization; healthy controls; volumetric.


Figures

Graphical Abstract
Graphical Abstract
Figure 1
Figure 1
3D visualizations of the WBV. (A) Volumes of exCSF (green), cGM (beige) and WM (dark brown). (B) Representation of the intracranial cavity (blue) in spatial orientation, which serves as an inter-individual reference for the ROIs studied.
Figure 2
Figure 2
Distribution of cortical and subcortical ischaemia. Percentage distribution of cortical (middle ring) and subcortical ischaemia (outer ring) with subdivision according to Fazekas (modified bar chart) into focal lesions, confluence of lesions, involvement of entire vascular territory according to vascular territories [ACA, MCA and posterior cerebral artery (PCA)] and in-between watersheds (inner ring) for the MMD study cohort (n = 80 individual patients).
Figure 3
Figure 3
Brain volume differences between biMMD and healthy controls. (A–C) Volumes of the MMD collective (red) and the HC (dark grey). Left side: Curve plot of ROI volumes (percentage in relation to intracranial cavity) versus patient age in years as second degree polynomials (highest coefficient of determination R2). The associated 95% CI is shaded. Significant differences can be assumed in the range of non-overlapping confidence intervals. Right side: Boxplots of ROI volumes split into age groups <30 (n = 112), 30–45 (n = 92), 46–60 (n = 88) and >60 years (n = 46). The t statistics of the t-tests performed are Ai: t(16.6) = −2.04, Aii: t(33.2) = −4.9, Aiii: t(36.4) = −4.94, Aiv: t(19.1) = −3.23, Av: t(17.8) = −2.27, Avi: t(38.8) = −5.09, Avii: t(36.9) = −5.1, Aviii: t(15) = −2.36, Aix: t(26,7) = −2.33, Ax: t(17.9) = −3.1, Axi: t(27.5) = −3.5, Axii: t(46.1) = −2.37, Bi: t(28.4) = 3.47, Bii: t(35.8) = 2.96, Biii: t(16.1) = 2.54, Biv: t(28) = 3.54, Bv: t(36.1) = 3.79, Bvi: t(11.4) = 2.1, Bvii t(17.6) = 3.22, Bviii: t(31.9) = 5.32, Bix: t(41.2) = 4.81, Bx: t(16.1) = 2.54, Bxi: t(16.7) = 3.17, Bxii: t(27.6) = 1.71, Bxiii: t(32.5) = 4.1, Bxiv: t(13.9) = 3.19, Bxv: t(30.8) = 2.98, Ci: t(36.1) = 3.51, Cii: t(22.2) = 2.7, Ciii: t(14) = 2.9, Civ: t(33.3) = 3.01, Cv: t(38.7) = 3.28, Cvi: t(12.3) = 2.58. P-values are adjusted according to Bonferroni–Holm correction (14 × 4). (A) CSF spaces. (B) Supratentorial ROIs (selection). (C) Infratentorial ROIs (selection).
Figure 4
Figure 4
Differences in brain volume in MMD without ischaemia and with the consideration of Suzuki grade. (A) Comparison of MMD patients without ischaemia (red) with HC (selected ROIs). Right side: Boxplots of ROI volumes split into age groups <30 (n = 105), 30–45 (n = 77) and 46–60 years (n = 70). The t statistics of the t-tests performed are Ai: t(68) = 2.88, Aii: t(68) = 3.09, Aiii: t(68) = 2.79, Aiv: t(68) = 3.96, Av: t(68)=−3.39. P-values adjusted according to Bonferroni–Holm correction across all six examined ROIs per age group (6 × 3). Note: The study population aged >60 years included only two patients with MMD without ischaemia. Therefore, a graphical and statistical analysis was not performed. (B) All patients with MMD divided into Suzuki minor (≤3, green) and major grades (<3, red) compared with HC. Right side: Boxplots of ROI volumes split into age groups <30 (n = 119), 30–45 (n = 103), 46–60 (n = 100) and >60 years (n = 48). ANOVA test results are Bi: F(2118) = 4.86, Bii: F(2102) = 12.10, Biii: F(2.99) = 9.12, Biv: F(2118) = 7.68, Bv: F(2102) = 13.06, Bvi: F(2.99) = 13.66, Bvii: F(2118) = 4.78, Bviii: F(2102) = 7.88, Bix: F(2.99) = 5.64, Bx: F(2118) = 7.08, Bxi: F(2102) = 10.90, Bxii: F(2.99) = 21.37, Bxiii: F(2.47) = 3.60. Tukey-Kramer post hoc P-values of significance are shown for the respective pairs of bars.
Figure 5
Figure 5
Hypothetical age shift for a 45-year-old MMD patient. Hypothetical age shift (blue arrows) for a 45-year-old MMD patient with corresponding ROI volumes in HC. (A) biMMD with Suzuki grade ≤3 (green). (B) biMMD with Suzuki grade >3 (red). (C) MMD without ischaemia.

References

    1. Takeuchi K. Hypoplasia of bilateral internal carotid arteries. Brain Nerve. 1957;9:37–43.
    1. Suzuki J, Takaku A. Cerebrovascular “moyamoya” disease. Disease showing abnormal net-like vessels in base of brain. Arch Neurol. 1969;20(3):288–299. - PubMed
    1. Haas P, Fudali M, Wang SS, et al. Quality of life impairment in adult Moyamoya patients-preoperative neuropsychological assessment and correlation to MRI and H(2)(15)O PET findings. Neurosurg Rev. 2022;45(2):1533–1541. - PMC - PubMed
    1. Roder C, Haas P, Fudali M, et al. Neuropsychological impairment in adults with moyamoya angiopathy: Preoperative assessment and correlation to MRI and H(2)(15)O PET. Neurosurg Rev. 2020;43(6):1615–1622. - PubMed
    1. Fujimura M, Tominaga T, Kuroda S, et al. 2021 Japanese guidelines for the management of Moyamoya Disease: Guidelines from the Research Committee on Moyamoya Disease and Japan Stroke Society. Neurol Med Chir (Tokyo). 2022;62(4):165–170. - PMC - PubMed

LinkOut - more resources