. 2025 Mar 4;26(2):bbaf130.
doi: 10.1093/bib/bbaf130.

Elementary methods provide more replicable results in microbial differential abundance analysis

Affiliations

Elementary methods provide more replicable results in microbial differential abundance analysis

Juho Pelto et al. Brief Bioinform. .

Abstract

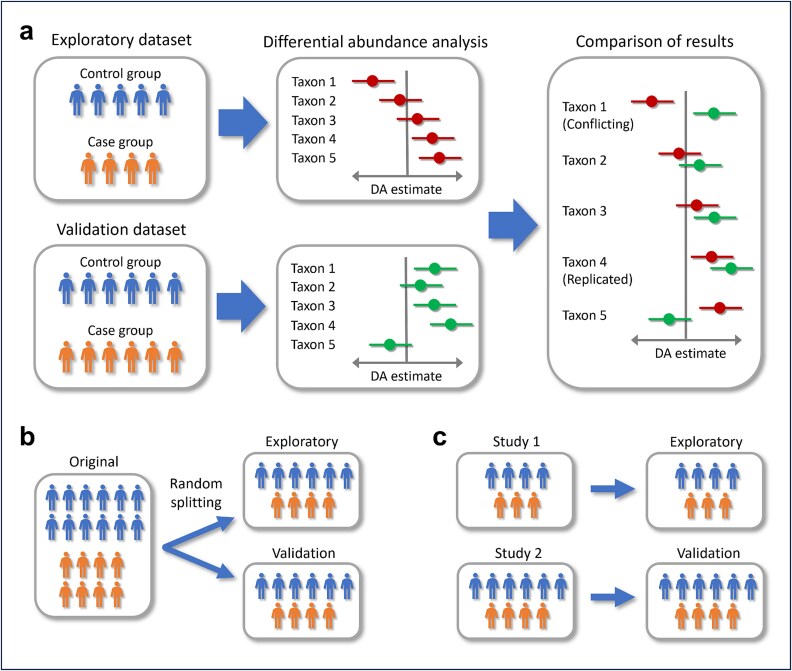
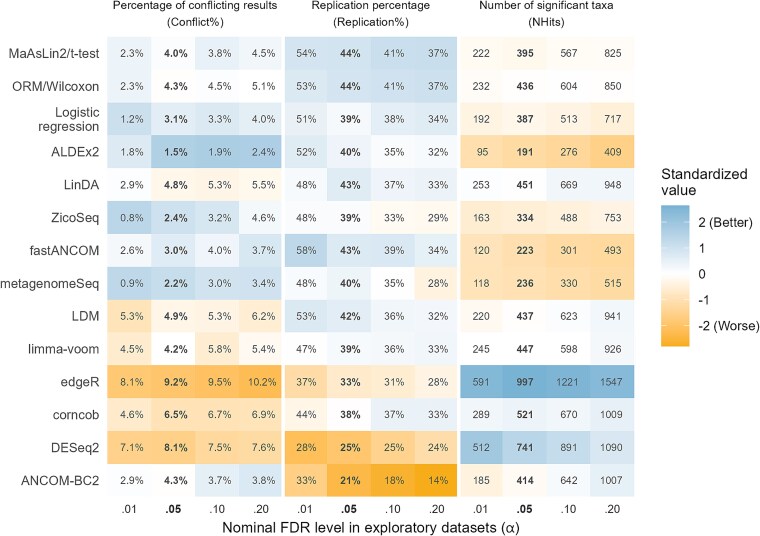
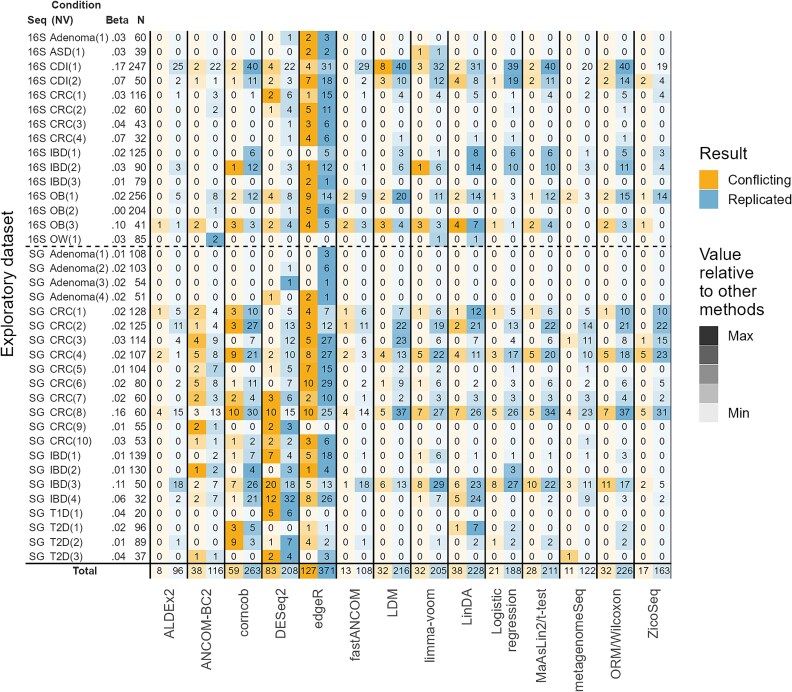
Differential abundance analysis (DAA) is a key component of microbiome studies. Although dozens of methods exist, there is currently no consensus on the preferred methods. While the correctness of results in DAA is an ambiguous concept and cannot be fully evaluated without setting the ground truth and employing simulated data, we argue that a well-performing method should be effective in producing highly reproducible results. We compared the performance of 14 DAA methods by employing datasets from 53 taxonomic profiling studies based on 16S rRNA gene or shotgun metagenomic sequencing. For each method, we examined how the results replicated between random partitions of each dataset and between datasets from separate studies. While certain methods showed good consistency, some widely used methods were observed to produce a substantial number of conflicting findings. Overall, when considering consistency together with sensitivity, the best performance was attained by analyzing relative abundances with a nonparametric method (Wilcoxon test or ordinal regression model) or linear regression/t-test. Moreover, a comparable performance was obtained by analyzing presence/absence of taxa with logistic regression.

Keywords: benchmarking; differential abundance analysis; microbiome; replicability.


Figures

Figure 1
Figure 1
(a) The basic workflow in evaluating replicability and consistency. DAA was performed on exploratory and validation datasets, and the results were compared between them. If the result for a taxon was significant in both exploratory and validation datasets, but the directions were opposite, the results were considered conflicting (Taxon 1). The result for a taxon was considered replicated if it was significant and had the same direction in exploratory and validation datasets (Taxon 4). (b) In the split-data analyses, each exploratory/validation pair of datasets was constructed by randomly splitting an original dataset. (c) In the separate study analyses, datasets from separate studies were used as exploratory and validation datasets. In all subfigures, the individuals belonging to the control and case groups are indicated with blue and orange, respectively.
Figure 2
Figure 2
The performance of 14 DAA methods in terms of consistency and sensitivity on 57 randomly split real microbiome datasets. The methods are in rank order based on the mean of the standardized values of the metrics. (Conflict% was square root transformed before the standardization.) Values based on the nominal FDR level α = 0.05 are shown in bold. Each original dataset was split five times to form pairs consisting of an exploratory and a validation dataset, thus totaling 285 pairs of datasets. Candidate taxon = A taxon that was significant (FDR-adjusted P < α) in an exploratory dataset and present in the validation dataset. Conflict% = The percentage of candidate taxa that were significant (P < .05) in the validation dataset, but in the opposite direction to that in the exploratory dataset. Replication% = The percentage of candidate taxa that were significant (P < .05) in the validation dataset in the same direction as in the exploratory dataset. NHits = The total number of significant (FDR adjusted P < α) taxa found in the 285 exploratory datasets. A higher NHits can be considered better when it is accompanied by low Conflict% and high Replication%.
Figure 3
Figure 3
The number of conflicting and replicated results found by 14 DAA methods on 57 randomly split real microbiome datasets. Each original dataset was split to form a pair consisting of an exploratory and a validation dataset. The splitting was performed five times for each original dataset. In each slot is the number of taxa for which a conflicting or replicated result was found in at least one of such pair. Conflicting result = the result for a taxon was significant in the exploratory datasets (FDR adjusted P < .05) and validation datasets (P < .05) but in opposite directions. Replicated result = the result for a taxon was significant in the exploratory dataset and validation datasets in the same direction. Seq. = sequencing type (16S or SG = shotgun); Cond. = the studied condition; Beta = Beta diversity explained by the experimental group (case/control); N = the sample size in a single exploratory or validation dataset. ACVD, atherosclerotic cardiovascular disease; BD, Behcet’s disease; Ceph., cephalosporins; CRA, chronic, treated rheumatoid arthritis; HIV, human immunodeficiency virus; HT, hypertension; IGT, impaired glucose tolerance; ME/CFS, myalgic encephalomyelitis/chronic fatigue syndrome; NASH, nonalcoholic steatohepatitis; NORA, new-onset untreated rheumatoid arthritis; PD, Parkinson's disease; PHT, prehypertension; STH, soil-transmitted helminths.
Figure 4
Figure 4
The performance of 14 DAA methods in terms of sensitivity and consistency of results between separate studies. The methods are in rank order based on the mean of the standardized values of the metrics. (Conflict% was square root transformed before the standardization.) Values based on the nominal FDR level α = 0.05 are shown in bold. A dataset from one study was used as an exploratory dataset and dataset(s) from other study/studies as the validation dataset(s). Candidate taxon = A taxon that was significant (FDR adjusted P < α) in an exploratory dataset and present in a validation dataset. Conflict% = The percentage of candidate taxa that were significant (P < .05) in the validation dataset, but in the opposite direction to that in the exploratory dataset. Replication% = The percentage of candidate taxa that were significant (P < .05) in the validation dataset in the same direction as in the exploratory dataset. NHits = The total number of significant taxa found in the 37 exploratory datasets. A higher NHits can be considered better when it is accompanied by low Conflict% and high Replication%.
Figure 5
Figure 5
The number of conflicting and replicated results found by 14 DAA methods when datasets from separate studies were used as exploratory and validation datasets. One exploratory dataset may have had multiple validation datasets (indicated by NV). In each slot is the number of taxa for which a conflicting or replicated result was found in at least one of the validation datasets. Conflicting result = the result for a taxon was significant in the exploratory dataset (FDR-adjusted P < .05) and validation dataset(s) (P < .05) but in opposite directions. Replicated result = the result for a taxon was significant in the exploratory dataset and validation dataset(s) in the same direction. Seq. = sequencing type (16S or SG = shotgun); Condition = the studied condition; Beta = Beta diversity explained by the experimental group (case/control); N = the sample size of the exploratory dataset.

Similar articles

Cited by

References

    1. Nearing JT, Douglas GM, Hayes MG. et al. Microbiome differential abundance methods produce different results across 38 datasets. Nat Commun 2022;13:342. 10.1038/s41467-022-28034-z - DOI - PMC - PubMed
    1. Yang L, Chen J. A comprehensive evaluation of microbial differential abundance analysis methods: current status and potential solutions. Microbiome 2022;10:130. 10.1186/s40168-022-01320-0 - DOI - PMC - PubMed
    1. McLaren MR, Willis AD, Callahan BJ. Consistent and correctable bias in metagenomic sequencing experiments. Elife 2019;8:e46923. 10.7554/eLife.46923 - DOI - PMC - PubMed
    1. McMurdie PJ, Holmes S. Waste not, want not: why rarefying microbiome data is inadmissible. PLoS Comput Biol 2014;10:e1003531. 10.1371/JOURNAL.PCBI.1003531 - DOI - PMC - PubMed
    1. Lin H, Das Peddada S. Analysis of microbial compositions: a review of normalization and differential abundance analysis. NPJ Biofilms Microbiomes 2020;6:60. 10.1038/s41522-020-00160-w - DOI - PMC - PubMed

Substances