. 2025 Dec;14(1):2466695.
doi: 10.1080/22221751.2025.2466695. Epub 2025 Mar 26.

GNLY+CD8+ T cells bridge premature aging and persistent inflammation in people living with HIV

Affiliations

GNLY+CD8+ T cells bridge premature aging and persistent inflammation in people living with HIV

Hui-Fang Wang et al. Emerg Microbes Infect. 2025 Dec.

Abstract

People living with HIV (PLWH) exhibit accelerated aging, characterized by systemic inflammation, termed "inflammaging." While T-cell expansion is prevalent in PLWH, its connection to inflammaging remains unclear. In this study, we analyzed the TCRβ repertoire of 257 healthy controls (HC) and 228 PLWH, revealing pronounced T cell clonal expansion in PLWH. The expansion was only partially reversed following antiretroviral therapy (ART) and closely associated with ART duration, CD4+ T and CD8+ T cell counts and the CD4/CD8 ratio. TCR-based age modeling showed a continuous accelerated trajectory of aging in PLWH, especially in younger individuals, in stark contrast to the nonlinear aging acceleration pattern seen in HC. Furthermore, using single-cell RNA combined TCR sequencing and in vitro experiments, we identified GNLY+CD8+ T cells as the primary population driving clonal expansion and maintenance in PLWH. These cells are characterized by high cytotoxicity and low exhaustion and are activated by interleukin-15 (IL-15) in vitro. Notably, GNLY+CD8+ T cells predominantly express the pro-inflammatory 15 kDa form of granulysin(GNLY). The supernatant from IL-15-stimulated CD8+ T cells induces monocytes to secrete inflammatory factors and disrupts the integrity of intestinal epithelial cells, which can be partially restored by the anti-GNLY antibodies. These findings identify GNLY+CD8+ T cells as the central drivers of persistent clonal expansion, highlighting their crucial role for mitigating inflammaging in PLWH.

Keywords: GNLY+CD8+ T cells; HIV; TCR repertoire; clonal expansion; inflammaging.


Conflict of interest statement

Dr. Zhixi Zhang is the founder of Chengdu ExAb Biotechnology Ltd. All financial interests are unrelated to this study. The remaining authors declare no competing interests.

Figures

None
Graphical abstract
Figure 1.
Figure 1.
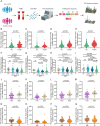
Perturbations of TCRβ clonality in PLWH. (A) Schematic diagram of the workflow for bulk TCRβ sequencing. (B-Q) Scatter plots showing TCRβ clonality metrics, normalized to 30,000 total sequences, across different groups. (B, F, J, N) Number of large clones; (C, G, K, O) number of big clones; (D, H, L, P) percentage of top 10 clones; (E, I, M, Q) percentage of top 20 clones. Comparisons are shown between: (B-E) healthy controls (HC, n = 257) and people living with HIV (PLWH, n = 228); (F-I) treatment-naive patients (TP, n = 17), ART less than 24 months (<24 m, n = 77), ART more than 24 months (>24 m, n = 134), and HC; (J-M) fast and slow virological response groups; (N-Q) immune non-responders (INR, n = 53) and immune responders (IR, n = 81).
Figure 2.
Figure 2.
Age-associated changes of TCR repertoire in HC and PLWH. (A-D) Scatter plots showing age-associated changes in clonality metrics for HC (blue dots) and PLWH (red plots). Each dot corresponds to an individual sample. Statistical comparisons are indicated by lines: black lines for comparisons between HC and PLWH, green lines for within-HC comparisons, and red lines for within-PLWH comparisons. (E-H) Polynomial regression analysis of TCR repertoire metrics with age: (E) D50, (F) Shannon entropy, (G) percentage of top 10 clones and (H) percentage of top 20 clones. Regression lines are shown for HC (green) and PLWH (red). (I-J) Sliding window analysis of age-associated changes in differentially presented features for (I) HC and (J) PLWH.
Figure 3.
Figure 3.
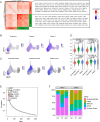
GNLY as an optimal marker for highly clonally expanded CD8+ T cells. (A) Heatmap showing two clusters of genes positively associated with clonal frequency of CD8+ T cells (p < 0.01, r > 0.1). (B) UMAP plots depicting the clonal frequency and expression distribution of two gene clusters in CD8+ T cells. Red circles highlight regions of high clonal expansion. (C) UMAP plots visualizing expanded, contracted, and stable clones from overlapping clonal populations in three paired patients, with color gradients representing cell density. (D) Violin plots comparing the expression scores of two gene clusters in expanded, contracted, and stable clones pre – and post-ART. (E) Scatter plots illustrating genes positively correlated with the clonal frequency of CD8+ T cells. The top 10 correlated genes are highlighted in red. (F) Bar plots showing the clonal size distribution of GNLY-CD8+ T cells and GNLY+CD8+ T cells across HC, TP, and ART groups. Clones are categorized as hyperexpanded (>10% of total unique clones), large (1–10%), medium (0.1–1%), small (<0.1%), and unique (no clonal expansion).
Figure 4.
Figure 4.
Enhanced cytotoxicity and low exhaustion in GNLY+CD8+ T cells. (A) Gene enrichment analysis of two clusters of genes associated with clonal frequency (p < 0.01, r > 0.1) (B) Representative flow cytometry and scatter plots comparing GNLY-CD8+ T with GNLY+CD8+ T cells, as well as differences among GNLY+CD8+ T cells across groups. (C-H) Comparison of marker expression between GNLY-CD8+ T cells and GNLY+CD8+ T cells, as well as among GNLY+CD8+ T cell groups. (C) HLA-DR and CD38; (D) CD27 and CD28; (E) CD57; (F) PD-1; (G) GZMB, Perforin, CX3CR1, and T-bet; (H) NKG2D and KLRG1. The dashed box indicates samples that are analyzed collectively as a unified group. The GNLY+CD8+ T cell groups include HC (n = 10), TP (n = 18), INR (n = 23) and IR (n = 23); the PLWH group comprises TP, IR and INR; and the ART group includes IR and INR.
Figure 5.
Figure 5.
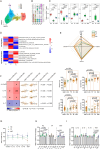
Enhanced bystander activation pathway in GNLY+CD8+ T cells. (A) UMAP visualization of CD8+ T cell subsets. (B) Violin plots depicting the expression distribution of canonical cell markers across five CD8+ T cell clusters. (C) Box plots showing the proportions of five CD8+ T cell subsets in HC, TP and ART groups. Each point represents one sample. (D) Heatmap displaying gene set activities of C03 subset, quantified as normalized enrichment scores (NES) from GSEA, for TCR-dependent and bystander activation pathways. (E) Radar chart and scatter plots showing the relative expression levels of CD127 (IL-7R), CD212 (IL-12R), CD122 (IL-15R) and CD218 (IL-18R) across HC (n = 10), TP (n = 18), IR (n = 23) and INR (n = 23) groups. (F) Heatmap, correlation plots and r-value demonstrating the correlation among the proportion and absolute count of GNLY+CD8+ T, as well as the plasma level of IL-7, IL-12p70, IL-15 and IL-18 in both IR and INR groups. (G-I) Line plots and scatter plots depicting changes in(G) the proportion and (H, I) fold change of GNLY+CD8+ T cells in HC, TP, and ART after different stimulation. Fold change values (H, I) are calculated relative to the control group. Control, medium; TCR, CD3/28 T cell activator.
Figure 6.
Figure 6.
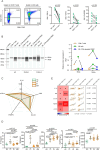
Pro-inflammatory potential of GNLY+CD8+ T Cells. (A) Representative flow cytometry and scatter plots illustrating the distribution of two isoforms of GNLY in NK and CD8+ T cells. (B) Capillary-based automated Western immunoblotting demonstrating protein expression levels of 9 and 15 kDa GNLY protein in isolated NK, CD8+ T and NK-,CD8-depleted PBMC from HC (n = 1) and PLWH (n = 2). GNLY expression levels were quantified and normalized to the total protein concentration. (C-D) Radar chart (C) and scatter plots (D) depicting the plasma level of IP-10, MIG, zounlin, PGRPS and sCD14 across HC (n = 11), TP (n = 13), IR (n = 19) and INR (n = 16) groups. (E) Heatmap, correlation plots and r-value demonstrating the correlation among the proportion and absolute count of GNLY+CD8+ T, as well as the plasma level of IP-10, MIG, Zonulin, PGRPS and sCD14 in both IR and INR groups.
Figure 7.
Figure 7.
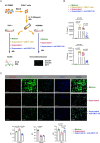
GNLY derived from CD8+ T cells activates monocytes and disrupt intestinal epithelial cells. (A) Schematic diagram depicting the workflow of the functional co-culture experiment. (B) Bar plots displaying the levels of IP-10 and MIG in the supernatant of THP-1 cells after 48 hours of co-culture across experimental groups. (C) Representative immunofluorescence images and statistical plots illustrating the expression levels of Zonulin, Claudin, and ZO-1 in NCM460 cells after 48 hours of co-culture.

References

    1. Wang FS, Zhang L, Douek D, et al. . Strategies for an HIV cure: progress and challenges. Nat Immunol. 2018;19(11):1155–1158. doi:10.1038/s41590-018-0242-8 - DOI - PubMed
    1. Wang XM, Zhang JY, Xing X, et al. . Global transcriptomic characterization of T cells in individuals with chronic HIV-1 infection. Cell Discov. 2022;8(1):29. doi:10.1038/s41421-021-00367-x - DOI - PMC - PubMed
    1. Marcus JL, Leyden WA, Alexeeff SE, et al. . Comparison of overall and comorbidity-free life expectancy between insured adults with and without HIV infection, 2000-2016. JAMA Netw Open. 2020;3(6):e207954. doi:10.1001/jamanetworkopen.2020.7954 - DOI - PMC - PubMed
    1. Franceschi C, Campisi J.. Chronic inflammation (inflammaging) and its potential contribution to age-associated diseases. J Gerontol A Biol Sci Med Sci. 2014;69(Suppl 1):S4–S9. doi:10.1093/gerona/glu057 - DOI - PubMed
    1. Franceschi C, Garagnani P, Parini P, et al. . Inflammaging: a new immune-metabolic viewpoint for age-related diseases. Nat Rev Endocrinol. 2018;14(10):576–590. doi:10.1038/s41574-018-0059-4 - DOI - PubMed