. 2025 Mar 3;47(3):171.
doi: 10.3390/cimb47030171.

Comparative Transcriptome Analysis of Two Types of Rye Under Low-Temperature Stress

Affiliations

Comparative Transcriptome Analysis of Two Types of Rye Under Low-Temperature Stress

Haonan Li et al. Curr Issues Mol Biol. .

Abstract

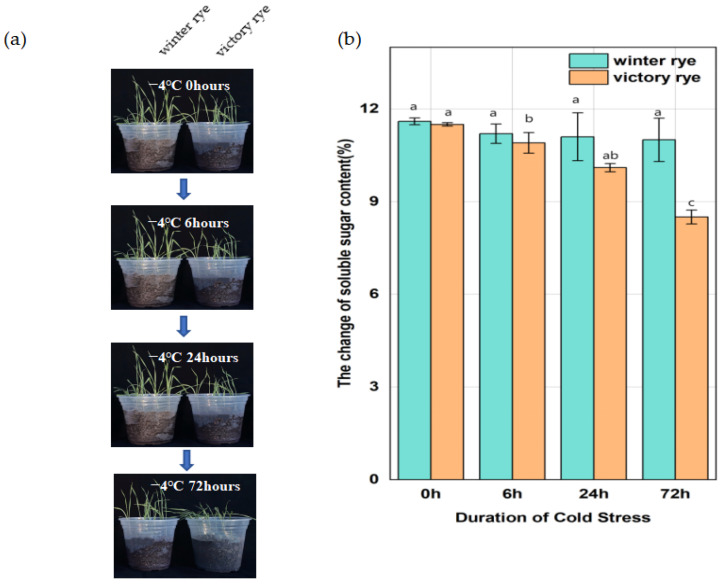
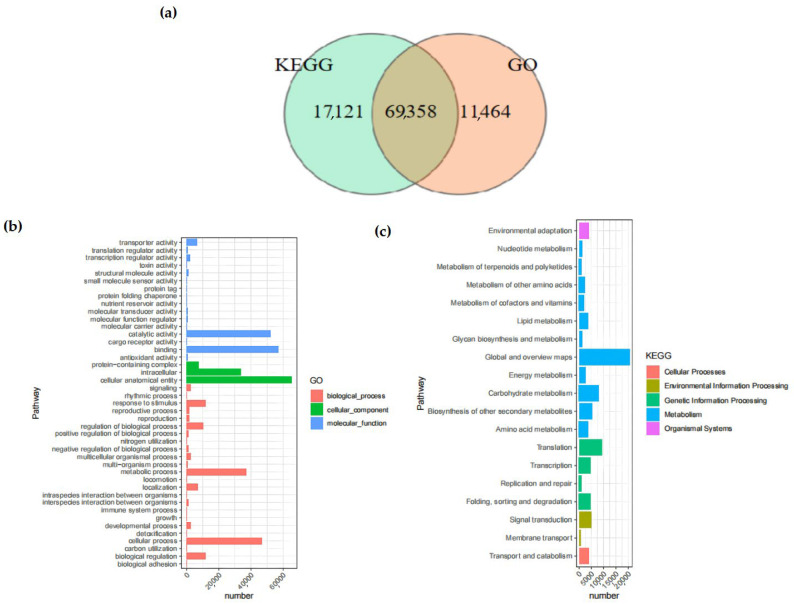
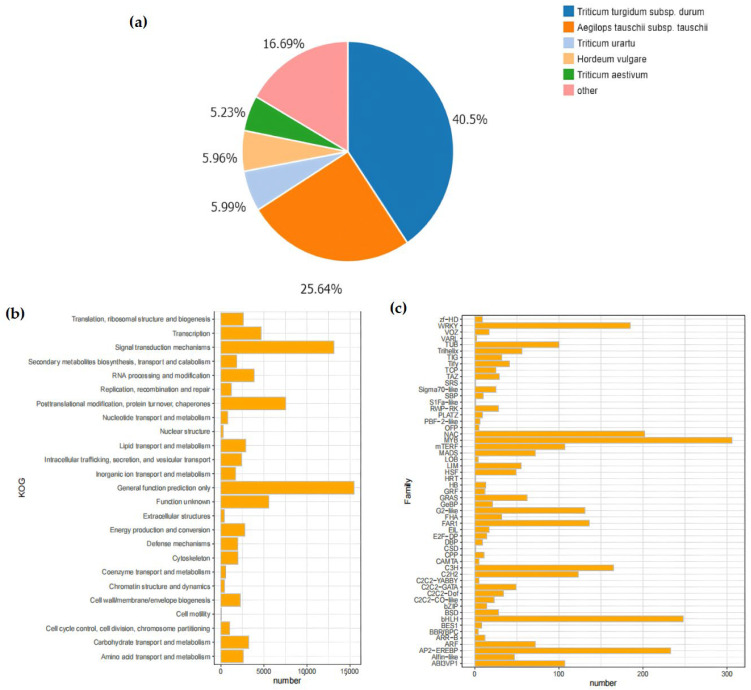
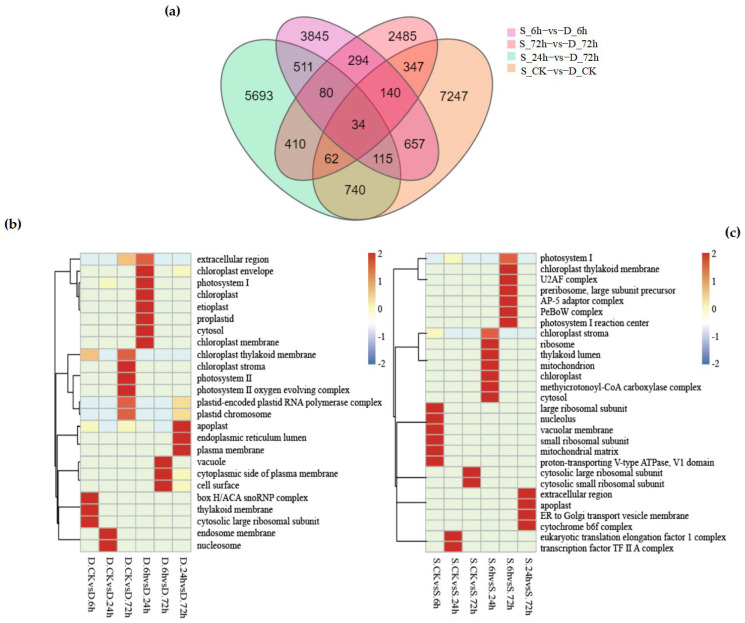
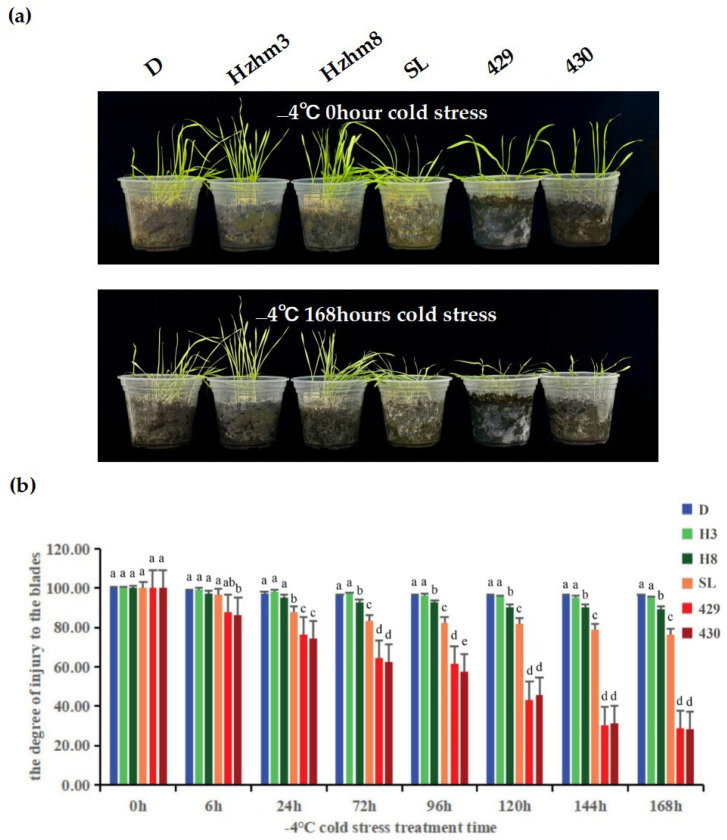
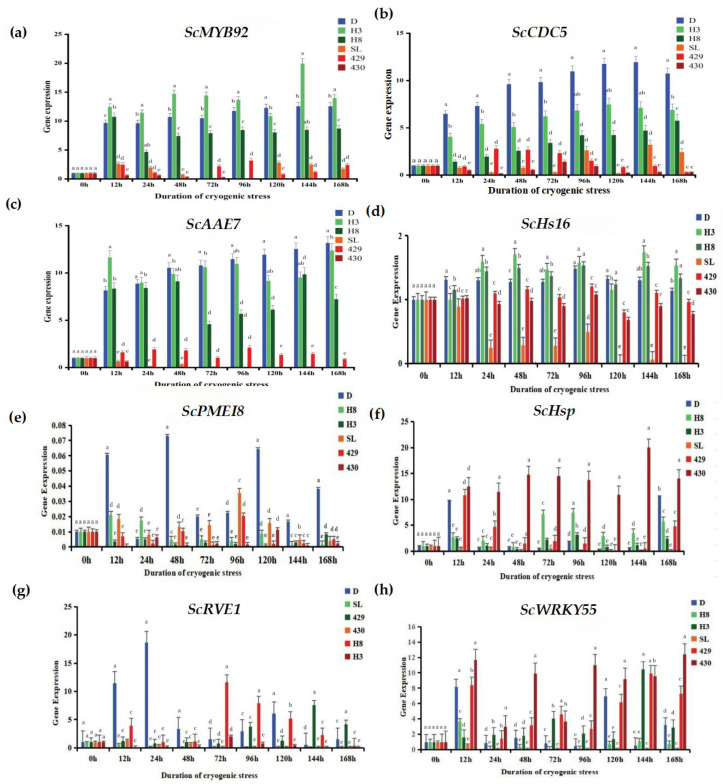
Wheat is a crucial food crop, and low-temperature stress can severely disrupt its growth and development, ultimately leading to a substantial reduction in wheat yield. Understanding the cold-resistant genes of wheat and their action pathways is essential for revealing the cold-resistance mechanism of wheat, enhancing its yield and quality in low-temperature environments, and ensuring global food security. Rye (Secale cereale L.), on the other hand, has excellent cold resistance in comparison to some other crops. By studying the differential responses of different rye varieties to low-temperature stress at the transcriptome level, we aim to identify key genes and regulatory mechanisms related to cold tolerance. This knowledge can not only deepen our understanding of the molecular basis of rye's cold resistance but also provide valuable insights for improving the cold tolerance of other crops through genetic breeding strategies. In this study, young leaves of two rye varieties, namely "winter" rye and "victory" rye, were used as experimental materials. Leaf samples of both types were treated at 4 °C for 0, 6, 24, and 72 h and then underwent RNA-sequencing. A total of 144,371 Unigenes were reconstituted. The Unigenes annotated in the NR, GO, KEGG, and KOG databases accounted for 79.39%, 55.98%, 59.90%, and 56.28%, respectively. A total of 3013 Unigenes were annotated as transcription factors (TFs), mainly belonging to the MYB family and the bHLH family. A total of 122,065 differentially expressed genes (DEGs) were identified and annotated in the GO pathways and KEGG pathways. For DEG analysis, 0 h 4 °C treated samples were controls. With strict criteria (p < 0.05, fold-change > 2 or <0.5, |log2(fold-change)| > 1), 122,065 DEGs were identified and annotated in GO and KEGG pathways. Among them, the "Chloroplast thylakoid membrane" and "Chloroplast" pathways were enriched in both the "winter" rye and "victory" rye groups treated with low temperatures, but the degrees of significance were different. Compared with "victory" rye, "winter" rye has more annotated pathways such as the "hydrogen catabolic process". Although the presence of more pathways does not directly prove a more extensive cold-resistant mechanism, these pathways are likely associated with cold tolerance. Our subsequent analysis of gene expression patterns within these pathways, as well as their relationships with known cold-resistance-related genes, suggests that they play important roles in "winter" rye's response to low-temperature stress. For example, genes in the "hydrogen catabolic process" pathway may be involved in regulating cellular redox balance, which is crucial for maintaining cell function under cold stress.

Keywords: cold-resistant candidate genes; low-temperature stress; rye; transcriptome.


Conflict of interest statement

The authors declare no conflicts of interest.

Figures

Figure 1
Figure 1
Changes in leaf growth status and soluble sugar content of “winter” rye and “victory” rye at different time points under different low-temperature stresses. (a) The left and right sides of each sampling time image depict the leaf growth conditions of “winter” rye and “victory” rye, respectively; (b) Bar chart presenting the variations in the soluble sugar content within the leaves of “winter” rye and “victory” rye following 0 h, 6 h, 24 h, and 72 h of low-temperature stress. Green symbolizes “winter” and orange stands for “victory”. The treatment at 0 h served as the control group, while the treatments at other time points were the experimental groups. The letters such as a, b, and c in the figure are the results marked based on statistical significance tests (such as multiple comparisons after analysis of variance). There is no significant difference in soluble sugar content among groups marked with the same letter; there are significant differences in soluble sugar content among groups marked with different letters.
Figure 2
Figure 2
Venn diagrams of Unigenes. (a) Comparison between Unigenes in KEGG analysis and those in GO analysis. The total number of Unigenes in the comparison combination is represented by the sum of the numbers in each large circle. The overlapping circles represent the quantity of shared Unigenes in each combination; (b) GO enrichment distribution of Unigenes. It shows the enrichment of Unigenes in pathways among biological processes, molecular functions, and cellular components; (c) KEGG enrichment distribution of Unigenes. It shows the enrichment of Unigenes in pathways among cellular pathways, environment, genetic information, metabolism, and organic systems. The abscissa indicates the enrichment factor, while the ordinate represents the names of the pathways. The length of the horizontal lines represents the number of Unigenes in the pathways, and the colors of the dots correspond to different pathways.
Figure 3
Figure 3
Analysis of database annotation results. (a) Pie chart of Unigenes annotated by the NR database, encompassing those in Lolium, Aegilops tauschii, Triticum urartu, Hordeum vulgare, Triticum aestivum, and so forth. The percentage of the pie chart indicates the quantity of Unigenes in each species; (b) The vertical axis lists different KOG functional categories, including translation, ribosome structure and biogenesis, transcription, signal transduction mechanisms, etc. The horizontal axis represents the number of Unigenes, ranging from 0 to 15,000. Each functional category corresponds to an orange bar, and the length of the bar indicates the number included in that functional category. From the figure, the quantitative distribution of different KOG functional categories can be intuitively seen; (c) Histogram of gene family distribution. In the figure, the horizontal axis represents the number of Unigenes distributed, ranging from 0 to 300, and the vertical axis lists different gene families. Each gene family corresponds to an orange bar, and the height of the bar indicates the quantity encompassed within that gene family.
Figure 4
Figure 4
Distribution of differentially expressed genes in “winter” rye and “victory” rye at different time points after cold stress. (a) The number of differentially expressed genes in various samples. Green and yellow represent the differentially expressed genes of “winter” rye and “victory” rye varieties, respectively; (b) The quantity of differentially expressed genes in “winter” rye and “victory” rye at diverse time points under cold stress. The treatment at 0 h served as the control group, while the treatments at other time points were the experimental groups. (c) shows the comparison between DEGs at different treatment times in “winter” rye (D) and DEGs in the control group CK; (d) shows the comparison between DEGs at different treatment times in “victory” rye (S) and DEGs in the control group CK. The treatment at CK served as the control group, while the treatments at other time points were the experimental groups. The total number of DEGs in the comparison combination is represented by the sum of the numbers in each large circle. The number of common DEGs in each combination is represented by the overlapping circles.
Figure 5
Figure 5
(a) displays the variations in differentially expressed genes (DEGs) between “Winter Rye” and “Victory Rye” at different treatment times: control (ck), 6 h, 24 h, and 72 h. The total count of numbers inside each large circle signifies the aggregate number of DEGs in the respective comparison combination, with overlapping circles indicating the shared number of DEGs among these combinations. (b) presents a comparison of various cellular component pathways in the “Winter Rye” variety under the same treatment conditions, specifically at control (ck), 6 h, 24 h, and 72 h. Here, the vertical axis denotes the pathway name, the horizontal axis represents the treatment time, and the color intensity indicates the enrichment level of DEGs in a given pathway. (c) shows the corresponding comparison for the “Victory Rye” variety. Note: In the figure, “Winter Rye” is abbreviated as D and “Victory Rye” as S.
Figure 6
Figure 6
(a) is a phenotypic diagram showing the leaf changes of six rye varieties under different low-temperature stress treatments. The left and right sides of each sampling time image depict the leaf growth conditions of D, Hzhm3, Hzhm8, SL, 429, and 430, respectively; (b) is a bar chart showing the degree of leaf injury of the six ryes under different low-temperature stress treatments; the degree of leaf injury was measured by a leaf area meter, and statistical methods were used to analyze the significant differential changes. The treatment at 0 h served as the control group, while the treatments at other time points were the experimental groups. The letters such as a–c in the figure are the results marked based on statistical significance tests (such as multiple comparisons after analysis of variance). For different rye varieties under the same cold stress treatment time, if the letters marked above them are the same, it indicates that there is no significant difference in the degree of leaf injury among these varieties statistically; if the marked letters are different, it indicates that there are significant differences in the degree of leaf injury among these varieties statistically.
Figure 7
Figure 7
Changes in the expression levels of cold stress-related genes. (a) Changes in the expression level of the ScMYB92 gene under different durations of cold stress treatment; (bh) represent the changes in the expression levels of cold stress-related genes ScMYB92, ScCDC5, ScAAE7, ScHs16, ScPMEI8, ScHsp, ScRVE1, ScWRKY55 determined by qRT-PCR. The treatment at 0 h served as the control group, while the treatments at other time points were the experimental groups. The letters such as a–c in the figure are the results marked based on statistical significance tests (such as multiple comparisons after analysis of variance). For different rye varieties under the same cold stress treatment time, if the letters marked above them are the same, it indicates that there is no significant difference in the degree of leaf injury among these varieties statistically; if the marked letters are different, it indicates that there are significant differences in the degree of leaf injury among these varieties statistically.

Similar articles

Cited by

References

    1. Gaikpa D.S., Koch S., Fromme F.J., Siekmann D., Würschum T., Miedaner T. Genome-wide association mapping and genomic prediction of Fusarium head blight resistance, heading stage and plant height in winter rye (Secale cereale) Plant Breed. 2020;139:508–520. doi: 10.1111/pbr.12810. - DOI
    1. Li G., Wang L., Yang J., He H., Jin H., Li X., Ren T., Ren Z., Li F., Han X., et al. A high-quality genome assembly highlights rye genomic characteristics and agronomically important genes. Nat. Genet. 2021;53:574–584. doi: 10.1038/s41588-021-00808-z. - DOI - PMC - PubMed
    1. Salih H., Bai W., Zhao M., Liang Y., Yang R., Zhang D., Li X. Genome-Wide Characterization and Expression Analysis of Transcription Factor Families in Desert Moss Syntrichia caninervis under Abiotic Stresses. Int. J. Mol. Sci. 2023;24:6137. doi: 10.3390/ijms24076137. - DOI - PMC - PubMed
    1. Ahrends H.E., Piepho H.-P., Sommer M., Ewert F., Webber H. Is the volatility of yields for major crops grown in Germany related to spatial diversification at county level? Environ. Res. Lett. 2024;19:104061. doi: 10.1088/1748-9326/ad7613. - DOI
    1. Wang X., Niu Y., Zheng Y. Multiple Functions of MYB Transcription Factors in Abiotic Stress Responses. Int. J. Mol. Sci. 2021;22:6125. doi: 10.3390/ijms22116125. - DOI - PMC - PubMed

LinkOut - more resources